Summary:
- Despite the recent stock decline, maintained “strong buy” rating on Palantir with a fair price estimate of $24.13, offering a 12.7% upside from current price.
- Q1 2024 earnings met expectations, highlighting PLTR’s stability amid market fluctuations.
- Projected future stock price for 2029 at $108.81, suggesting substantial annual returns of 40.8% from 2024-2033.
- Explored potential downsides, including stagnant government revenue, with a conservative downside estimate of 14.3%, reaffirming confidence in Palantir’s resilience at its current valuation.
Sundry Photography
Thesis
In my previous article on Palantir Technologies Inc. (NYSE:PLTR) I reiterated my “strong buy” rating on the stock, citing that my estimated fair price stood at $17.04 and an estimated future price for the year 2029 of $54.12.
Since that article, the stock has decreased by 10.50% due to the raised outlook of Palantir not impressing investors. Nevertheless, the company reported in-line EPS of $0.08 for Q1 2024 and beat on revenues by a 2.70% margin.
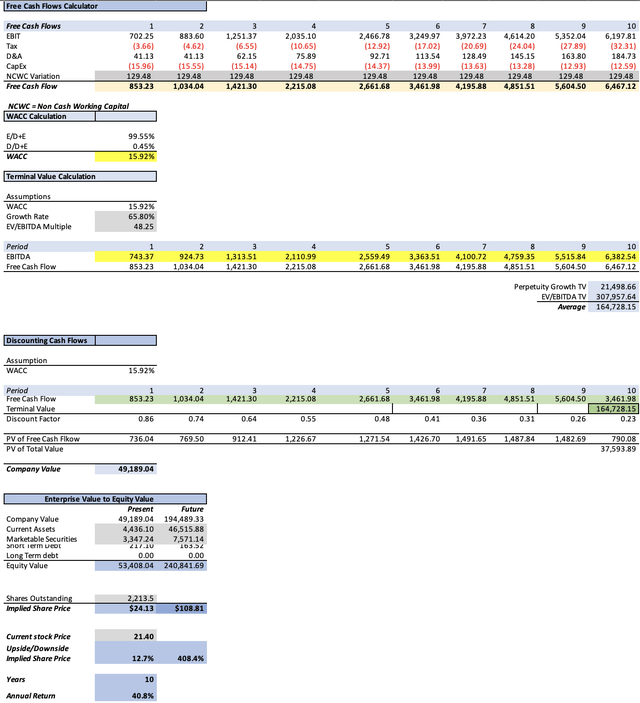
After re-evaluating the company, I arrived at a fair price estimate of $24.13, which is 12.7% above the current stock price of $21.40, and a future stock price for 2029 of $108.81, which implies 40.8% annual returns throughout 2024-2033.
Furthermore, I made a hypothetical scenario in which I assumed that Palantir’s government contract revenue stayed flat, and the result was that the stock could still deliver 30.2% annual returns throughout 2024-2029.
I reiterate my “strong-buy” rating on Palantir for these reasons.
Overview
Growth Plan
Palantir’s strategy is to focus on complex projects, which other parties often avoid due to their high cost of risks. Once a customer is acquired, Palantir tries to retain him by emphasizing the understanding of customers’ problems. The AIP boot camp is an example of this last one, as its objective is to accelerate customer discussions and provide experience. Furthermore, Palantir has pledged only to help the US and its allies and refuse any contract with nations unfriendly to the US.
Products
Palantir has 4 offerings. The first one is Gotham, whose main function is to identify patterns within different datasets to permit users to identify threats and make decisions based on those patterns.
Meanwhile, Foundry offers a unified platform to integrate and analyze data. Its main appeal is speed, which helps in experimenting and testing new ideas. It also tries to make it easy to use by offering a user-friendly UI.
Then, it’s Apollo, which is a centralized control layer through which users can deploy software, updates, and configure platforms across many environments (such as the cloud).
Lastly, it is AIP, which is a large language model that allows clients to receive automated responses to their questions on Palantir’s software.
How does Palantir Compare Against Peers?
There are already a lot of companies that offer data analytics for enterprises such as Oracle Corporation (ORCL), and Salesforce, Inc. (CRM), however, Palantir’s edge is in defense, and its popularity in defense is what has made it popular for the private sector.
The most prominent Palantir competitor could be Alteryx (which was bought this year by Clearlake Capital Group and Insight Partners for $4.4B). In March 2023, this company announced a partnership with the US Department of Defense as part of a program to integrate active-duty service members to transition to civilian careers.
Nevertheless, both Palantir and Alteryx, hold small market shares of the data analytics market, with Palantir holding around 0.75% and Alteryx 0.31% of the market.
Industry Outlook
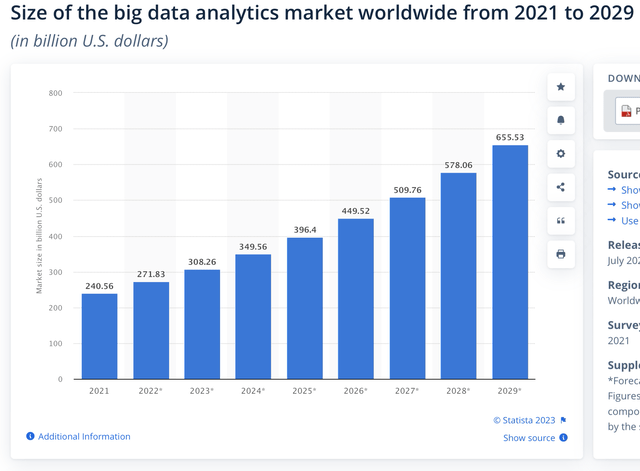
The big data analytics market is currently valued at $308.26B as of 2023, but in 2029, it’s expected to reach a valuation of $655.53 B. This implies a CAGR of 13.40% throughout the forecasted period. This means that Palantir’s current and future addressable markets are huge, however, as previously said, there are a lot of big players here, especially in the commercial sector.
Can Palantir Achieve This Growth Rate?
Palantir’s government contracts revenue has increased by 18.11% annually since 2021. Meanwhile, its commercial revenue has been growing by 27.79% since 2021. This last one grew 9.68% faster than the first one. So, Palantir is, in fact, outperforming the market.
One of the factors influencing this may be that private companies have more flexibility on the budget than the government, whose budget is set once a year and requires approval from Congress for extraordinary budgets.
Valuation
I will value Palantir with a DCF model. This DCF model will be a 10-year one, since after observing the earnings estimates on Seeking Alpha, I saw that they go all the way up to 2033, which means that valuation models are being done on that timescale, and any model with fewer years, will suggest that Palantir is hugely overvalued.
The first step is the WACC, which I calculated with the already-known formula. The resulting WACC was 15.92%. You can see the calculation on the DCF model. Then, the perpetuity growth rate was determined by dividing the expected cash flow annual growth of 59.21% by the difference between the WACC and the expected FCF growth. The resulting perpetuity growth rate was 1.36%.
Furthermore, D&A expenses will be calculated with a margin tied to revenue, which came out at 1.44%.
| TABLE OF ASSUMPTIONS | |
| (Current data) | |
| Assumptions Part 1 | |
| Equity Market Price | 47,660.00 |
| Debt Value | 217.10 |
| Cost of Debt | 1.61% |
| Tax Rate | 0.52% |
| 10y Treasury | 4.470% |
| Beta | 1.91 |
| Market Return | 10.50% |
| Cost of Equity | 15.99% |
| Assumptions Part 2 | |
| CapEx | 13.00 |
| Capex Margin | 0.56% |
| Net Income | 298.60 |
| Interest | 3.50 |
| Tax | 22.70 |
| D&A | 33.50 |
| EBITDA | 358.30 |
| D&A Margin | 1.44% |
| Revenue | 2,334.2 |
| R&D Expense Margin | 22.41% |
Now, it’s time to calculate revenue. However, I need to clarify that it’s impossible to know how many government contracts is Palantir going to get because they are awarded in the function of a Dutch-style bid, which means that the winner is the one who offered the lowest price. And the problem is that this information is privileged.
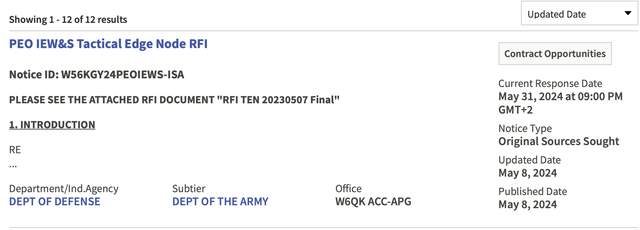
For example, currently, there is a contract for tactical edge nodes from the army. However, we can only estimate how much would the total contract be, since the government does not put a maximum budget on SAM.gov.
After searching for all the awarded contracts that involved edge computing since May 18, 2023, the total amount of these contracts amounted to $319.87M, which means that the average contract was $45.69M. This means that to arrive at the average revenue estimate for 2024 of $2.7B, Palantir would need to win approximately 5.7 new contracts. That’s achievable since in 2023 Palantir got awarded around 4 contracts worth $770M collectively (I will go into more detail in the section “How many contracts did Palantir get in 2023?”). So, what I am going to do is imply that Palantir will get around 5.7 new government contracts per year at a value of $45.49M each.
Then, here is the thing, will Palantir retain the contracts it currently holds? Well first of all, again, that’s privileged information, so I can only estimate. According to Palantir’s 2023 10-K, the vast majority of its clients (be it commercial or government) decide to expand the partnership. So I will assume, those contracts will be held and the total amount of contracts will grow over time.
Historically, existing customers have expanded their relationships with us, which has resulted in a limited number of customers accounting for a substantial portion of our revenue. If existing customers do not make subsequent purchases from us or renew their contracts with us, or if our relationships with our largest customers are impaired or terminated, our revenue could decline, and our results of operations would be adversely impacted.
| Amount of Contracts | Value per Contract (In Millions) | |
| FY2023 | 26.74 | 45.69 |
| FY2024 | 32.44 | 45.49 |
| FY2025 | 38.14 | 45.49 |
| FY2026 | 43.84 | 45.49 |
| FY2027 | 49.54 | 45.49 |
| FY2028 | 55.24 | 45.49 |
| FY2029 | 60.94 | 45.49 |
| FY2030 | 66.64 | 45.49 |
| FY2031 | 72.34 | 45.49 |
| FY2032 | 78.04 | 45.49 |
| FY2033 | 83.74 | 45.49 |
The results imply that Palantir’s government revenue will grow by 21.17% annually, which represents a higher growth rate than the 18.11% displayed for 2021-2023. Is this possible? In my opinion, yes, because as explained in the “Growth Strategy” section, Palantir focuses on getting the riskier contracts, which means that there is less competition and therefore as Palantir grows, it will have more resources to get on these riskier contracts.
Then in the “Can Palantir Achieve These Growth Rates” section, I said that the commercial segment grew 9.68% faster than the government segment. For that reason, I am going to make the commercial segment grow at a 30.85% annual pace for 2024-2029 and 15.42% for 2029-2033.
| Government | Commercial | |
| FY2023 | 1,222.2 | 1,002.8 |
| FY2024 | 1,475.7 | 1,312.1 |
| FY2025 | 1,735.0 | 1,716.9 |
| FY2026 | 1,994.3 | 2,246.5 |
| FY2027 | 2,253.6 | 2,939.5 |
| FY2028 | 2,512.9 | 3,846.3 |
| FY2029 | 2,772.2 | 5,032.8 |
| FY2030 | 3,031.5 | 5,809.1 |
| FY2031 | 3,290.7 | 6,705.1 |
| FY2032 | 3,550.0 | 7,739.3 |
| FY2033 | 3,809.3 | 8,933.0 |
| Growth Rate % | 21.17% | 30.85% |
Then, to calculate net income, I will first start with the cost of revenues. Palantir’s current gross margin is 81.15%, which I will keep constant since it’s already a high figure.
Then for general & administrative expenses, I decided to divide the current number of $1.26B by the current amount of full-time employees, which is $3.73B. This yielded a result of $340K per employee (personally, one of the highest numbers I’ve seen). Then I assume that Palantir will be adding 407.5 new employees, as it did during 2021-2023. However, in 2024 workforce will be 3.67K because Palantir decided to cut 2% of its workforce to cut costs because of declining momentum due to the current high-interest rates environment. The same will happen in 2027 (I will later explain why).
Then, R&D expenses are currently 22.41% of gross profit, which will remain constant throughout the projection.
Then it’s time for interest income and expenses. Total debt will continue to decrease at the 5-5% rate displayed in 2021-2024TM. Marketable securities will grow at the 17.7% pace displayed by total cash reserves in the previously mentioned period.
Then, I found that during high interest rates (such as now), Palantir paid an interest of 1.61% on its debt and received around 4.63% in annual returns from its marketable securities. However, during low interest rates (such as in 2019), the company paid 0.78% interest on debt and received an annual return of 1.40% from its marketable securities.
These numbers will be used in the following way: for 2024, I will use the numbers from the “high interest rates” column, as well as for 2027 (when I expect interest rates to be hiked again).
| During High Interest Rates (2023) | During Low Interest Rates (2019) | |
| Marketable Securities | 3,347.50 | 1,079.20 |
| Interest Income | 155.10 | 15.10 |
| Return % | 4.63% | 1.40% |
| Total Debt | 217.10 | 396.10 |
| Interest Payment | 3.50 | 3.10 |
| Cost % | 1.61% | 0.78% |
Then, income tax expenses are calculated on the current tax rate of 0.52%.
Finally, to suggest which could be the stock price for 2033, I will do the opposite of discounting by using the undiscounted cash flows that are highlighted in green.
Then I will predict which could be the value of each of the elements that compose equity. The selected data frame for this was 2021-2024TMM. This means that current assets will grow by 60% annually, long-term debt will stay at zero, and short-term debt will contract by 5.5% annually. Marketable securities were already calculated when predicting net incomes.
As you can see, the model suggests that Palantir has an upside of 12.7% from the current stock price of $21.40, and suggests that for 2033, the stock price should be $108.81, which translates into annual returns of 40.8%.
What happens if Palantir is not able to grow its government revenue?
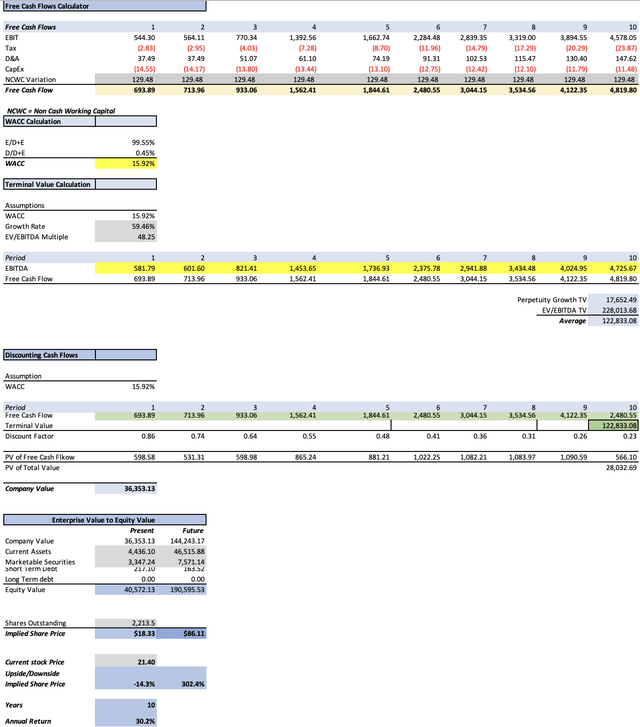
If Palantir’s government contract revenue stays flat at $1.22B per year, but commercial revenue growth is sustained at 30.85%, then the EBITDAs will look like this:
| Revenue | Net Income | Plus Taxes | Plus D&A | Plus Interest | |
| FY2024 | $2,612.3 | $543.83 | $540.99 | $578.49 | $581.79 |
| FY2025 | $3,022.8 | $565.54 | $562.59 | $600.09 | $601.60 |
| FY2026 | $3,558.2 | $772.94 | $768.91 | $819.98 | $821.41 |
| FY2027 | $4,257.0 | $1,397.05 | $1,389.77 | $1,450.86 | $1,453.65 |
| FY2028 | $5,169.6 | $1,670.17 | $1,661.46 | $1,735.65 | $1,736.93 |
| FY2029 | $6,362.0 | $2,295.23 | $2,283.27 | $2,374.57 | $2,375.78 |
| FY2030 | $7,144.1 | $2,837.60 | $2,837.60 | $2,940.13 | $2,941.88 |
| FY2031 | $8,045.9 | $3,317.35 | $3,317.35 | $3,432.82 | $3,434.48 |
| FY2032 | $9,086.0 | $3,892.99 | $3,892.99 | $4,023.39 | $4,024.95 |
| FY2033 | $10,285.6 | $4,579.53 | $4,579.53 | $4,727.15 | $4,725.67 |
| ^Final EBITDA^ |
As you can see, Palantir now has a potential downside of 14.3%, the suggested fair price is $18.33m and the future price is $86.11. This last one still leaves enough room for considerable annual returns of 30.2%.
This should demonstrate that Palantir has all the odds for prospering, since not getting any contracts in one year is a catastrophic scenario. The odds of this happening are low since it would require a very serious event such as a huge data leak, or it being massively hacked.
How many Contracts did Palantir get in 2023?
In 2023, Palantir got 4 huge contracts. The first one was with the US Special Operations Command, which was worth $463M. Then another one with the US Army for researching and developing AI tools for military purposes worth $250M. Another one with the US DoD for research and development services worth $60M. Combined, these contracts are worth $770M.
Risks to Thesis
Having cleared the risk of not getting new government contracts, the main factor that remains is that Palantir is not able to grow its commercial revenue. This will, of course, push the potential downside lower to the point that it’s no longer profitable to invest in Palantir.
The other risk is that in what concerns the competition, since at government contracts, Palantir has the AI edge, however, in the commercial sector, there is Salesforce, Oracle, etc. However, Palantir has partnered with Oracle, which gives Palantir a sort of “shield” in the market.
Conclusion
In conclusion, Palantir still retains its investment appeal. Palantir has proved to be able to close multi-million dollar contracts with the US government. According to my calculations, Palantir should be able to maintain its current government revenue and at the same time, close $260.43M in contracts every year, which is under the $770M in new contracts that Palantir got in 2023.
Additionally, even in this hypothetical scenario, where Palantir is not capable of getting new government contracts, the potential downside stood at 14.4%, and the annual returns throughout 2033 at 30.2%.
My actual estimates indicate a 12.7% upside and potential annual returns of 40.8%. This means a fair price of 24.13 and an estimated stock price for 2033 of $108.81.
For these reasons, I reiterate my “strong-buy” rating on Palantir. For the next quarters, I will focus on the only two segments that Palantir has: government and commercial, and see how they continue to perform, as well as how Palantir manages its balance sheet (which could change the future price).
Analyst’s Disclosure: I/we have no stock, option or similar derivative position in any of the companies mentioned, and no plans to initiate any such positions within the next 72 hours. I wrote this article myself, and it expresses my own opinions. I am not receiving compensation for it (other than from Seeking Alpha). I have no business relationship with any company whose stock is mentioned in this article.
Seeking Alpha’s Disclosure: Past performance is no guarantee of future results. No recommendation or advice is being given as to whether any investment is suitable for a particular investor. Any views or opinions expressed above may not reflect those of Seeking Alpha as a whole. Seeking Alpha is not a licensed securities dealer, broker or US investment adviser or investment bank. Our analysts are third party authors that include both professional investors and individual investors who may not be licensed or certified by any institute or regulatory body.


