Summary:
- Cisco Systems managed to beat analyst expectations in their Q3 earnings report, despite significant declines in revenue.
- Cisco is raising revenue guidance for fiscal year 2024, surpassing the prior consensus in analyst estimates.
- Revenues from the networking segment displayed weaknesses, but Cisco’s acquisition of Splunk adds significant positives to the balance sheet.
- A series of technical signals suggest that CSCO shares could be on the verge of breaking higher, while trading structures may offer favorable risk-reward metrics.

hapabapa/iStock Editorial via Getty Images
Cisco Systems, Inc. (NASDAQ:CSCO) is looking very well-positioned after beating analyst expectations in the company’s most recent earnings report, despite showing the largest declines in revenue seen in 15 years. During the fiscal third-quarter period, Cisco recorded per-share earnings of $0.88 (surpassing analyst estimates of $0.82) alongside revenues of $12.7 billion (surpassing analyst estimates of $12.53 billion). Overall, these figures indicate annualized revenue declines of 13%, which is the sharpest negative year-over-year change since 2009 while net income figures printed at $0.46 per share (or $1.89 billion). Relative to the $0.78 per share ($3.21 billion) that was reported during the same period last year, these figures indicate annualized declines of 41%.
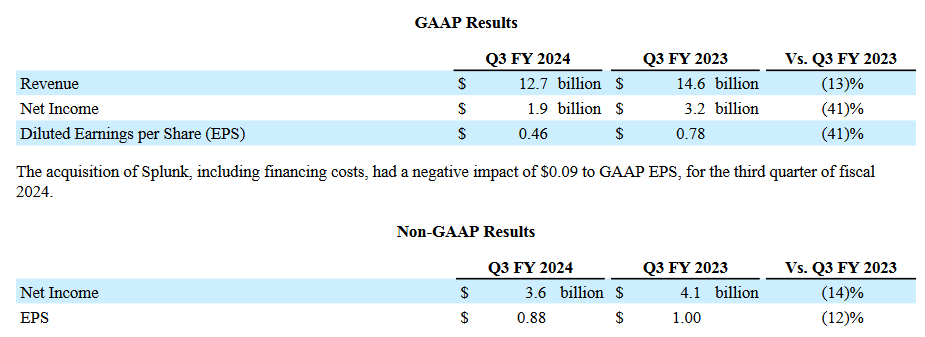
Q4 FY 2024 Earnings Release (Cisco)
In the statement accompanying this latest earnings release, management also explained that recent performance declines can be attributed to delays that may have resulted from consumer clients that are configuring equipment purchased in prior quarters, with Cisco CEO Chuck Robbins adding:
We delivered a solid Q3 performance in what remains a dynamic environment…Our unique ability to bring together networking, security, observability, and data enables Cisco to offer our customers unrivaled digital resilience for the AI era.

Q4 FY 2024 Earnings Release (Cisco)

Q4 FY 2024 Earnings Release (Cisco)
Additionally, Cisco raised its revenue guidance for the 2024 fiscal year, with the company now expecting to see top-line figures that post within a $53.6 billion – $53.8 billion range (which surpasses the prior analyst consensus of $53.14 billion and is higher than Cisco’s previous expected range of $51.5 billion – $52.5 billion). On the earnings side, Cisco now expects to see a more constricted potential range of $3.69 – $3.71 per-share for the full-year period (versus the $3.68 to $3.74 per-share range the technology company signaled previously). Overall, these figures are still above the prior analyst consensus estimates calling for $3.67 per share for the period.
On the negative side, revenues from Cisco’s networking segment showed an annualized decline of 27% (at $652 billion) and it will be important for investors to continue watching for developments in this area because this segment (responsible for the development of switches for data-centers) still accounts for most of Cisco’s broader revenue figures. Other quarterly developments of note include the acquisition of Splunk for $28 billion. In broad terms, Cisco’s purchase of the software security developer reduced adjusted per-share earnings for the quarter by $0.01. However, the acquisition also added revenues of $413 million to the balance sheet during the third-quarter period.
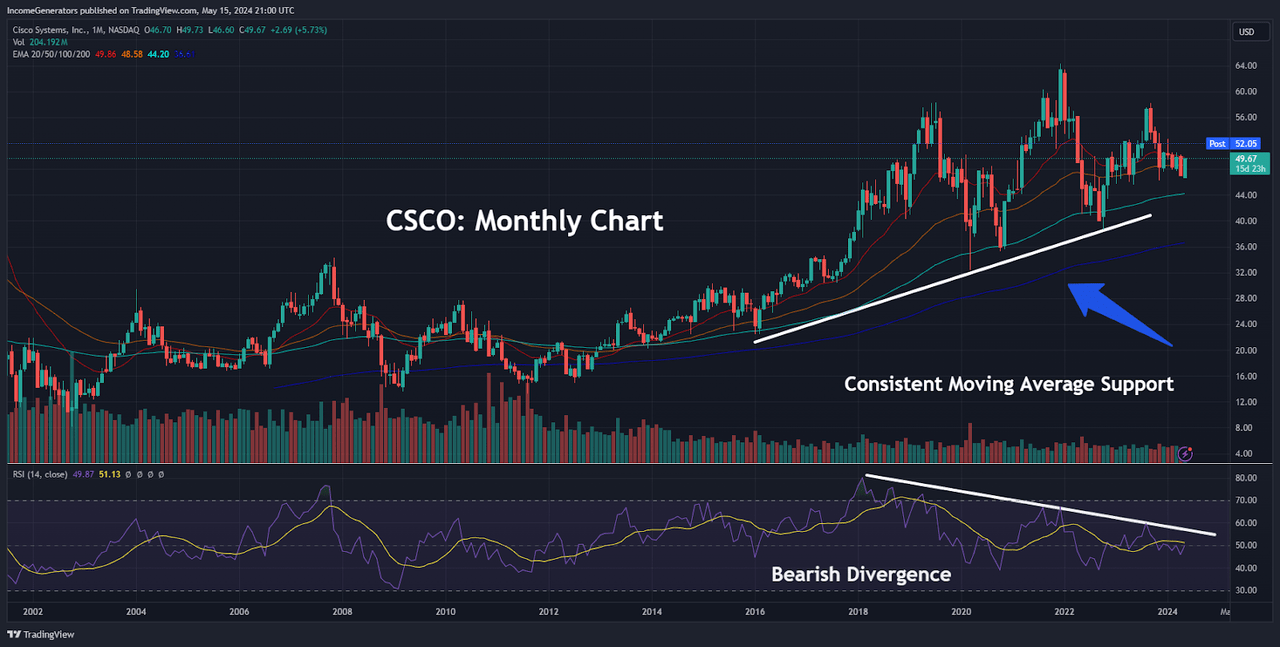
CSCO: Monthly Chart (Income Generator via TradingView)
Over the last year, it is undeniable that CSCO shares have really languished when compared to the rest of the stock market. Prior to the company’s most recent earnings release, CSCO is actually trading lower (by 2%) on a year-to-date basis, even though the S&P 500 has posted firmly positive performances (with gains of 11% during the same period of time). On the monthly charts, we can actually find some interesting evidence and conflicting technical signals which can help to explain these performances. On the positive side, we can see that CSCO has consistently managed to find support near the monthly exponential moving averages (EMAs). In the chart above, we can see that these modest bounces tend to occur near the 20-month, 50-month, and 100-month EMAs – and this has often prevented further downside tests of the 200-month EMA. On the other hand, we can also see that a clear bearish divergence has developed with regard to the monthly indicator readings in the Relative Strength Index (RSI). Generally speaking, these are the types of conditions that tend to prevail before significant declines are seen in share values.
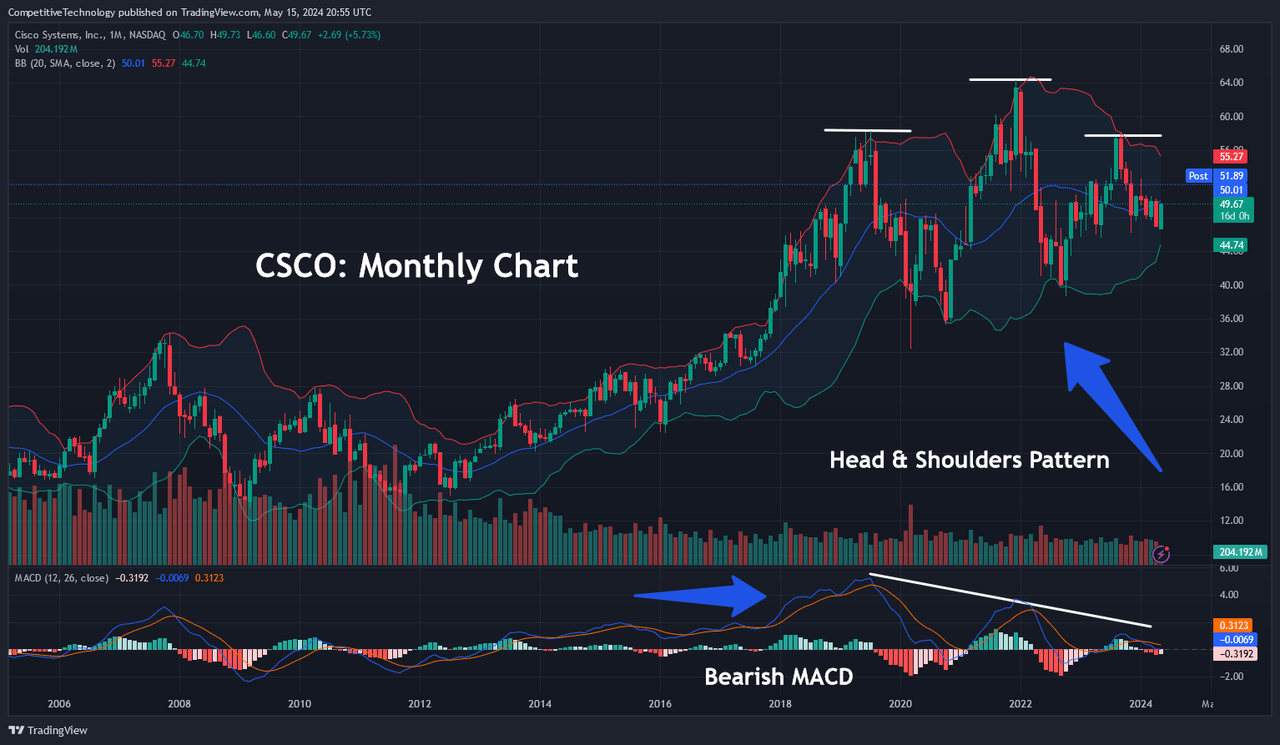
CSCO: Head and Shoulders Pattern (Income Generator via TradingView)
In addition to this, the monthly chart also shows a Head and Shoulders pattern that is relatively well-defined. Of course, this is also a bearish pattern that projects an acceleration of downside price action once the “neckline” is broken. In this specific chart history, the neckline itself is the aspect of the pattern that is least well-defined, but we would submit that the historical support zone near the $46 level works as a viable price level for this aspect of the pattern.
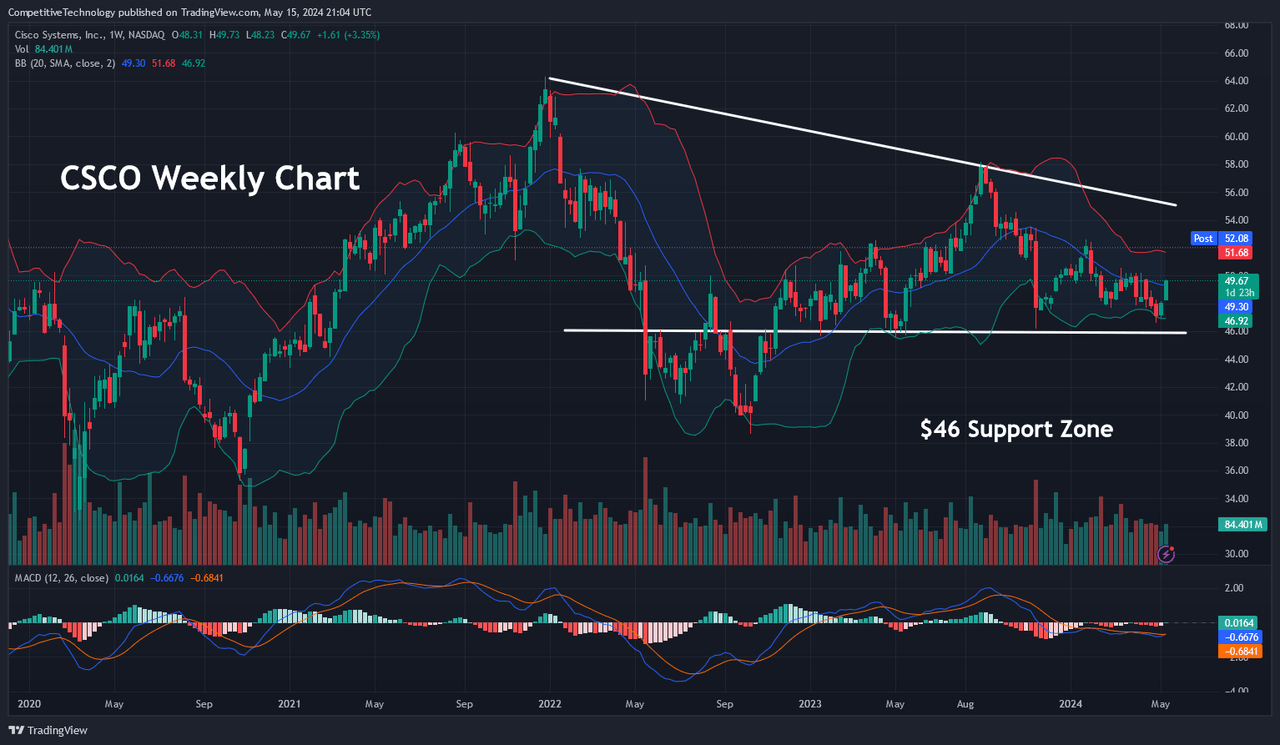
Critical Support Zone (Income Generator via TradingView)
Moving down to the weekly charts, we can see a better depiction of the various price consolidation structures that have developed near this level (which also marks the historical lows from May 2023). In order for a Head and Shoulders pattern to become confirmed, we would need to see a downside break of this neckline region before we can fully turn bearish in the technical outlook. For these reasons, we are currently viewing price support as the “line in the sand” that we will use to define differences between the bullish and bearish perspectives.
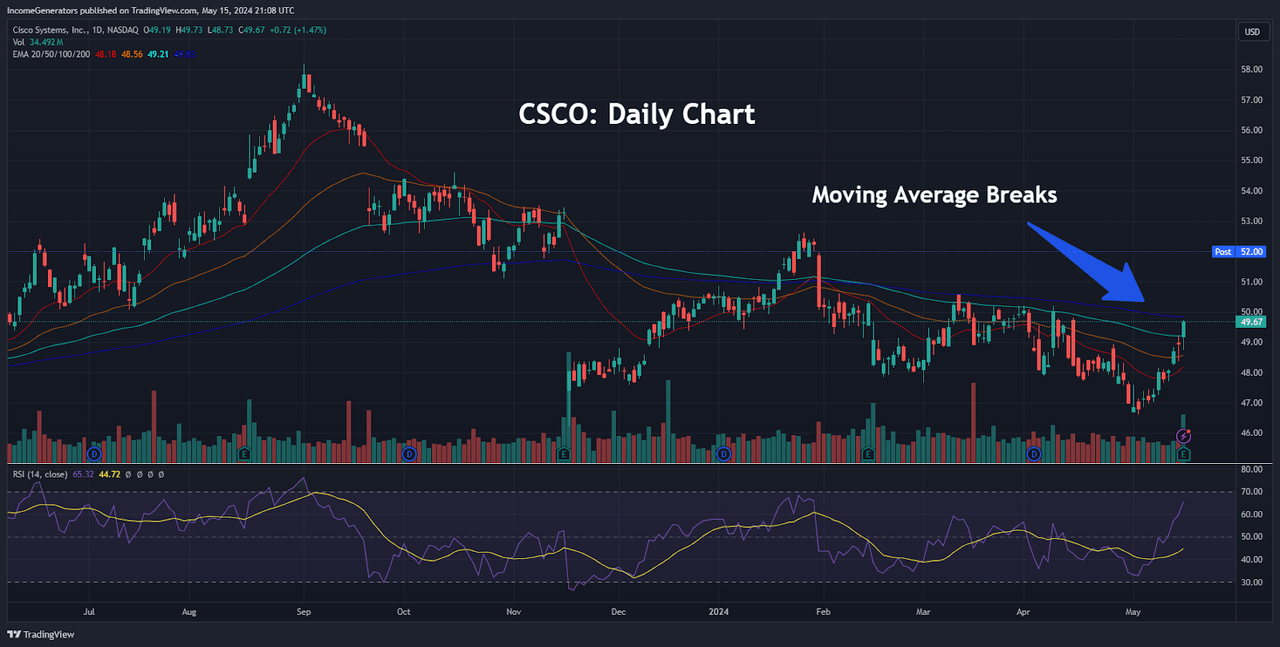
CSCO: Moving Average Breaks (Income Generator via TradingView)
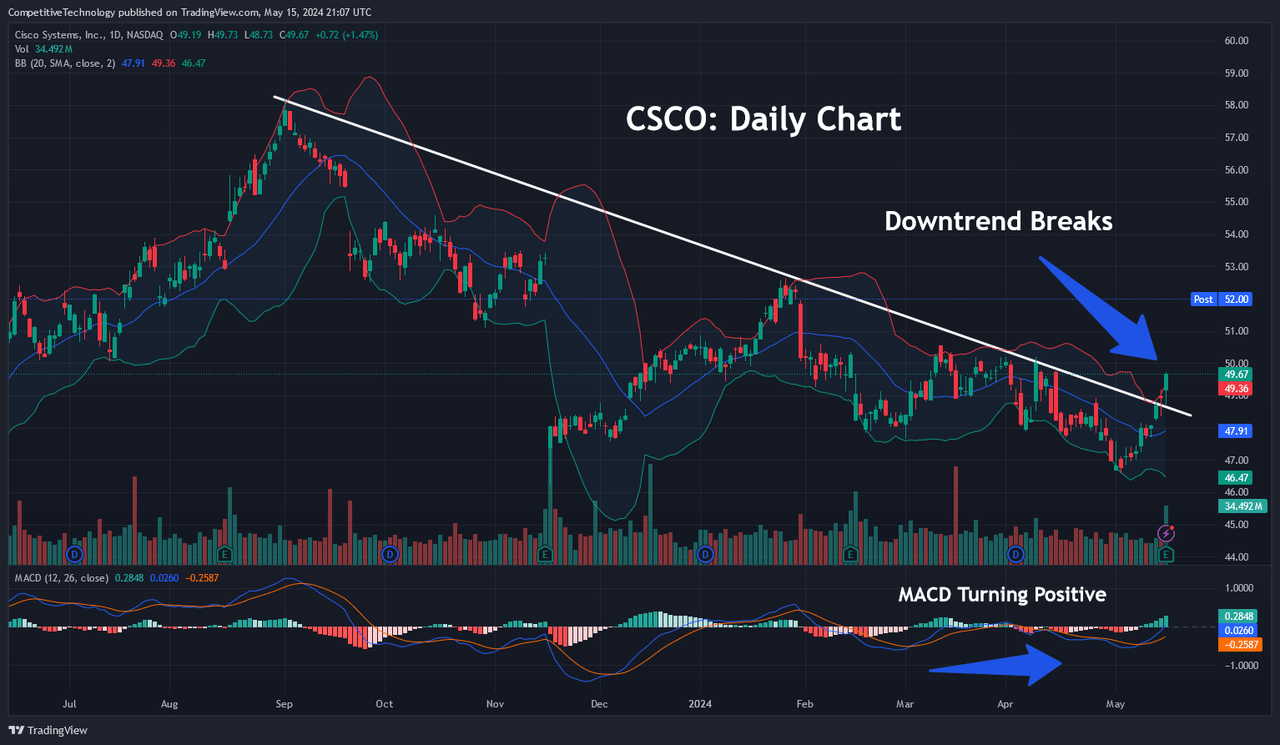
Daily Downtrend Breaks (Income Generator via TradingView)
On the positive side, we do see evidence on the daily charts which suggests that the neckline will be preserved (and that price support near $46 per share will remain intact). Specifically, we will point to the recent break in the daily downtrend line that is visible on this timeframe. At the same time, daily indicator readings in the Moving Average Convergence Divergence (MACD) appear to be moving into bullish territory and if we see a majority of positive response to Cisco’s most recent earnings release within the broader market, these signals would indicate the potential for excellent risk-reward ratios for long positions taken near current levels.
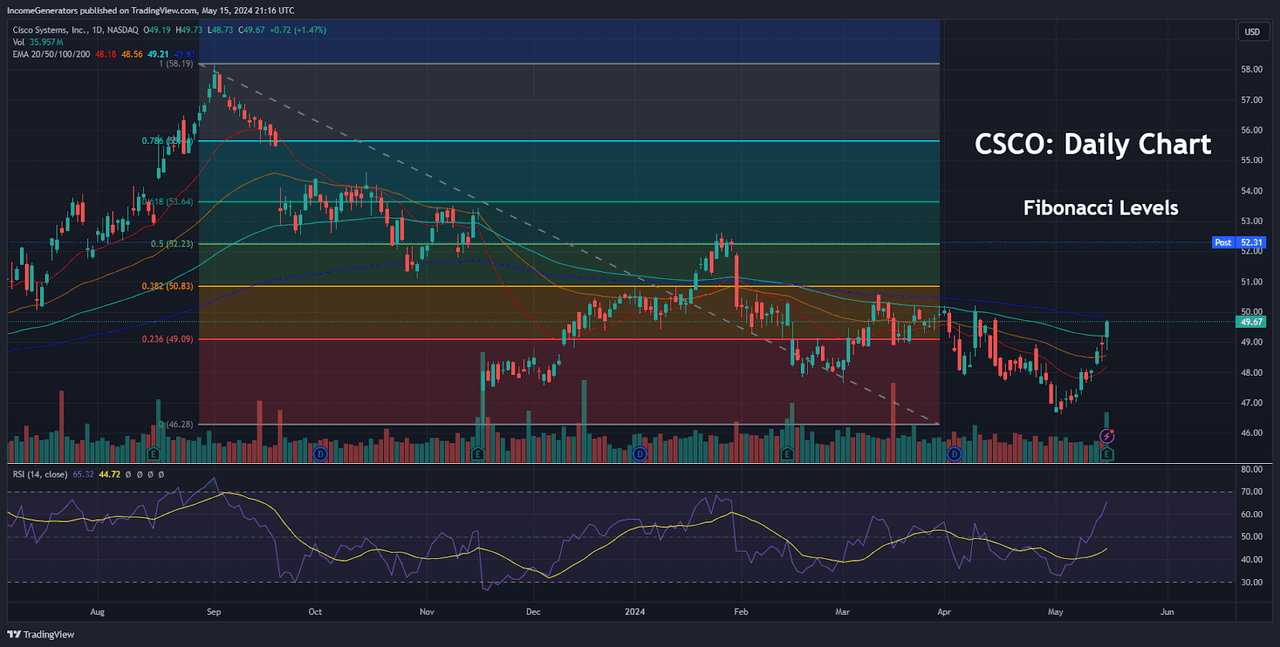
CSCO: Daily Fibonacci Levels (Income Generator via TradingView)
As long as our bullish outlook remains intact (and the critical $46 level is not breached to the downside), it will be important for investors to start identifying potential upside price targets for long positions. To accomplish this, we can use Fibonacci retracement analysis in order to define possible resistance levels to the topside. If we use the September 2023 highs of $58.19 and the November 2023 lows of $46.20 as the basis for our dominant trending move, we can see that the 23.6% and 38.2% retracements have already been broken (which would both qualify as highly bullish events). But perhaps most interestingly, share prices did find strong resistance at the 50% retracement of the aforementioned price move after failing near the January 2024 highs of $52.62. Of course, this failure does inject potential risks for the bullish outlook, but we will still need to see a downside break of $46 per share before we would alter our positive stance on the stock. Unless (or until) that occurs, we are looking toward the 61.8% Fibonacci retracement (located at $53.64) and the 78.6% Fibonacci retracement (located at $55.63) as potential upside targets that could be reached before share prices start to encounter renewed selling pressure.
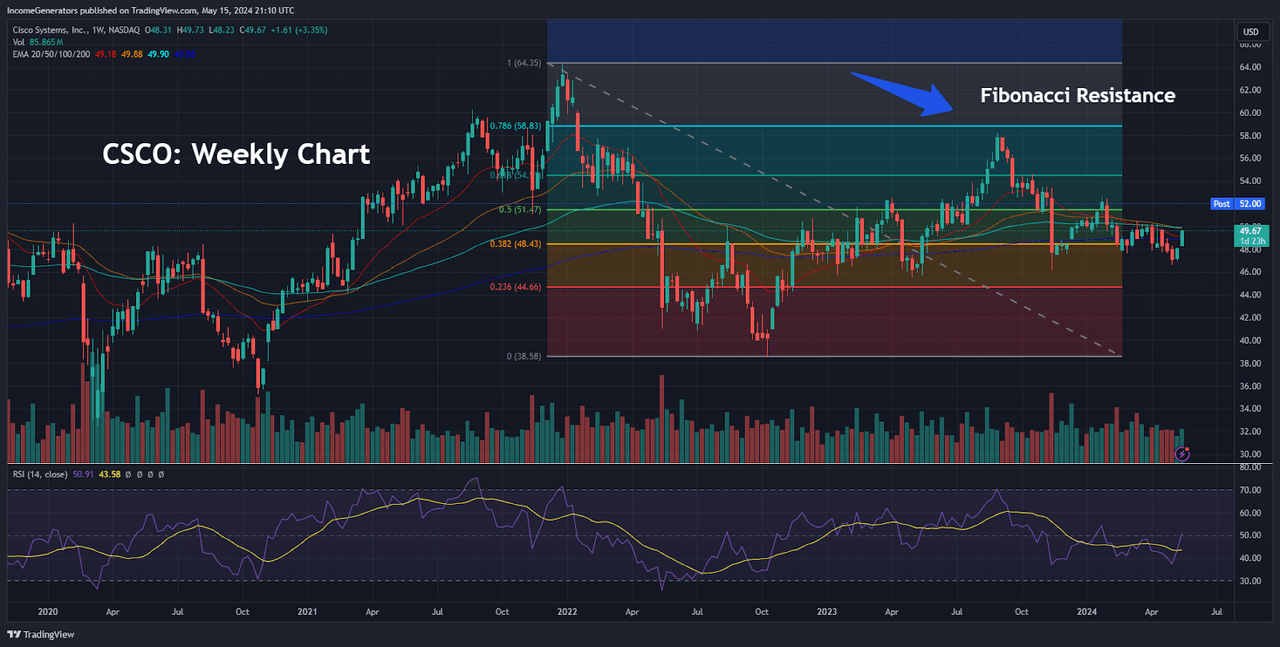
CSCO: Weekly Fibonacci Levels (Income Generator via TradingView)
Finally, we want to conduct a similar analysis using the longer-term timeframes (weekly charts) because there are somewhat different interpretations that can be drawn from this information. Using the December 2021 highs at $64.29 and the October 2022 lows of $38.60 as the dominant trend move, we can see that CSCO shares found strong resistance at the 78.6% retracement before failing at the August 2023 highs of $58.19. Since these price structures will be viewed as the dominant trend move in the event that the critical $46 per share level is breached to the downside, it will be important for investors to understand that the next downside price target would then shift to the October 2022 lows ($38.60). For these reasons, we think it would be prudent to establish long positions near current levels, with a stop loss placed below the aforementioned pivot point. On balance, we are expecting to see a favorable response to Cisco’s quarterly earnings results based on the fact that the company still managed to beat analyst expectations for both guidance figures and earnings figures even while seeing revenue declines for the period. Fortunately, the company’s acquisition of Splunk is already starting to show strong evidence of positive results, and we believe that this puts Cisco on a solid footing to meet these positive earnings revisions in the quarters ahead.
Analyst’s Disclosure: I/we have a beneficial long position in the shares of CSCO either through stock ownership, options, or other derivatives. I wrote this article myself, and it expresses my own opinions. I am not receiving compensation for it (other than from Seeking Alpha). I have no business relationship with any company whose stock is mentioned in this article.
Seeking Alpha’s Disclosure: Past performance is no guarantee of future results. No recommendation or advice is being given as to whether any investment is suitable for a particular investor. Any views or opinions expressed above may not reflect those of Seeking Alpha as a whole. Seeking Alpha is not a licensed securities dealer, broker or US investment adviser or investment bank. Our analysts are third party authors that include both professional investors and individual investors who may not be licensed or certified by any institute or regulatory body.
