Summary:
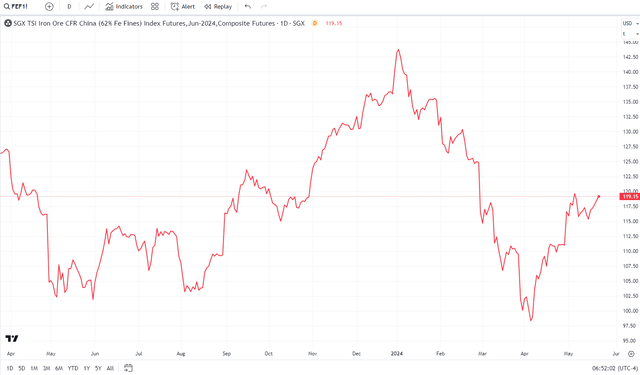
- Iron ore prices have rebounded in Q2, benefiting Brazil-based Vale S.A., the largest producer of iron ore.
- Vale’s Q1 net profit was hampered by weakness in commodity prices, but a resource rebound could boost earnings in the current quarter.
- Vale’s valuation is compelling, but its technical chart shows caution, with key support at $11 and resistance at $15.
temizyurek
Resource commodity prices have been extremely strong so far in 2024. Much of the attention has been focused on base and industrial metals, like copper, but iron ore has rebounded from a tough start to the year. Perhaps the most highly correlated stock to iron ore is the Brazil-based Vale S.A. (NYSE:VALE) Among the most risk-on and highly risky emerging-market stocks, shares are priced very cheaply while its technical chart shows a clear pattern that investors should monitor.
I have a hold rating on the stock. While I very much like the valuation, for a cyclical play such as this, I really want to see price-action confirmation before putting a buy rating on the stock.
Iron Ore Prices Rebounding in Q2
TradingView
Vale is one of the largest producers of iron ore and pellets, and one of the largest nickel producers in the world. Vale also produces copper, coal, manganese, and ferroalloys and holds equity stakes in some steel producers/projects.
Back in April, Vale reported a 9% year-on-year drop in first-quarter net profit. The $1.68 billion figure was hampered by near-term weakness in iron ore, nickel, and copper. Of course, we have seen rebounds in those commodities in the last handful of weeks. Its Q1 adjusted EBITDA of $3.44 billion was a 7% decline from Q1 in 2023, and below the street’s consensus of $3.66 billion.
The firm reported a 51% sequential drop in EBITDA in care of a steep 32% decline in iron ore shipments and a 15% decrease in iron ore prices. On the plus side, Vale posted healthy free cash flow of $2.2 billion, above estimates, while its net debt rose modestly. Overall, I’m optimistic that the jump in resource commodity prices will be a boon in the current quarter, though there have been a high nine sellside EPS downgrades in the past 90 days compared with just a pair of earnings upgrades.
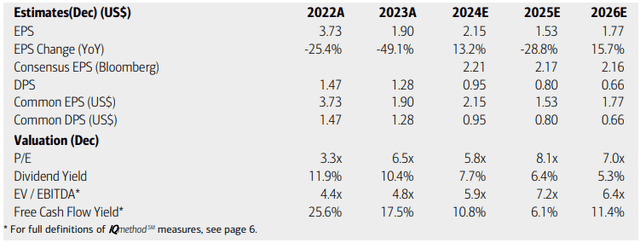
On valuation, analysts at BofA see earnings rising at a low- to mid-teens clip this year, with a normalization of earnings in the out year. By 2026, operating EPS is expected to be not far from where it is today (on an annualized basis). The current Seeking Alpha consensus forecast is more sanguine about the profit trajectory, while sales growth is seen hovering around the flat line through 2026.
Dividends, meanwhile, should vary with EPS growth, so prospective investors should not count on VALE as a yield play. But with a very low mid-single-digit earnings multiple, the company is cheap, particularly considering its high free cash flow per share.
Vale: Earnings, Valuation, Dividend Yield, Free Cash Flow Forecasts
BofA Global Research
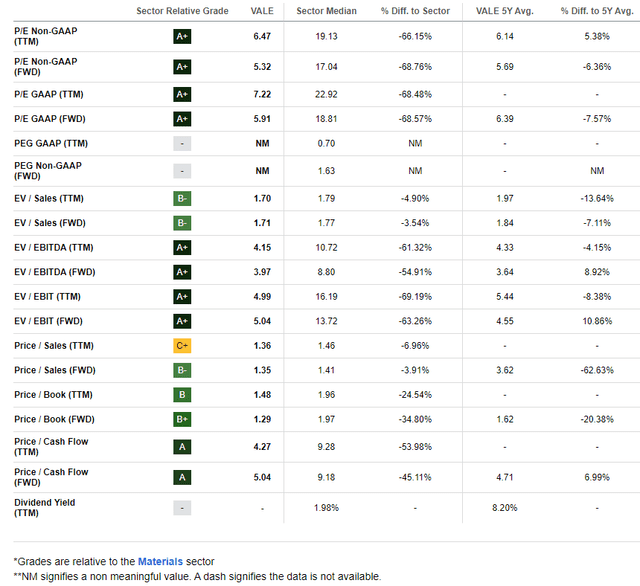
While Vale trades at an inexpensive price, the current forward non-GAAP P/E ratio is very close to its 5-year average. If we assume normalized non-GAAP EPS Of $2.20 and apply the stock’s 5-year average multiple of 5.7, then shares should trade near $12.50.
But on a price-to-book and price-to-sales basis, the stock is steeply discounted compared to its long-term average. Moreover, with an FCF yield currently above 10%, the stock appears to be a compelling value. Taken together, the fair value is likely in the mid-teens (dollars per ADR).
Vale: Compelling Valuation Metrics, Particularly Compared to Book Value and Sales
Seeking Alpha
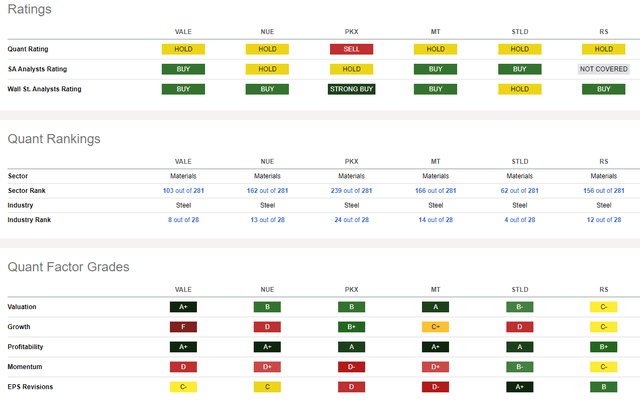
Compared to its peers, Vale trades at a low valuation while its growth trajectory has been soft. If we see a sustained rally in iron ore and copper prices, then I suspect we’ll see EPS upgrades as the year progresses – that will be key to watch in advance of its July earnings date.
Unlike many small EM companies, Vale is highly profitable, and its debt remains in check. Share-price momentum remains mired at a poor level, and the analyst community is yet to be impressed by any kind of long-lasting EPS inflection positive.
Competitor Analysis
Seeking Alpha
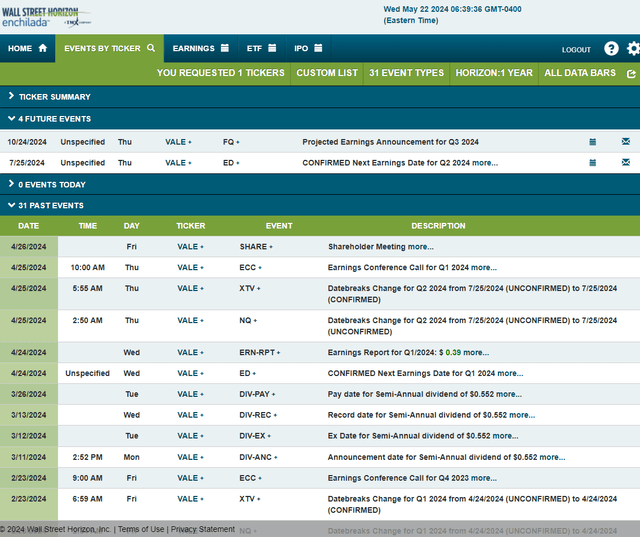
Looking ahead, corporate event data provided by Wall Street Horizon show a confirmed Q2 2024 earnings date of Thursday, July 25. No other volatility catalysts are seen on the calendar.
Corporate Event Risk Calendar
Wall Street Horizon
The Technical Take
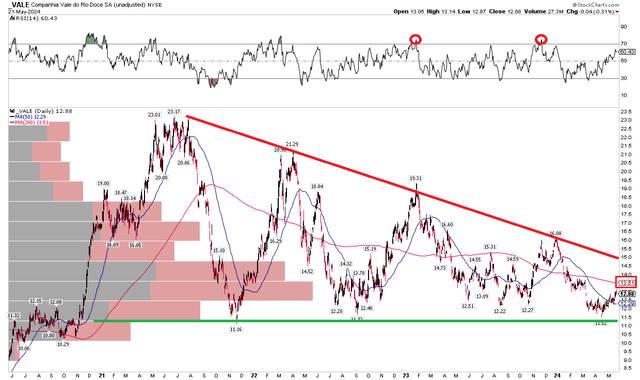
With a cheap valuation and the possibility of a better outlook for the balance of the year given stronger commodity prices, Vale’s technical chart suggests caution. Notice in the chart below that a long-term descending triangle is in play, with critical support in the $11 to $12 range. That area has held on a number of occasions since late 2021, and the stock held $10 back in 2020. Key resistance is currently seen around $15. A breakout through that mark would result in an upside measured move price target to about $26 based on the $11 height of the triangle. But if we lose $11 support, then a quick decline could be seen.
For now, keep your eyes on the RSI momentum oscillator at the top of the chart – Vale has historically tagged the 70 mark before dropping back. Big picture, the long-term 200-day moving average remains negatively sloped, suggesting that the bears are in control of the primary trend. Finally, with a high amount of volume by price in the $11.50 to $14 area, the current zone may persist as a congestion range.
Overall, the technicals are concerning, and I would like to see a definitive breakout through the descending resistance line before turning bullish from a momentum point of view.
Vale: Key Support Near $11, Resistance at $15
Stockcharts.com
The Bottom Line
I have a hold rating on Vale. I very much like its profitability characteristics and valuation, but the stock has historically traded with a low earnings multiple, while its technical situation is currently concerning.
Analyst’s Disclosure: I/we have no stock, option or similar derivative position in any of the companies mentioned, and no plans to initiate any such positions within the next 72 hours. I wrote this article myself, and it expresses my own opinions. I am not receiving compensation for it (other than from Seeking Alpha). I have no business relationship with any company whose stock is mentioned in this article.
Seeking Alpha’s Disclosure: Past performance is no guarantee of future results. No recommendation or advice is being given as to whether any investment is suitable for a particular investor. Any views or opinions expressed above may not reflect those of Seeking Alpha as a whole. Seeking Alpha is not a licensed securities dealer, broker or US investment adviser or investment bank. Our analysts are third party authors that include both professional investors and individual investors who may not be licensed or certified by any institute or regulatory body.
