Summary:
- American Airlines’ Q1 results showed a small beat in revenue, but earnings per share missed expectations, and revenue per available seat mile fell.
- The company continues to deleverage and reduce debt, but it remains the most indebted among major North American airlines.
- American Airlines faces fierce competition in the airline industry, but its extensive route network and loyalty program provide a competitive edge.
- American Airlines no longer looks undervalued compared to its North American peers, leading to me assigning a “hold” rating.
CHUYN
Introduction
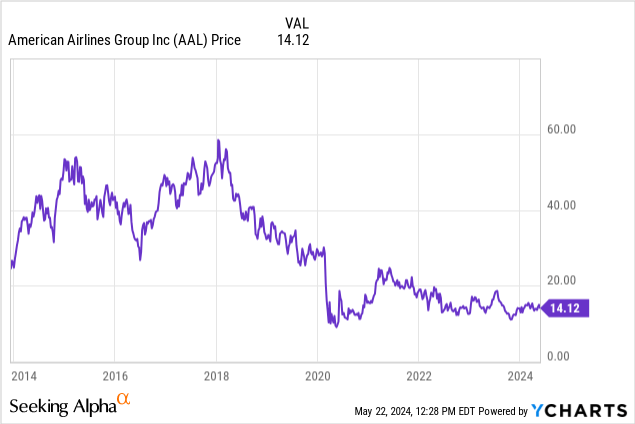
I previously covered American Airlines (NASDAQ:AAL) back in September last year where I explained my bullish view on the shares. Since then, the shares have risen 2.5% to $14.33, significantly lagging the wider S&P 500 (SPY), which has risen by over 19%. This underperformance comes as American Airlines’ revenue fell in Q3 and Q4 2023 against the previous year and only rose marginally in Q1 this year. Interest rates remain elevated against pre-pandemic levels, and, despite debt reduction, interest expenses remain high.
Today, I will address the most recent earnings release by American Airlines and other topics, I believe, are important for those considering investing in American Airlines. I will finish by discussing why I am downgrading my rating from a “buy” to a “hold.”
Q1 Results
On the 25th of April, American Airlines released its results for the first quarter of 2024. Revenue came in at $12.60 billion, a small beat of $20 million, up 3.3% year-on-year, breaking the previous two quarters trend of revenue falling against the corresponding quarter the previous year. This did, however, come with an increase in capacity, meaning revenue per available seat mile actually fell 4.9%.
Total operating expenses rose 6.9% year-on-year despite a drop in fuel expenditures, largely due to a $586 million increase in salaries, wages, and benefits. This fed through to earnings, with earnings per share on a non-GAAP basis coming in at -$0.34 per share, missing expectations by $0.05 per share. Although the first quarter of the year often results in a loss for North American-based airlines due to seasonal travel patterns, this loss was greater than the previous year’s loss of $0.02 per share.
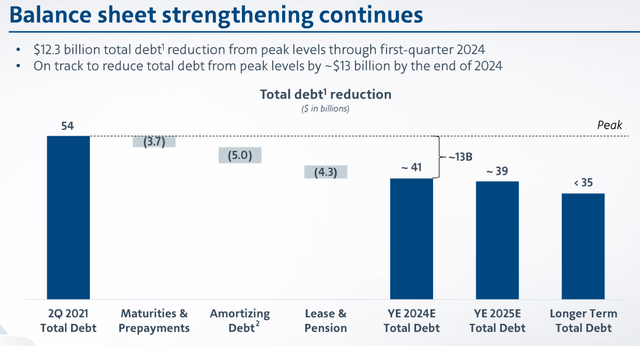
On the more positive side, total debt continued its decline, falling $950 million in Q1 to $41.7 billion. This now means American Airlines has successfully reduced total debt by $12.3 billion of its $15 billion target since total debt peaked at $54 billion in Q2 2021. Despite this fall, American Airlines remains the most indebted of all major North American Airlines, resulting in higher interest costs.
American Airlines Q1 2024 Earnings Presentation
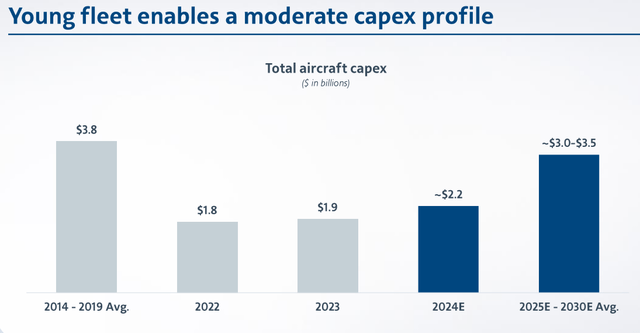
Looking ahead, American Airlines expects capital expenditure in 2024 to be $2.2 billion and between $3.0 – $3.5 billion per year in the 2025 – 2030 period. Whilst this is higher than in more recent years, this is below the pre-pandemic average of $3.8 billion, which should enable excess funds to be used for further deleveraging or enhancing shareholder returns.
American Airlines Q1 2024 Earnings Presentation
The company provided guidance for Q2, with adjusted earnings per share expected to come in at $1.15 to $1.45 ahead of consensus of $1.16 adjusted earnings per share. Total revenue per available seat mile is expected to fall between 1% to 3% against the previous year, with costs per available seat mile expected to rise 1% to 3%. This is based on a fuel price of $2.75 to $2.95 per gallon. The rise in costs is not unexpected given the significant increases in employee compensation that have been observed.
Overall, these results present a mixed picture. American Airlines continues to deleverage, helping put the airline on a stronger financial footing. However, the underlying Q1 looks weak with falls in earnings, falls in revenue per available seat mile, and higher operating costs over the previous year. Although American Airlines guided expectations for Q2 higher than consensus expectations, it remains to be seen whether the weakness from Q1 continues.
Facing Competition
At first glance, companies in the airline industry appear to have a large moat. High barriers to entry, such as meeting stringent regulations to high capital needs for fleet acquisition and maintenance, suggest limited competition. However, the airline industry is fiercely competitive. There are many major airlines, all vying for market share, each striving to offer better service and competitive pricing. American Airlines not only has to compete with full-service players like Delta Air Lines (DAL), but also low-cost carriers, and international carriers on international routes.
One advantage American Airlines does have is its sheer size. Its vast scale allows for a vast route network, offering nearly 6,800 flights daily to almost 350 destinations in over 50 countries. This extensive network provides significant connectivity advantages, particularly for business travellers who value frequent flights. Additionally, the airline’s loyalty program, AAdvantage, is clearly established, creating a strong customer retention tool incentivizing flyers to remain loyal to the company.
With many airports serving major cities in America becoming increasingly congested, American Airlines’ extensive route network and slot holdings at major hubs provide a competitive edge. This helps cement its status as a key player in key cities and helps prevent new entrants from challenging its position.
Valuation
American Airlines currently trades at x5.85 forward earnings, a significant discount compared to the wider market, and at an EV/EBITDA of 6.83. When I last covered American Airlines it traded at a discount to peers, however, now trades at a premium to peers.
Although American Airlines has largely escaped the issues facing other airlines, such as not operating the Boeing (BA) 737 MAX 9 and other operational issues, American Airlines now appears to underperform its peers on multiple metrics.
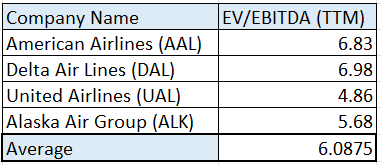
Table of Valuation comparisons with data from Seeking Alpha
When compared to its peers of Delta Air Lines, United Airlines (UAL) and Alaska Air Group (ALK), American Airlines now trades at a significant premium. It has an EV/EBITDA multiple of 6.83, amongst the highest in its peer group. When considering other key metrics such as Net Debt/EBITDA and EBITDA margin, we can see American Airlines has the worst metrics amongst its peer group.

Table of Key Metric comparisons with data from Seeking Alpha
Given its high debt level and lower margins, I believe American Airlines shares do not warrant to trade at a significant premium to its peers. Although the company forecasts positive growth in earnings per share in the future, and I believe the shares may increase in value in the future, other airlines, such as Delta, appear better placed. I therefore rate American Airlines shares a hold.
Risks
As with any company, American Airlines has several risks that could be detrimental to its future performance. I previously covered these in more detail in my previous article on American Airlines, the cyclical nature of the industry, fuel prices, and labour relations.
Fuel prices have remained relatively stable and the American economy ticking over nicely, leading to the last few quarters not presenting major issues for American Airlines. However, although there has not been strike action recently, labour relations have still driven significant increases in labour costs following a significant pay rise given to pilots and potentially future increases for flight attendants this year as well.
Conclusion
Although American Airlines continues its deleveraging, Q1 results came in relatively weak compared to the previous year. Increased operating expenses and lower revenue per available seat mile highlight ongoing challenges. Although it has made progress in deleveraging, it remains the most indebted amongst major North American airlines. Although earnings look set to increase in the coming years, American Airlines now trades at a premium valuation to peers, with higher debt levels and lower margins. Therefore, I assign American Airlines a “hold” rating.
Analyst’s Disclosure: I/we have no stock, option or similar derivative position in any of the companies mentioned, and no plans to initiate any such positions within the next 72 hours. I wrote this article myself, and it expresses my own opinions. I am not receiving compensation for it (other than from Seeking Alpha). I have no business relationship with any company whose stock is mentioned in this article.
Seeking Alpha’s Disclosure: Past performance is no guarantee of future results. No recommendation or advice is being given as to whether any investment is suitable for a particular investor. Any views or opinions expressed above may not reflect those of Seeking Alpha as a whole. Seeking Alpha is not a licensed securities dealer, broker or US investment adviser or investment bank. Our analysts are third party authors that include both professional investors and individual investors who may not be licensed or certified by any institute or regulatory body.
