Summary:
- “Sell in May and Go Away” does not hold true for the S&P 500 in the last 10 years.
- In the years immediately preceding the Credit Crunch, returns in the first half of the year exceeded the second half’s.
- Since the Fed started stress testing banks, second half returns have exceeded first half returns – JP Morgan has benefitted more than most.
- Over the past 10 years, 9 out of 10 Julys have been positive months for both SPX and JPM. JPM subsequently produced positive returns (on average) of 14.75% versus 6.6% for SPX.
- These facts, a fortress Balance Sheet, and recent weakness mean that now is a good time to buy JPM.
JayLazarin
Recently, I was trying to determine if the saying, “Sell in May and Go Away” had any basis in fact. Looking at the last 10 years of data for SPY, it appears that if it ever did, it doesn’t anymore. A deeper dive into the data, however, leads to the following conclusions;
- In the five years prior to the credit crunch of 2007 – 2009, both the S&P 500 (SPX) and money centre banks performed better in the second half of the year than in the first half.
- Since the advent of annual Stress Tests for large banks, the opposite has been true. June is characterized by large moves to the upside or downside, which over time, have averaged out to a marginal gain. July, by contrast, is almost always a positive month for both the S&P 500, and for banks in general.
- This year’s test is reputedly very onerous, so the potential for short-term volatility is high. Investors looking to take advantage of this should decrease their holdings of other banks, and increase the weighting of JPMorgan Chase & Co. (NYSE:JPM) in their portfolio.
I. I didn’t find what I was looking for, but I did find seasonality
As one would expect when analyzing a time frame when the market has risen, monthly returns over the past 10 years were usually positive. Further, there has been no real difference in the Win Rate between the first and second halves of the year. Over the last ten years, the market has risen for two out of every three months, irrespective of whether or not the month was in the first half of the year, or in the second half. However, the average monthly return in the second half has been substantially greater than in the first half. To put it in perspective, total returns have averaged 6.60% in the last six months of the year, whereas first half total returns have only averaged 4.02%.
Table 1: Monthly Data For SPY, 2013 – 2023
Source: Seeking Alpha (Seeking Alpha)
Three months in Table 1 catch the eye – May, July, and November. In all three months, the market has gone up in nine of the last ten years. May isn’t so interesting because the average gain is only 0.9%. July and November, however, had average monthly returns of 3.3% and 4.0% respectively. I don’t really know what’s going on in November, and I’m not sure if there is a common causal factor for this month; perhaps Black Friday might play a role. Identifying the trigger for July’s outperformance, however, might be a little easier.
Table 2: Semi-Annual Data For SPY, 2013 – 2023
Source: Seeking Alpha (Seeking Alpha)
II. Bank Stress Tests
After the 2008 – 2009 financial crisis, the Fed introduced annual stress tests for large banks, currently defined as those with more than $100 billion in assets. Smaller regional banks with more than $50 billion assets, but less than $100 billion, are tested every two years. The tests were formally implemented in 2011, and results were released at the end of June.
Initially, banks struggled to pass the tests, and as a result, they were forced to undertake reforms or take actions such as suspending dividends or issuing equity. As a result, there has often been a lot of noise and volatility in the shares of the banks being tested, both before and after the results are released.
The tests take the form of various scenarios which are designed to determine if a bank could maintain its minimum capital levels in a crisis. Banks which are deemed to be a systematically important financial institution (SIFI), or too big to fail, are required to maintain an additional buffer of capital because their failure could trigger a wider banking crisis. This Fed Document, 2024 Stress Test Scenarios, outlines what this year’s tests will be, and the following table indicates which banks will be tested. In total, 32 banks will be tested, though not every bank will have to take every test. For example, only banks that are active market makers will have to undergo the counterparty default test, which looks at how the capital of those banks will be affected if their largest counterparty goes bankrupt.
Banks Subject to 2024 Stress Tests: Results released June 2024
Source: The Federal Reserve – 2024 Stress Test Scenarios February 2024 (The Federal Reserve)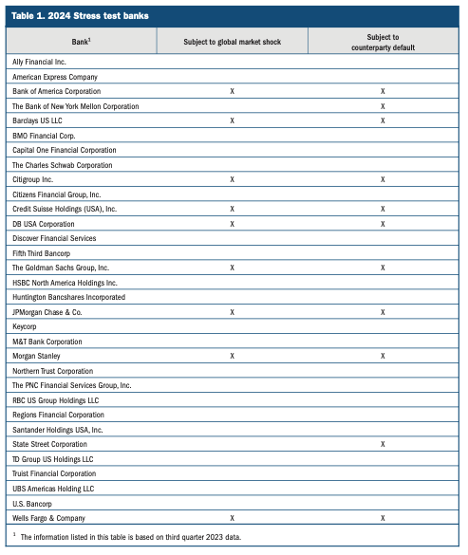
Table 3 compares the monthly data for SPY for the years 1998 – 2007 to the same data for the past 10 years. The period 1998 – 2007 was chosen because there were no stress tests during these years, and because the years 2007 – 2009 were in the middle of the Credit Crunch. As can be seen, before the Credit Crunch, markets did better in the first half of the year, but the opposite was true after the Credit Crunch. Although not shown, a similar analysis was also done for the banks in Table 4 for the five-year period 2003 – 2007, and the results were similar to the ten-year results for SPY.
Table 3: SPY Returns Pre-Credit Crunch vs. Post Credit Crunch
Source: Seeking Alpha (Seeking Alpha)
Table 4 gives more detail for individual banks and for the S&P 500 as a whole. In general, June has been an average month, albeit with a high degree of volatility in the case of some individual banks such as Citigroup Inc. (C). July however, has almost always been a winner. One explanation for this is that risk-averse investors look to lighten their positions before the results of the Fed’s Stress are released, and the market subsequently reacts positively in July when these positions are re-established.
JPMorgan, along with Goldman Sachs, has had the highest frequency of positive Julys – nine of the past ten Julys have been positive months. When looked at by the Total Return for July, JPMorgan has actually underperformed both the overall market (3.0% versus 3.3% for SPY), and The Goldman Sachs Group, Inc. (GS) which has returned 4.7% on average. But that isn’t the whole story. JPMorgan’s shares have continued to rally beyond July for the rest of the year.
The top performers for the last six months of the year, July – December, have been; 1) Bank of America Corporation (BAC) – 16.5%, 2) JPMorgan Chase & Co. (JPM) – 14.75%, 3) KeyCorp (KEY) – 13.62%, and 4) The Goldman Sachs Group, Inc. (GS) – 12.78%. For the sake of comparison, as noted previously and as shown in Table 3, SPY’s average second half performance has been 6.60%.
Table 4: Average Monthly Returns 2013 – 2023
Source: Seeking Alpha (Seeking Alpha)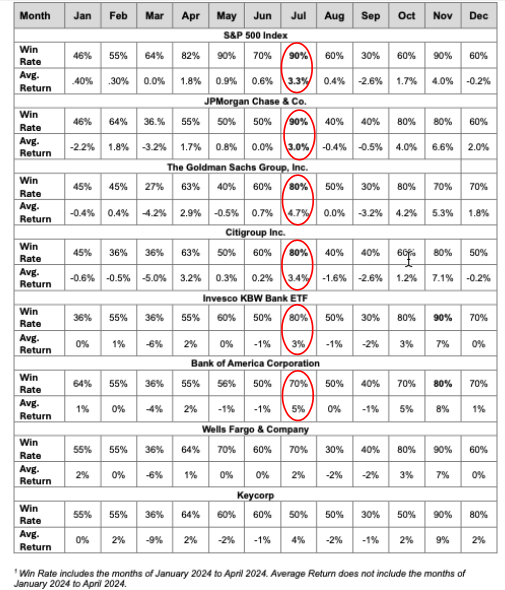
III. Why JPMorgan?
1) JPMorgan is de-risking
Jamie Dimon is on the record telling anybody who will listen, and their dog, that the stock market is; a) overestimating the chances of a soft landing, b) underestimating the chances of a recession, c) too optimistic with regard to inflation, and, d) overpriced. Has there ever been a clearer signal from the top that a bank wants to de-risk and batten down the hatches in order to become bulletproof?
And in fact, JPMorgan has a record amount of capital as well as its highest ever CET1 (Common Equity Tier 1 Capital) Ratio – 15.0%. Note the following quotations from Fitch Rating in italics that were made on April 10, 2024, and my comments after. JPMorgan’s actions are matching Jamie Dimon’s words.
- “JPM’s common equity Tier 1 ratio increased to 15.0% at YE23, from 13.2% one year ago, mostly due to strong internal capital generation that was partially offset by accumulated other comprehensive income losses. JPM’s asset quality has remained resilient through multiple credit cycles. Impaired loans remained low at 0.9% as of YE23. Although net charge-offs almost doubled from the previous year as credit trends normalized, to 0.5% as of YE23, this ratio remained below pre-pandemic levels.
- JPMorgan doesn’t need to tap the market for equity and dilute existing shareholders, it can generate capital internally.
- JPMorgan’s assets are high quality – “resilient through multiple credit cycles”.
- JPMorgan has taken a comprehensive and thorough approach to realizing losses.
- As per Table 5, JPMorgan has the lowest Dividend Yield and Payout Ratio of its peers. Clearly, it’s conserving capital for a rainy day.
- JPMorgan has de-leveraged its Balance Sheet by increasing its CET1 Ratio from 13.2 to 15.0, the highest amongst its peer group.
- “The firm’s operating profit-to-risk-weighted assets (RWA) ratio increased to 3.6% as of YE23, from 2.8% at YE22, a level 2.5x the peer average at YE23.”
- JPMorgan is 2.5x as profitable as the peer average.
- As per Table 5, at 33.57%, JPMorgan has the highest Net Income Margin of the banks which were examined.
If any bank is going to do well on the upcoming Stress Test, it will be JPMorgan.
Table 5: Select Financial Ratios for JPMorgan and Peers1
Source Seeking Alpha unless otherwise noted. (Seeking Alpha)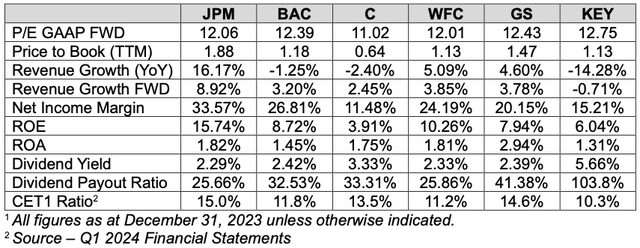
2) JPMorgan is Best of Breed
It’s important to acknowledge when looking at correlations, and price action that one hopes will repeat in the short term, such as the seasonality outlined in Section I, that things can work really, really well – until all of a sudden, they don’t. So it’s always a good idea to make this kind of portfolio re-weighting or short-term bet with a stock that you are happy to own for the long term.
- As per Table 5, JPMorgan has grown faster than its competitors, and it is forecast to do so again.
- As Fitch stated, “JPM’s diversified revenue base and market-leading position underpin its robust profitability, which is a key rating strength relative to peers.“
- Compare JPMorgan’s 15.74% ROE with those of its competitors. Most are single-digit, and even the next best bank, Wells Fargo, has an ROE that is far worse, 10.26%.
- As noted, above, JPMorgan has taken steps to de-risk and de-leverage its Balance Sheet. Its 15% CET1 Ratio is the highest of its peers, and only Goldman Sachs’ ratio is comparable.
3) As best of breed, JPMorgan should trade at a premium to its peers, the opposite is true.
Jamie Dimon would look pretty foolish if, having said numerous times that the stock market is overvalued, his company is the only one in the S&P 500 which is fairly valued. So, when asked the question last week, he said that JPMorgan’s shares were overvalued and that, “We’re not going to buy back a lot of stock at these prices.” He clearly believes markets are ahead of themselves, but I also think that he may have had other motives for pausing buybacks.
- Returning capital to shareholders works against the goal of de-leveraging and de-risking the Balance Sheet.
- JPMorgan and banks in general are becoming more activist, filing a number of lawsuits against the Federal Deposit Insurance Corporation and the Office of the Comptroller of the Currency. How is this relevant to share buybacks? A provision of the Inflation Reduction Act of 2022 was that there would be a 1% Excise Tax levied upon share buybacks of more than $1 million in a fiscal year. In his 2023 State of The Union Act, President Biden called for this tax to be quadrupled to 4%, and on April 9, the IRS and the Treasury announced that this tax would take effect as of December 31, 2023. Companies which have already purchased their shares back in 2024 on the assumption that the tax wouldn’t be levied, will, in fact, have to pay it. Given that Jamie Dimon was testifying in front of a Senate Committee when he made his comments regarding buybacks, I wouldn’t be surprised if he was taking the opportunity to register his displeasure and convey the message that actions have consequences, in other words, don’t raise this tax.
Graph 1: Year-to-Date Total Returns
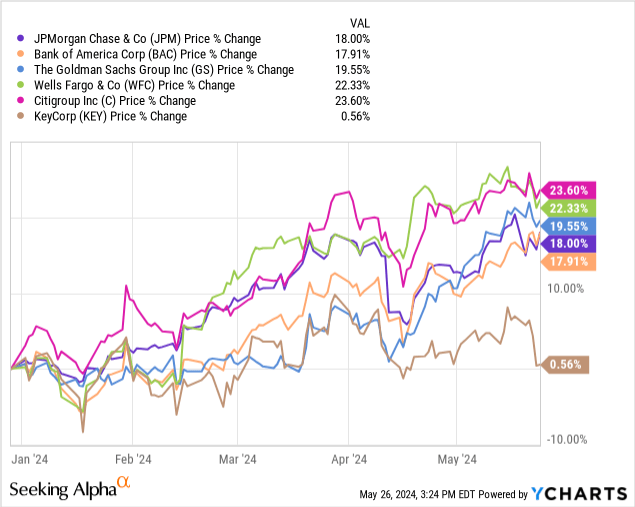
In any case, irrespective of what Jamie Dimon’s motives were, JPMorgan’s shares fell by 4.5% after his testimony, while those of other banks were less affected, and the Year to Date return of JPM now trails that of most of its peers. It now looks cheap.
- JPM’s P/E Ratio is on par with Wells Fargo’s, a bank with lower growth, lower profitability, a lower capital ratio, and a lower ROE.
- JPM’s P/E Ratio is actually lower than those of Bank of America, Goldman Sachs, and KeyCorp, Financial Institutions that have performed much worse than it has, and which are forecast to continue to perform worse than it will.
- “Ah – But what about JPMorgan’s Price to Book Ratio, especially when compared to Citigroup?”, I hear you ask. I actually believe that this ratio is misleading when analyzing banks. Consider the following scenarios;
- Bank A lends $100 million to XYZ Corp, a Double A rated corporation. It places the loan in the Banking Book. Bank B buys $100 million of Bonds issued by XYZ Corp that were issued at the same time as the loans were advanced. Bank B places the bonds on the Trading Book as an asset that is available for sale. Six months later, XYZ Corp is downgraded to Single A, and its debt trades at a wider credit spread. Bank A doesn’t change its valuation as the loans are on the Banking Book. Bank B marks the bonds to market and takes a loss of 4%, or $4 million. Do Price to Book Value Ratios serve any purpose in this situation?
- Bank A has been in existence for 130 years, and it has thousands of retail branches, purchased 100 years ago, 50 years ago, 20 years ago. They are all carried on the Balance Sheet at their original cost. Bank B is a virtual bank with its headquarters in a converted warehouse it purchased 10 years ago. Do Price to Book Value Ratios serve any purpose in this situation?
The important questions about assets aren’t what their historic purchase price was, 100 years ago or 10 years ago, but rather, what kind of income do they produce, what kind of ROE do they allow for, and what kind of a platform do they provide for a business to grow? For all of these questions, the answer is, hands down, that JPMorgan’s assets allow management to produce more Net Income, a higher ROE, and a higher rate of growth than its competitors.
It should be trading at a premium.
IV. Conclusion
Over the past 10 years, bank stocks and the stock market in general, have been volatile in front of the annual Fed Stress Tests of the banking industry. July has usually been a good month, and the second half of the year has been better than the first half. JPMorgan has benefitted from this more than most.
JPMorgan has de-risked its Balance Sheet and in my opinion, it is less likely to be negatively impacted by the upcoming Stress Tests than its peers and more likely to rebound from any temporary weakness.
In the event that the past doesn’t repeat itself, and the statement,
- “JPMorgan‘s shares have risen in the month of July for nine out of the past ten years” has to be revised to,
- “JPMorgan‘s shares have risen in the month of July for nine out of the past eleven years“,
Then – recent weakness in the price of JPMorgan’s shares relative to those of other banks’ offers an opportunity for long-term investors to establish a position in JPM, and/or, this weakness allows investors looking to adopt a more defensive posture to rotate into JPMorgan.
I rate JPMorgan Chase & Co. (JPM) as a Buy.
Analyst’s Disclosure: I/we have no stock, option or similar derivative position in any of the companies mentioned, and no plans to initiate any such positions within the next 72 hours. I wrote this article myself, and it expresses my own opinions. I am not receiving compensation for it (other than from Seeking Alpha). I have no business relationship with any company whose stock is mentioned in this article.
Seeking Alpha’s Disclosure: Past performance is no guarantee of future results. No recommendation or advice is being given as to whether any investment is suitable for a particular investor. Any views or opinions expressed above may not reflect those of Seeking Alpha as a whole. Seeking Alpha is not a licensed securities dealer, broker or US investment adviser or investment bank. Our analysts are third party authors that include both professional investors and individual investors who may not be licensed or certified by any institute or regulatory body.
