Summary:
- Amid an uncertain political backdrop and mixed vehicle industry trends, shares of automakers have generally rallied lately.
- Used vehicle prices are down substantially while miles driven stats are up.
- I have a buy rating on General Motors (GM) for its very low valuation, solid balance sheet, and share-price momentum.
- Ahead of its annual shareholder meeting and earnings due out in July, I highlight key price levels to monitor.
BSPollard
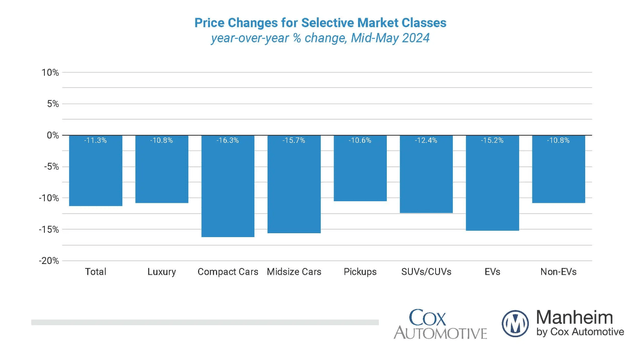
It’s already a tense election atmosphere. Both presidential candidates vow to pressure China, primarily via tariffs, potentially benefitting some domestic automakers. Furthermore, consumers are increasingly shying away from electric vehicles. According to the latest Manheim Used Vehicle Value Index, the price for a typical EV is down by more than 15%.
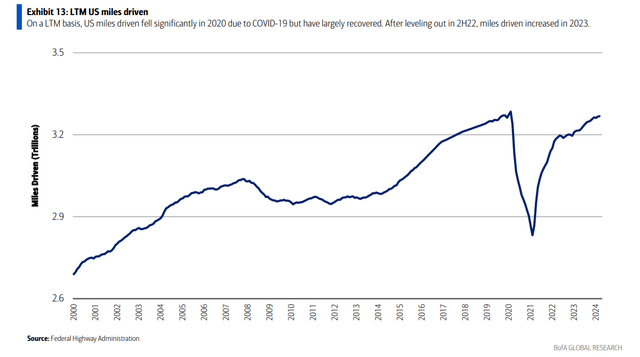
Of course, most auto categories have endured steep losses as the vehicle market normalizes. Still, miles driven numbers are impressive, and a large number of US travelers hit the road for the long holiday weekend. So there are some tailwinds for US automakers, but risks remain apparent.
I have a buy rating on shares of General Motors (NYSE:GM). I see the stock having a compelling value while its technical chart has signs of life. What’s more, GM’s management team has been buying back shares.
Used Vehicle Values Down Sharply YoY
US Last-12-Month Miles Driven Numbers Continue to Recover
According to Bank of America Global Research, GM is one of the world’s largest automakers, with annual volume of almost 9 million units. The company reports its operations in four segments: North America, International, GM Financial, and GM Cruise. It has made significant strides in restructuring its business since the last trough in 2009, positioning it well to deal with cycle swings and the evolving industry landscape.
In April, GM reported a solid set of first-quarter results. Q1 non-GAAP EPS of $2.62 handily beat the Wall Street consensus estimate of $2.11 while revenue of $43 billion, up 7.5% from year-ago levels, topped expectations by an impressive $1.22 billion. The big earnings print was driven by both strong operating results and share repurchases.
Adjusted EBIT increased 2% to $3.9 billion with a healthy 9% EBIT margin. Earnings from its North American region climbed 7% with vehicle sales up modestly, though its market share dipped. GM International suffered an EBIT decline, but that was reportedly due to corporate actions.
What was impressive, though, was that GM’s management team increased its full-year 2024 guidance and adjusted EBIT range. Adjusted EPS is now seen between $9 and $10. Expectations for free cash flow were also lifted as the firm’s balance sheet remains a stalwart – highly liquid with a small fall in debt in Q1.
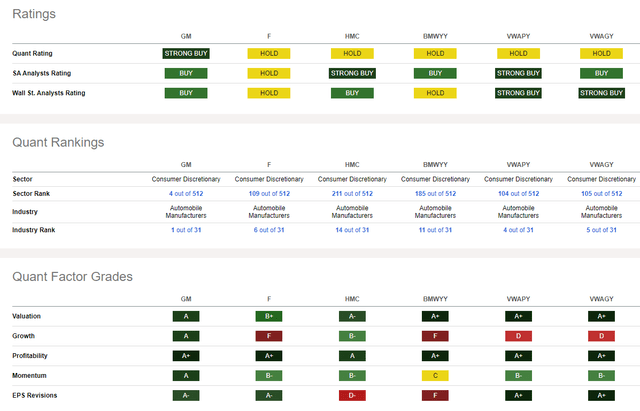
Shares rose by more than 4% after the “show me” quarter proved the bears wrong. Analysts now expect $2.63 of operating EPS to be reported in July, up from just $1.91 from July last year. GM is now ranked No. 1 out of 31 in its Seeking Alpha industry, per the Quant Ranking system.
Risks to the investment thesis primarily include a weaker-than-forecast macro economy, leading to reduced consumer spending and lower auto sales. Furthermore, the recent rise in some commodity prices could temper GM’s margins if not well managed, and while supply chains have loosened, geopolitical factors could lead to troubles in sourcing markets. Stressed capital markets could also hurt GM’s debt position.
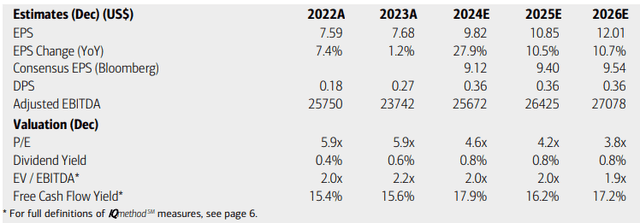
On valuation, analysts at BofA see earnings jumping by more than 25% this year with continued high EPS growth in the out years, potentially topping $12 by 2026. The current Seeking Alpha consensus earnings numbers are not as sanguine, however, with non-GAAP EPS ranging in the $9.40 to $9.52 range.
I expect more earnings upgrades following the impressive Q1 report. There have been a high 21 upward EPS revisions in the last 90 days compared with just a single downgrade from sellside analysts.
Dividends meanwhile are expected to hold steady at $0.36 annually, so income investors likely won’t be enamored by GM today, though its total shareholder yield is more impressive given the buybacks. With a mid-single-digit P/E multiple and an EV/EBITDA ratio of just 2.0x, the stock is a compelling value. And its free cash flow yield is very high, not far from 20%.
GM: Earnings, Valuation, Dividend Yield, Free Cash Flow Forecasts
If we assume normalized EPS of $9.50 and apply the stock’s five-year average earnings multiple of 7.9x, then shares should trade near $75. GM is not as cheap on an EV/sales basis, but even that metric asserts shares are attractively priced. Progress in EVs and AVs could promote a higher P/E in the years ahead.
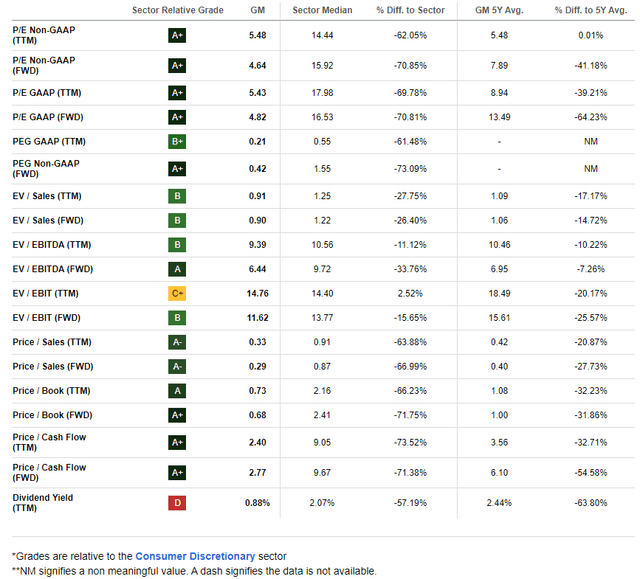
GM: Very Low Valuation Metrics, High Free Cash Flow
Compared to its peers, GM sports a solid valuation rating while its growth trajectory is just about the best you will find in the auto industry. Profitability metrics are sublime, highlighted by the stock trading just 6x free cash flow. EPS revisions are positive, as mentioned earlier, and GM’s share-price momentum is finally catching up with the bullish valuation thesis.
Competitor Analysis
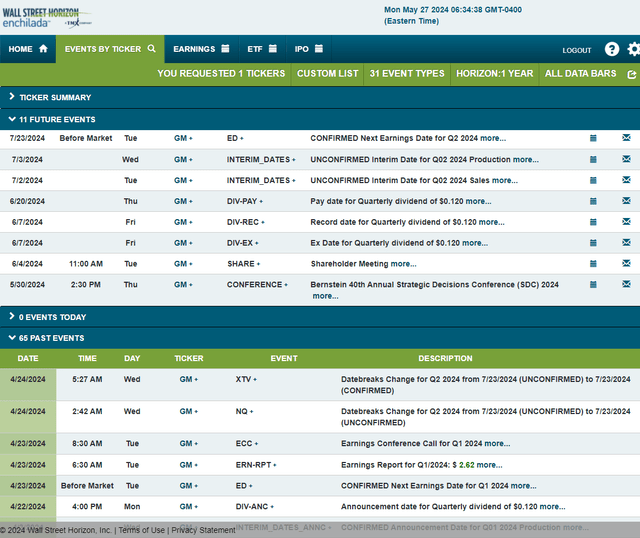
Looking ahead, corporate event data provided by Wall Street Horizon show a confirmed Q2 2024 earnings date of Tuesday, July 23 BMO. Before that, the firm’s management team is expected to present at the Bernstein 40th Annual Strategic Decisions Conference (SDC) 2024 Conference in New York from May 29 to 31. GM also holds its annual shareholder meeting on June 4 before the stock’s ex-dividend date of June 7.
Corporate Event Risk Calendar
The Technical Take
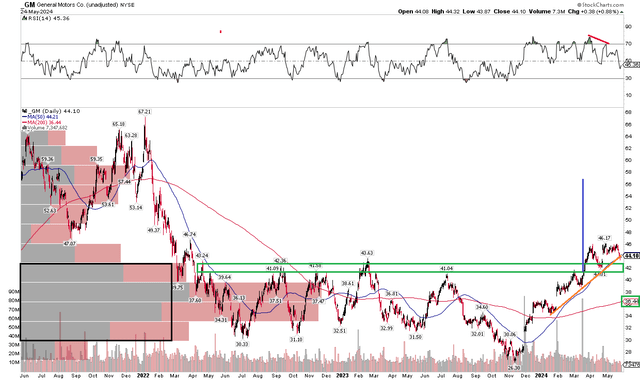
After a string of earnings beats, shareholder-friendly activities ongoing, and an inexpensive valuation, GM’s technical view looks good. Notice in the chart below that after ranging sideways for the better part of two years, between $30 to $44 (with a false breakdown low of $26 last November), GM is now near 2-year highs. The stock’s long-term 200-day moving average is positively sloped, suggesting that the bulls are in control of the primary trend. Shares are now testing the rising 50dma and an uptrend support line that goes back months.
Also take a look at the RSI momentum oscillator at the top of the graph – there is some bearish divergence, so we could see more near-term weakness. I am also concerned about an earnings-related price gap down at the $36 level. But following the upside breakout in Q1, a bullish measured move price objective to near $58 is in play based on the height of the previous pattern and breakout.
Overall, I see support at $42 and $36 while $53 is near-term resistance while the technical pattern price target is in the upper $50s.
GM: Shares Trending Higher, But Weaker RSI, Rising 200dma
The Bottom Line
I have a buy rating on GM. I see the stock as a strong value given where earnings could be headed and as the management team buys back shares. Free cash flow is robust while the technical picture is generally favorable.
Analyst’s Disclosure: I/we have no stock, option or similar derivative position in any of the companies mentioned, and no plans to initiate any such positions within the next 72 hours. I wrote this article myself, and it expresses my own opinions. I am not receiving compensation for it (other than from Seeking Alpha). I have no business relationship with any company whose stock is mentioned in this article.
Seeking Alpha’s Disclosure: Past performance is no guarantee of future results. No recommendation or advice is being given as to whether any investment is suitable for a particular investor. Any views or opinions expressed above may not reflect those of Seeking Alpha as a whole. Seeking Alpha is not a licensed securities dealer, broker or US investment adviser or investment bank. Our analysts are third party authors that include both professional investors and individual investors who may not be licensed or certified by any institute or regulatory body.

