Summary:
- Meta Platforms, Inc.’s streaking price advance from $88 in October 2022 to $531 in April 2024 is completely overcooked, and appears to already discount years of future business growth.
- Technical analysis suggests a retest of the February price-gap move is next, leading to a potential -15% to -20% downdraft in shares.
- A reset and rebalance in share supply/demand could create a better entry point for new purchases with a stronger valuation proposition under $400.
Monty Rakusen
I will admit, my 2023 Sell ratings on Meta Platforms, Inc. (NASDAQ:META) have been some of the worst performance ideas I have suggested on Seeking Alpha. I have completely underestimated the rebound in online ad sales at the company, alongside still decent growth in social media eyeballs and users overall. Of course, the metaverse spending remains outrageous and has little chance of being recovered by shareholders.
Today, I want to look purely at the Meta chart pattern. I hope you can give my technical analysis some consideration, before buying shares. To me, several indicators stand out as predicting a retest of its February price-gap move from $400. If my research proves out, we may be on the verge of experiencing a -15% to -20% downdraft for the quote in coming months (from $474 currently), perhaps all the way down to its 200-day moving average around $380.
At that point, a reset and rebalance in share supply/demand (bullish/bearish investor sentiment) could create a better entry level for new purchases. It would even provide a much stronger valuation proposition, with a P/E closer to 20x estimated 2024–25 results.
Seeking Alpha Table – Meta Platforms, Analyst Estimates for 2024-26, Made May 28th, 2024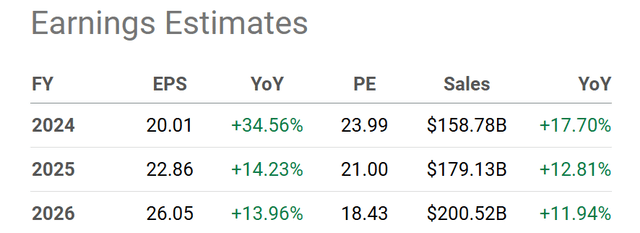
Let me explain the trading picture and my forecast for an immediate correction in Meta’s share quote.
April Selloff Was The Real Deal
I know bullish Meta investors don’t want to hear it. But, the selling in April on somewhat weaker guidance for the year was backed by an unusual pullback in buying volumes, overwhelmed by aggressive selling. This is actually the kind of action witnessed after numerous stock tops in the volatile technology sector over many decades. I talked about a similar dump in Advanced Micro Devices (AMD) during early April here. Ever since that article was published, AMD has struggled and sold off in price, despite plenty of positive fundamental news flow about rising demand for its AI-chip inventions.
Specifically for Meta, peaks in its relative strength vs. the S&P 500 (SPY) during early April (circled in green below) and the important On Balance Volume indicator back in February on the positive Q4 2023 earnings release price gap (circled in blue) are worthwhile sell signals by themselves to contemplate.
The reverse of the good news buying frenzy in early February was the missed guidance (on higher capital spending for 2024 AI and metaverse development), mass investor liquidation event a few weeks ago in late April. Ever since, Price has not been able to trade above its 50-day moving average (blue line).
The price slide in April actually outlined the greatest bearish reading (red arrow) in the 14-day Ease of Movement indicator over Meta’s history. The EMV calculation essentially considers how much volume is necessary to move price. The conclusion in April is a total vacuum of buyers existed, and/or sellers dramatically outnumbered buying liquidity over 14 trading days (roughly 3 weeks). This occurrence was rare and very unhealthy from a technical perspective if you are bullish on Meta over the short term.
Investopedia – Screenshot, Ease of Movement Indicator Description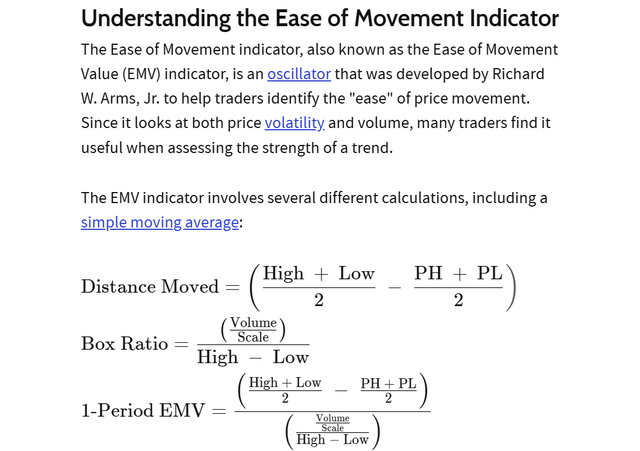
In addition, something of a head-and-shoulders chart pattern has been outlined (assuming the 50-day moving average is not broken strongly to the upside during early June). I have drawn two S’s and the H in red below, to highlight this formation.
StockCharts.com – Meta Platforms, 12 Months of Daily Price & Volume Changes, Author Reference Points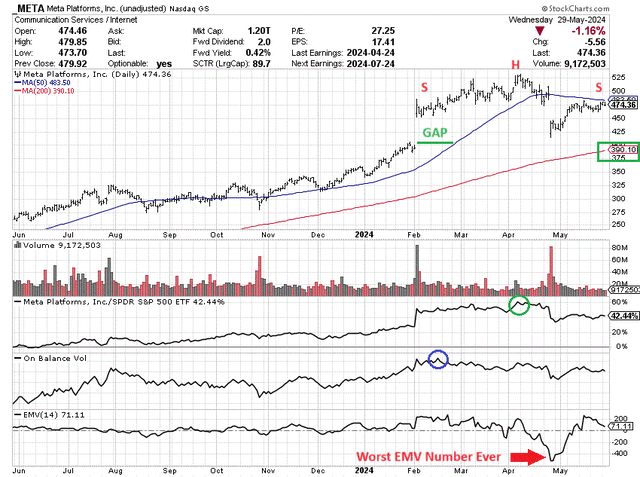
My trading conclusion is a price decline to an area around the 200-day moving average (red line), filling the gap in early February makes sense for an immediate forecast (green box). Such would generate a -15% to -20% slide from $474 at the close on May 29th, 2024.
In an example of déjà vu, it appears we are repeating roughly the same late 2021 topping pattern in Meta. Below, I have drawn a 25-month chart of the stock between December 2020 and January 2023. Notice the September 2021 reversal under its 50-day moving average, with intense selling pressure represented by ultra-week 14-day Ease of Movement calculations.
StockCharts.com – Meta Platforms, Daily Price & Volume Trading, Dec 2020 to Jan 2023, Author References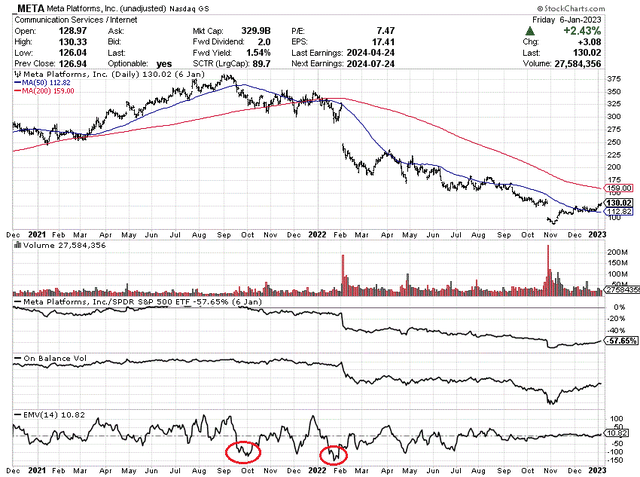
Final Thoughts
Combine the problematic individual Meta chart with a Big Tech AI-energized advance over the last year and a half getting more exhausted by the day, and it’s not difficult to envision a pullback in price may be next.
If you are looking to buy Meta shares, I would wait for lower quotes. I know Meta investors have achieved outstanding gains during 2023-24, but Seeking Alpha’s computer ranking formulas still put an “F” Quant Valuation Grade on the stock. What this means is tremendous downside, beyond my -20% forecast, is entirely possible under recession and/or stock market crash scenarios.
Seeking Alpha Table – Meta Platforms, Quant Valuation Grade, May 28th, 2024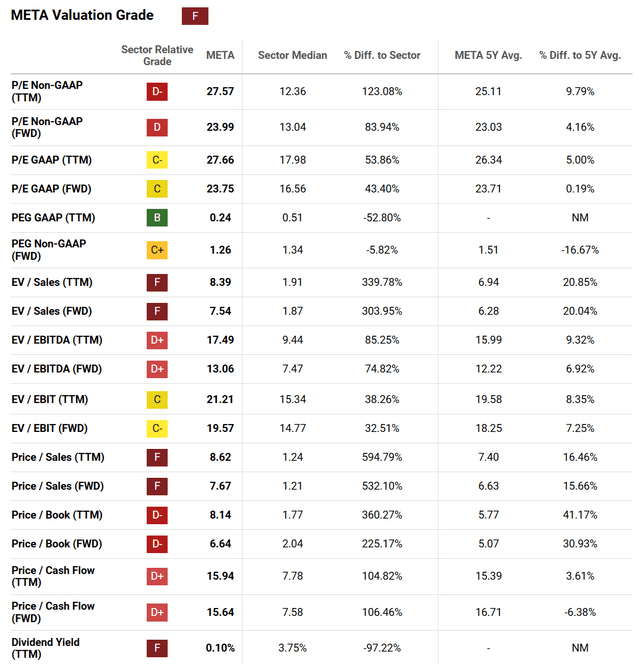
Due to my technical trading research and sky-high valuations, I will continue with my Sell rating for Meta Platforms, at least until the $400 price gap from February 1st, 2024 is filled.
Thanks for reading. Please consider this article a first step in your due diligence process. Consulting with a registered and experienced investment advisor is recommended before making any trade.
Analyst’s Disclosure: I/we have no stock, option or similar derivative position in any of the companies mentioned, and no plans to initiate any such positions within the next 72 hours. I wrote this article myself, and it expresses my own opinions. I am not receiving compensation for it (other than from Seeking Alpha). I have no business relationship with any company whose stock is mentioned in this article.
This writing is for educational and informational purposes only. All opinions expressed herein are not investment recommendations and are not meant to be relied upon in investment decisions. The author is not acting in an investment advisor capacity and is not a registered investment advisor. The author recommends investors consult a qualified investment advisor before making any trade. Any projections, market outlooks, or estimates herein are forward-looking statements based upon certain assumptions that should not be construed as indicative of actual events that will occur. This article is not an investment research report, but an opinion written at a point in time. The author's opinions expressed herein address only a small cross-section of data related to an investment in securities mentioned. Any analysis presented is based on incomplete information and is limited in scope and accuracy. The information and data in this article are obtained from sources believed to be reliable, but their accuracy and completeness are not guaranteed. The author expressly disclaims all liability for errors and omissions in the service and for the use or interpretation by others of information contained herein. Any and all opinions, estimates, and conclusions are based on the author's best judgment at the time of publication and are subject to change without notice. The author undertakes no obligation to correct, update or revise the information in this document or to otherwise provide any additional materials. Past performance is no guarantee of future returns.
Seeking Alpha’s Disclosure: Past performance is no guarantee of future results. No recommendation or advice is being given as to whether any investment is suitable for a particular investor. Any views or opinions expressed above may not reflect those of Seeking Alpha as a whole. Seeking Alpha is not a licensed securities dealer, broker or US investment adviser or investment bank. Our analysts are third party authors that include both professional investors and individual investors who may not be licensed or certified by any institute or regulatory body.
