Summary:
- JP Morgan Chase has historically performed well compared to peers and remains a healthy operator with high ROE and a solid balance sheet.
- The majority of JPM’s revenue comes from net interest income (NII), which is at risk due to potential lower interest rates.
- The bank’s business segments show diverging trends, with some experiencing weakness in NII and lower deposits. There is no significant structural driver to offset potential NII pressure.
winhorse
Relatively to peers, JP Morgan Chase (NYSE:JPM) shares have performed well over time, with total book value per share expanding each year since 2004 at a compound annual growth rate of ~10%, corresponding to 510bps above peers. The stock has also outperformed the S&P 500 in the last 10 years, but mostly due to a higher beta.
A 100% rally from the bottom tends to make people excessively bullish. JPM remains a solid business with a base of strong and diversified operations, NII is now ~56% of revenue and exposed to the potential impact of lower interest rates. This article explores the issue and why I believe the stock is unlikely to outperform in the next few years.
Revenue and NII pressure
The majority of JPM’s revenue is generated by NII, which has doubled since 2021 and represented ~56% of total revenue in 2023, up from 35% in 2021.
The main threat to NII, the current main driver of revenue, is the trend in interest rates and the possibility of seeing rate cuts in the next couple of years. At the last investor day, besides mentioning a number of uncertainties, management themselves admitted that 2023 tailwinds are likely turning into headwinds, with NII potentially under pressure.
JPM’s outlook for NII was recently increased to $91bn for the year, $3bn higher than the $88bn guidance given in the fourth quarter of 2023. This is relatively flat YoY, a function of a modest decline in average deposit balances year-on-year, lower deposit margin due to some product migration in a slightly higher rate environment, offset by higher card OS growing double-digits. Management also mentioned they expect NII to be volatile in the next few quarters and, despite the upward revision, there is an expectation of sequential declines relative to the Q4’23 annualized NII (~$96bn), without visibility on a potential through. The main difference is that guidance implies only 2 rate cuts in 2024 compared to previous expectations of 6 cuts.
Besides the immediate impact of rate cuts, and how many cuts we will see this year, I think the weight of NII on JPM’s revenue indicates the need to look at interest rate trends and where these are likely to trend in the next few years. In a recent analysis, I outlined my bear case for interest rates, which I am playing via long positions on TLT and TMF.
My long-term fundamental view is based on the structural challenges that the US economy (as well as many other major economies face), where a strong economy with high employment rates coincides with rapidly rising interest costs and high and compounding public debt. The significant increase in bond yields poses a challenge to the US government’s ability to secure financing. With a national deficit hovering around 7%, substantial bond issuance is necessary, creating a vicious cycle.
While the 2008-2020 period saw low interest rates facilitate the management of high public debt levels, current bond yields are significantly higher than inflation levels, favoring the compounding of debt burden. I believe interest rates will have to come down to allow the long-term sustainability of US debt with a more flexible approach to inflation targets.
In my previous analysis, I offered further short-term indications that interest rates might be headed down, including:
-
Real-time inflation declining to below 2.2%.
-
Crude oil prices under pressure.
-
Double relief from QT reduction and US Treasury Buyback program.
-
Negative macro surprises on US PMI and JOLT job openings.
In my previous analysis, I included a lot of detail on these items and readers can refer to that to expand on the topic. The main point on this is that interest rate declines can put NII under significant pressure. NII is the main driver of revenue (55%), but the bottom-line impact is likely much larger than the proportional impact on revenue. As there are no significantly different costs in collecting a higher NII versus a lower NII as a result of changes in interest rates, marginal revenue from NII variations due to interest rate changes is basically 100% EBIT margin, and its decline has the potential to impact EBIT disproportionately. Even if my view on interest rates ends up being too bearish, the path implied in the current yield curve has interest rates declining for the next five years, which should put significant pressure on NII:
ustreasuryyieldcurve.com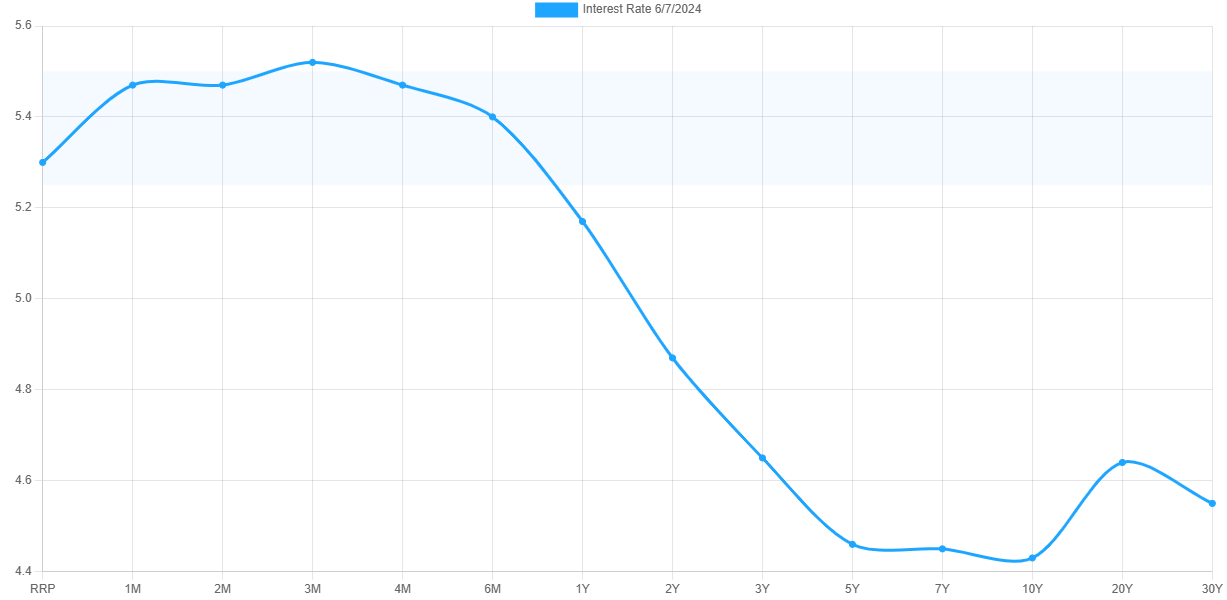
NII as a percentage of revenue peaked in Q4’23 at ~61%, before declining to ~55% in Q1’24. Non-interest income hasn’t been strong either, raising the question of whether weakness in NII can be offset. YoY growth in NIR was positive in Q4’23 only thanks to the ~4% impact from First Republic, and slightly down excluding it. In Q1’24, YoY growth excluding FR was less than 3%.
Company Filings, Author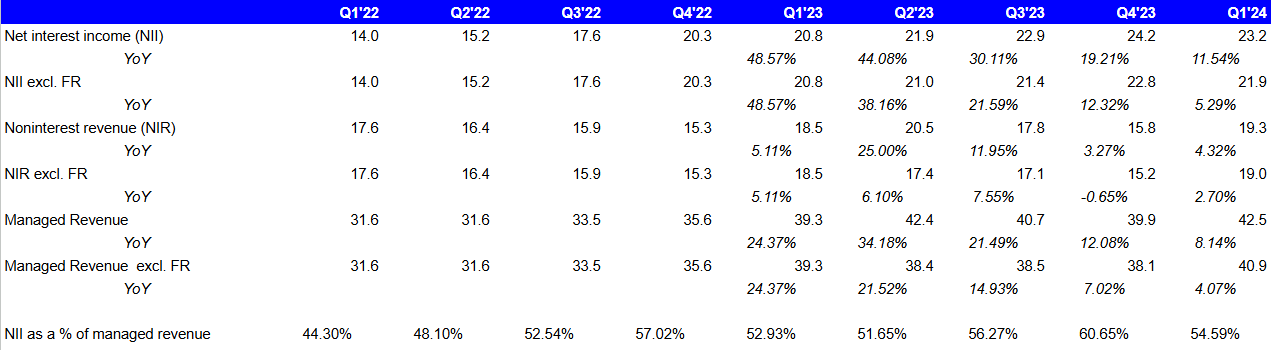
If NII weakness continues, in line with my bearish view on interest rates or even in line with the path implied by the current yield curve, significant strength in NIR income is needed to offset the weakness enough to allow JPM’s top line to expand. While this is possible and lower interest rates might give a boost to noninterest revenue activities, previous instances of falling rates — even occurring in the context of healthy economic expansion such as 2018-2019 — have translated into a stock performance barely in line with the S&P500. However, when interest rates are very low and or recessions occur, JPM tends to underperform, such as in the 2020 recession.
TradingView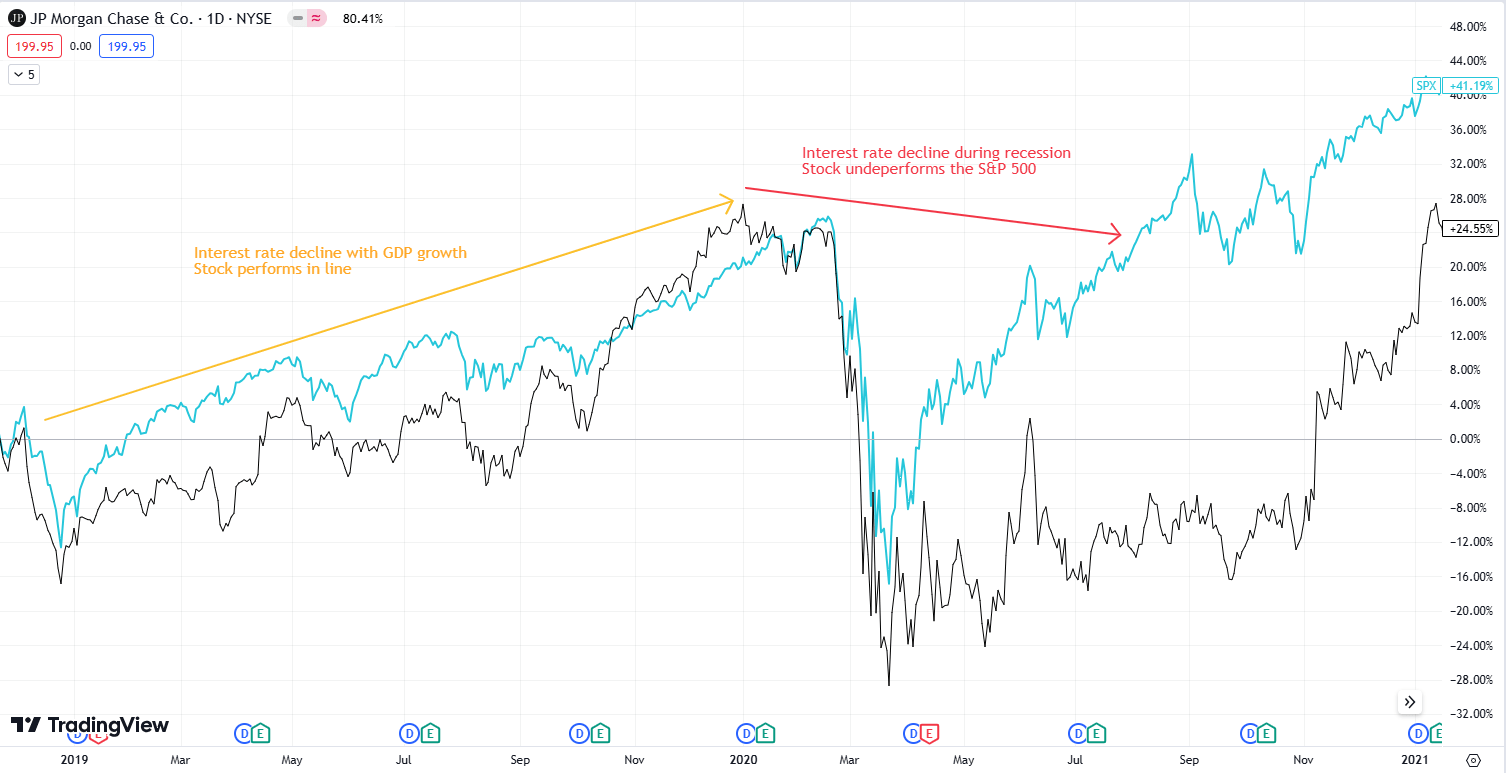
No Big Structural Driver to Offset NII Pressure
JP Morgan’s business is divided across segments and subsegments showing diverging trends. Consumer and Community Banking (“CCB”) net interest income revenue expanded by $200m YoY in 2023 from $14.9bn to $15.1, but mainly due to the acquisition of First Republic Bank. Excluding First Republic. CCB NIR was down to $14.2bn.
Banking and wealth management had been booming since the end of 2021 on the back of the interest rate hikes, but the trend has weakened in recent times and was down 4% in Q1’24 suffering from the lower NII and lower deposits. Home lending has been volatile but without significant growth since the end of 2021, although it grew ~10% YoY in Q1’24 with higher NII and a 10% growth in originations.
Card Services and Auto have also been trending up since 20221 although with significant QoQ volatility, and continued to grow by 8% YoY in Q1’24 with diverging trends between card outstanding (up 13%) and auto originations (down 3%).
Company Filings, Author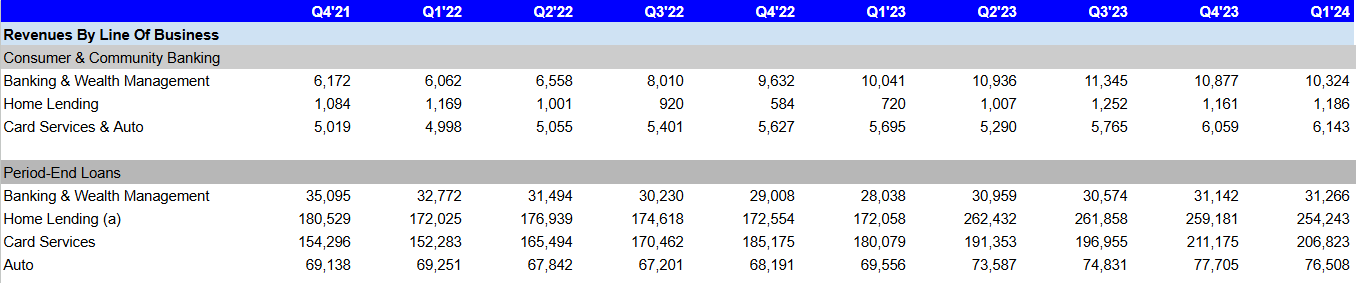
CB and CIB will be merged into one segment next quarter, which will probably limit the level of detail available to analyze these segments. Besides historical analogies, to see potential NII weakness offset by other segments, the CIB is probably where we want to look given that NII is only~21% of the division’s revenue (compared to ~78% in CCB and ~76% in CB).
There are two main drivers here – Investment banking fees and principal transactions. While investment banking fees were up ~20% YoY, this is a volatile segment due to M&A, and its growth is likely held down by structural headwinds in advisory (30%+ of investment banking fees) due to the regulatory environment. Advisory fees declined by 21% YoY in Q1’24.
Company Filings, Author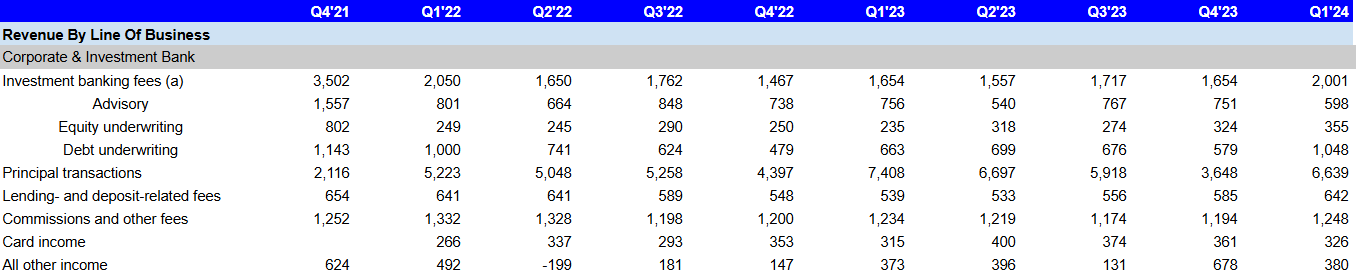
Lower rates that come with a strong stock market should help maintain healthy equity and debt underwriting, while principal transactions are volatile and generally benefit from higher trading volumes. However, there is no real structural driver if markets don’t accelerate on rate declines.
Efficiency, Track Record and Buybacks
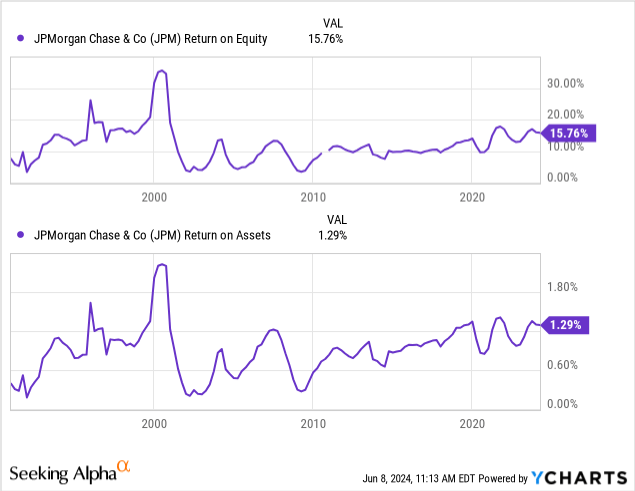
JP Morgan’s business already appears to be more efficient than peers on several metrics, such as the low overhead ratio of 54% (although growing in recent times) and revenue expanding much faster than expenses in the past five years. The firm also has a ROTCE of 21% as of 2023 with a 17% through the cycle target.
While technology modernization is also working to potentially deliver some more efficiencies, JPM’s current profitability is already very high. Excluding the dot-com bubble period, ROE and ROA are around all-time highs.
The firm’s excess capital allows them to engage in large buybacks, which they decided to increase to the pace of $2bn per quarter. While this offers a total 3.7% yield when combined with the ~2.3% dividend yield, sharp increases in buybacks following rallies are not generally something I like to see and it’s unlikely to make a difference if top-line pressures worsen.
Investors might think the business is cheap at ~12x P/E, yet this is not far off the peak valuation of 2019. It’s also not cheap considering that over half of revenue is NII exposed to short-term and potentially longer-term headwinds, in my view.
Technicals
A 100% rally from the bottom makes some people excessively bullish, yet JPM’s own history shows that such sharp rallies into overbought territories have been mostly followed by periods of underperformance versus the S&P 500:
TradingView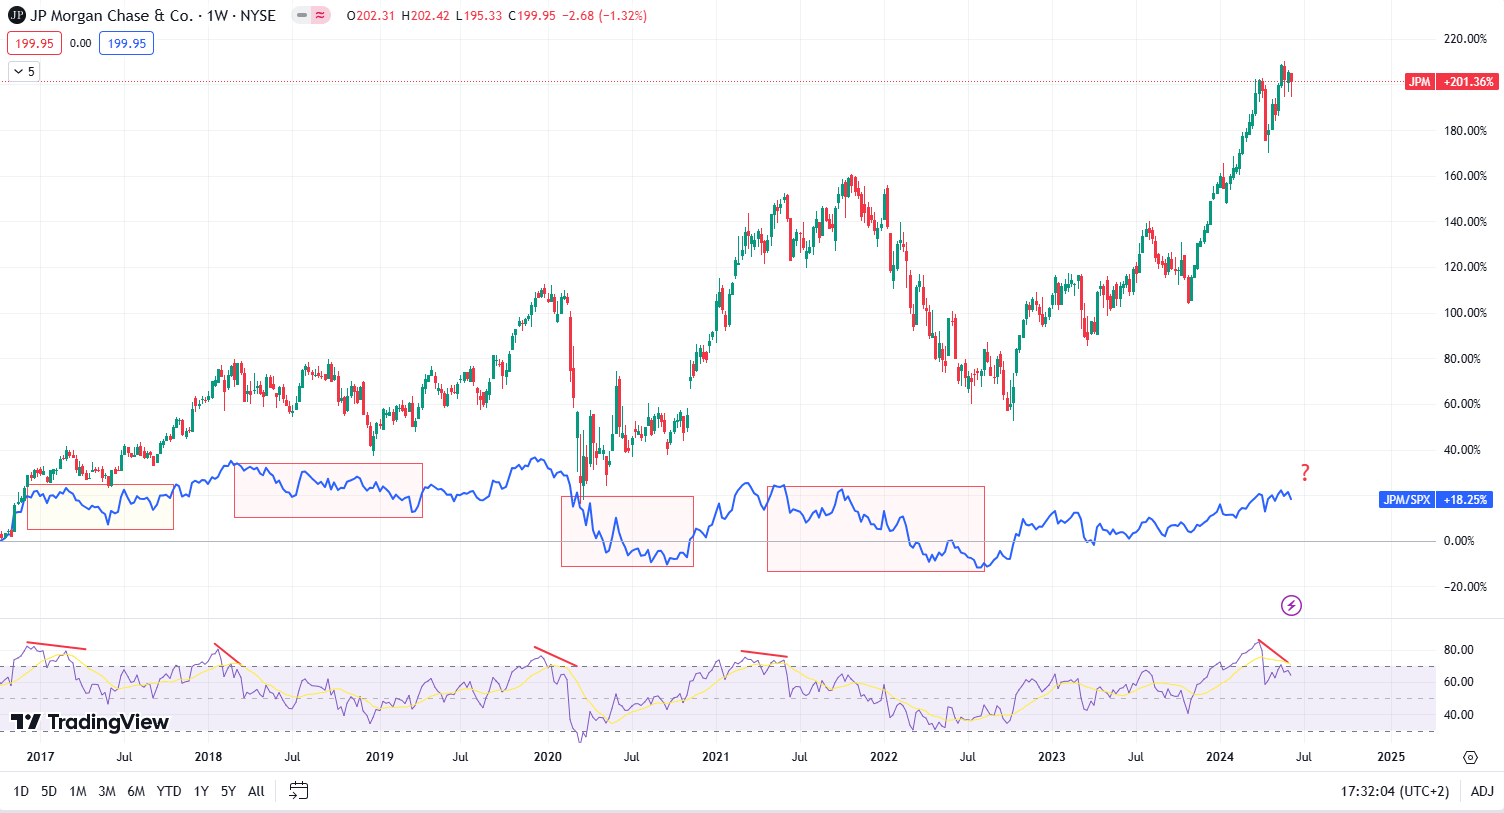
Conclusion
JPM is a high-quality multinational finance player that managed to outperform its peers for a while. It’s certainly a solid bank with its 15% CET1 capital ratio and high liquidity. Despite strong past performance, I believe JPM stock is unlikely to outperform the broader market in the next few years due to its high reliance on interest income and potential headwinds from falling interest rates. I plan to keep following JPM and update on my thinking around it, but for the moment I am waiting for a better entry point.
Analyst’s Disclosure: I/we have no stock, option or similar derivative position in any of the companies mentioned, and no plans to initiate any such positions within the next 72 hours. I wrote this article myself, and it expresses my own opinions. I am not receiving compensation for it (other than from Seeking Alpha). I have no business relationship with any company whose stock is mentioned in this article.
Seeking Alpha’s Disclosure: Past performance is no guarantee of future results. No recommendation or advice is being given as to whether any investment is suitable for a particular investor. Any views or opinions expressed above may not reflect those of Seeking Alpha as a whole. Seeking Alpha is not a licensed securities dealer, broker or US investment adviser or investment bank. Our analysts are third party authors that include both professional investors and individual investors who may not be licensed or certified by any institute or regulatory body.