Summary:
- Follow along as we discuss a potential top formation in Lilly’s stock price and the importance of proper evidence before taking a short position.
- We share our methodology that shows at what price level to turn more cautious if you are long Lilly shares at the moment.
- How does the structure of price on the Lilly chart show us this?
zoranm/E+ via Getty Images
By Levi at Elliott Wave Trader; Produced with Avi Gilburt
There are likely to be a few different types of shareholders here. You will have the “long and strong” crowd that has been in Eli Lilly (NYSE:LLY) shares for the last decade or more and is sitting on a pile of profits. Then it could also be that there are some that have recently entered this apparent non-stop ride to the stratosphere. This group is probably going to be a bit more like a cat on a hot tin roof wondering if or when to jump off.
Some time back we had a setup for members where a long-term top could be struck. However, the stock would not oblige that scenario. In fact, we have seen further appreciation of prices to levels that are now pushing irrationality by certain measures. We’re going to look at a few of these metrics. But we will also discuss how our methodology displays its utility and flexibility when a primary scenario does not play out as drawn up.
This piece is the first time we have featured LLY for the readership here. It is frequently covered by our team of analysts for members. Let’s take a look at what the valuation is telling us and then the structure of price on the chart.
A Juggernaut Of A Stock Is Lilly
This has been one that has defied gravity for some time now. If you refer to the FastGraph shared below, this becomes readily apparent.
Chart by Lyn Alden – FastGraphs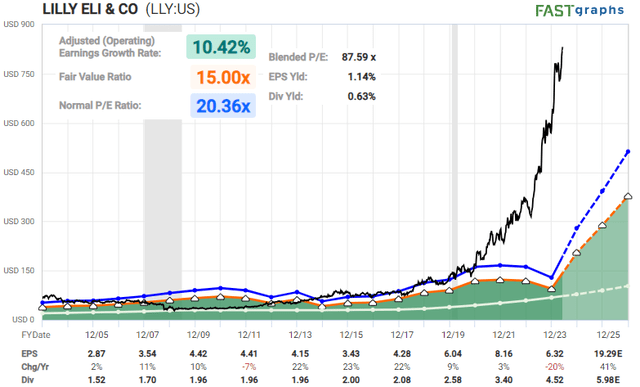
“I consider LLY to be likely overvalued, but that has been the case for a while. It’s important to wait for technical evidence of a top before taking a position.” – Lyn Alden
A much deeper dive into the pipeline, expectations, anticipations and even the international approvals recently received will reveal the impetus behind the juggernaut. An entire other article could be written regarding all of these components. For this current missive, let’s focus on what the structure of price on the chart is telling us and look for levels that would communicate possible weakness.
The Structure Of Price Speaks Volumes
One of the axioms that we will use from time to time is, “It’s OK to be wrong, just don’t stay wrong.” No methodology will produce a correct read in 100% fashion. However, via the structure of price, we can identify clear levels that tell us when to shift our weight or even change the primary scenario we have on our chart. Note what was the path we saw as the most likely at the beginning of this year:
by Zac Mannes – StockWaves – Elliott Wave Trader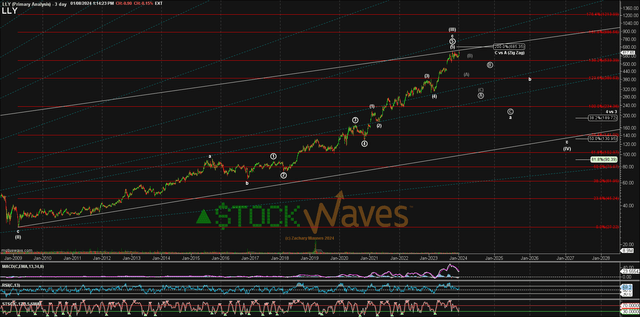
The possibility existed for LLY to strike a major high at the $685 level. However, there was no sell setup. It is quite similar to what we are seeing now. Price has extended yet once again and the same potential is apparent. What would a sell setup look like?
by Garrett Patten – StockWaves – Elliott Wave Trader by Zac Mannes – StockWaves – Elliott Wave Trader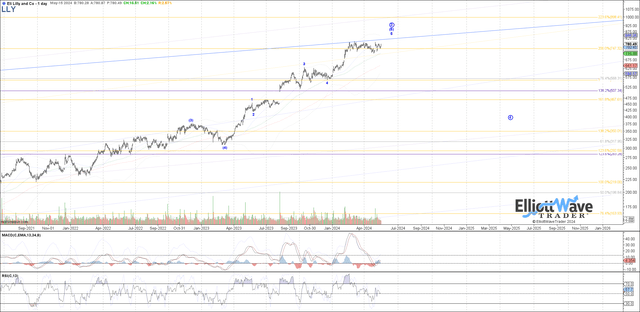
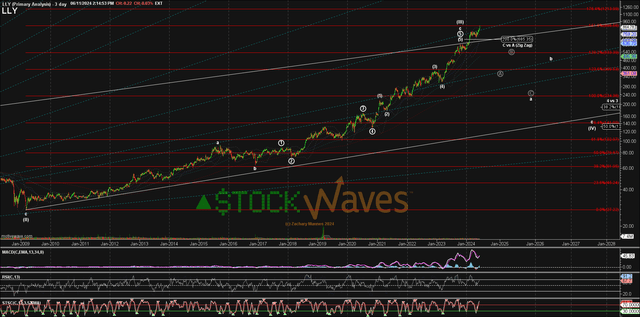
You can see from both of our lead analysts, price has now reached a possible completion point of the structure. What’s more, this is the first time that MACD could also display negative divergence versus price on this time interval. Does this mean sell? That would depend on your own individual time frame, investment plan and risk profile. However, it would seem that this is a good place to turn cautious.
by Zac Mannes – StockWaves – Elliott Wave Trader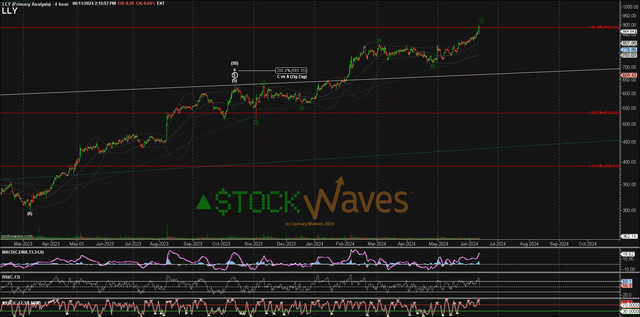
Note here how price is completing a smaller degree 5 waves up. This in and of itself would suggest that at the very least a minor pullback should follow. And, zooming out again to the daily level, with potential MACD negative divergence forming, should price move below the $835 area, it would be the first indication that the anticipated pullback has taken hold. How deep might that take us? We will continually monitor the shape this pullback forms and update it accordingly for members.
For now, we are cautious of a potential long-term top being struck soon. How do we arrive at this conclusion?
What This Methodology Is And Is Not
I want to share with you that this is not “Technical Analysis”, as you may know it. It is not trendlines and moving averages. Over many years of diligent study, observing markets in real-time, superimposing our methodology onto price as it unfolds in front of us, we have come to appreciate that this is not a linear environment. This being the case, how could we apply linear analysis to a non-linear world? That simply would not work in a reliable fashion.
So, while this may be ‘tagged’ as “Technical Analysis,” it really is so much more than this. We have a multitude of educational information available to those wishing to explore this further. In just a bit of time and with a portion of effort, you just may discover the true nature of the markets and come to understand them with greater depth.
If you are so inclined, please start with part one of the six part series authored by our founder, Avi Gilburt:
This Analysis Will Change The Way You Invest Forever
Now, for the purposes of our article here, let’s remember that markets advance on 5 waves and correct in 3 waves. This basic understanding is also coupled with the fact that these same markets are fractal in nature. They display self-similarity at all degrees, or time intervals, from minutes to hours to days and longer.
What’s more, this is not simply used to explain what has already happened. It would stand to reason that if these fractals are repeating, then we would be able to use these smaller structures to project what is most likely to happen next in the larger structure. That is the true power and utility of Elliott Wave Theory when correctly applied. This is what we have done with the LLY chart and information above.
Conclusion
The structure of price on the chart is telling us to turn cautious here regarding LLY shares. Can it continue higher? Of course. But, do you have specific levels in place to tell you when to turn more protective?
Yes, there are nuances to the analysis.
There are many ways to analyze and track stocks and the market they form. Some are more consistent than others. For us, this method has proved the most reliable and keeps us on the right side of the trade much more often than not. Nothing is perfect in this world, but for those looking to open their eyes to a new universe of trading and investing, why not consider studying this further? It may just be one of the most illuminating projects you undertake.
(Housekeeping Matters)
If you would like notifications as to when our new articles are published, please hit the button at the bottom of the page to “Follow” us.
Analyst’s Disclosure: I/we have no stock, option or similar derivative position in any of the companies mentioned, and no plans to initiate any such positions within the next 72 hours. I wrote this article myself, and it expresses my own opinions. I am not receiving compensation for it. I have no business relationship with any company whose stock is mentioned in this article.
Seeking Alpha’s Disclosure: Past performance is no guarantee of future results. No recommendation or advice is being given as to whether any investment is suitable for a particular investor. Any views or opinions expressed above may not reflect those of Seeking Alpha as a whole. Seeking Alpha is not a licensed securities dealer, broker or US investment adviser or investment bank. Our analysts are third party authors that include both professional investors and individual investors who may not be licensed or certified by any institute or regulatory body.
STOCK WAVES: Where fundamental analysis meets technical analysis for highest-probability investment opportunities! Get leading Elliott Wave analysis from our team, along with fundamental insights and macro analysis from top author Lyn Alden Schwartzer.
“Stockwaves is my bread and butter, and that’s only catching maybe 10% of the charts they throw out! I had 7-10x+ trades with SW last year, and dozens more that were “slackers” (LOL) with “only” 3-4-5x returns. Amazing!” (Nicole)
Click here for a FREE TRIAL.
