Summary:
- Nike stock experienced a significant rise in value over four decades, leading to a challenging sell recommendation despite investor sentiment.
- Despite initial resistance, subsequent sell calls on Nike stock proved prescient, as the stock corrected nearly -60% from its highs.
- Current valuation analysis suggests that Nike stock remains overvalued, with a 10-year earnings CAGR estimate below 5%, warranting a “Hold” rating.
Robert Way
Introduction
I view my job as a stock analyst as one whose primary responsibility is two-sided. One side is to share stock ideas with readers that have a high probability of producing great returns, while the other side is to warn about risky stocks that have a high probability of producing poor returns. This second responsibility remains, even if it would be more lucrative for me as an analyst to be bullish all the time on stocks that have a long history of success (investors tend to like to have their winning investment ideas reinforced rather than challenged). Yet, I feel an even deeper responsibility to warn investors when a stock has produced staggeringly great returns as Nike (NYSE:NKE) did for four decades because so few others are willing to issue those types of valuation warnings.
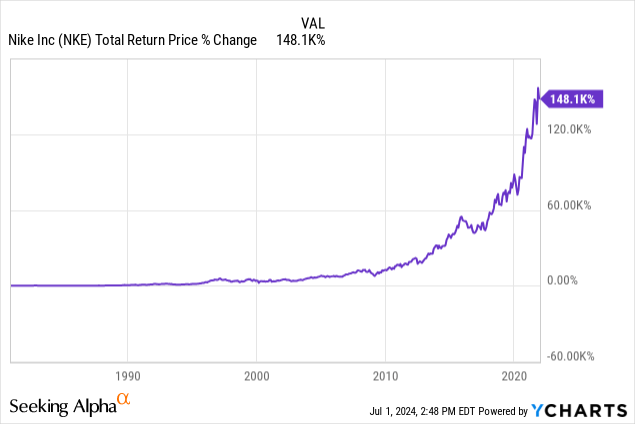
Near its peak in late 2021, Nike stock had produced nearly a 150,000% return since the early 1980s. Virtually every investor who had bought and held the stock during this time had made money, and some of them were even made very rich. This made it very difficult for someone like me to convince investors on September 18th, 2019 that Nike stock was a “sell” in my article “Nike: A 10-Year, Full-Cycle Analysis” where I made the case that based on what investors were paying for future earnings and the potential mean reversion the stock would likely experience, it would be wise to let Nike stock go.
If making that initial case to sell NKE wasn’t hard enough, the market’s initial reaction after my article was to send the price even higher. Here is how the stock performed in the 15 months after that article.
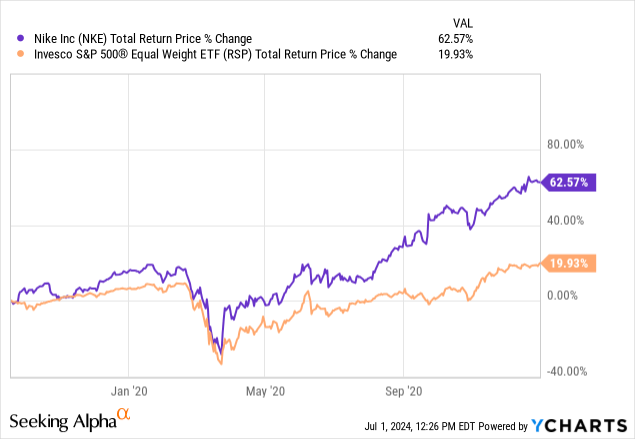
NKE rose over 60%, tripling the return of the average stock in the S&P 500. It was at that point, I produced a follow-up “sell” video on my YouTube channel on January 3rd, 2021, again based on an earnings analysis. The fundamentals simply did not support the stock price move. Near its peak, NKE traded at a P/E ratio of around 50, with an expected earnings growth rate under 7%. A basic PEG ratio valuation of about 7 demonstrated the stock was incredibly overvalued.
During the past two and a half years, Nike stock has started to correct, and it’s now nearly -60% off its highs.
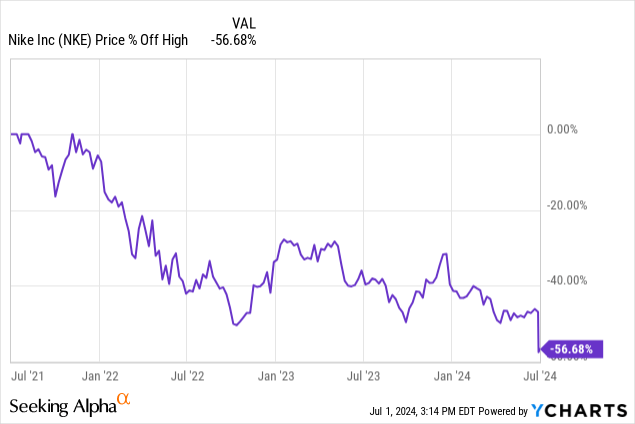
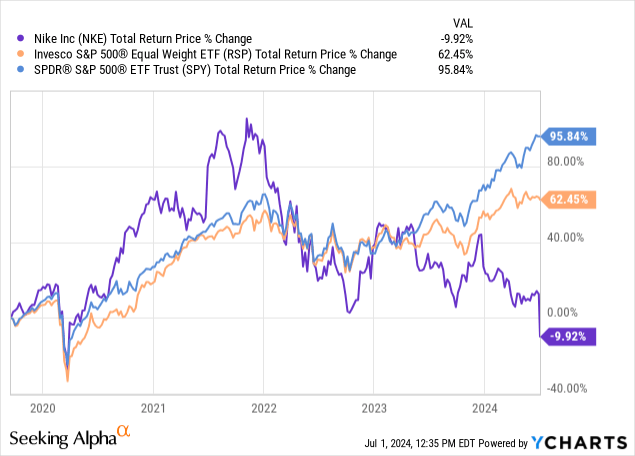
My sell calls, which at first appeared horribly wrong, now look obvious in hindsight. Here is how Nike stock has performed since my first sell article in 2019 compared to the S&P 500:
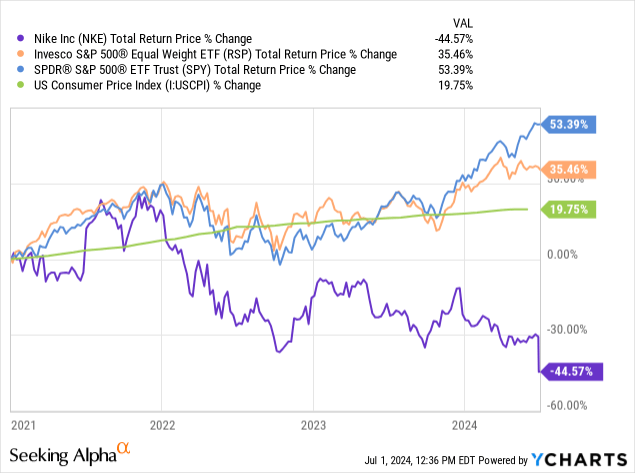
And here is how it has performed since my sell video in January 2021:
I also made an additional sell video last fall on October 17th titled “Why Nike Stock Remains A Sell”, so I have been consistent over the past 5 years when it came to Nike stock’s overvaluation.
There are several investing concepts and lessons I would like readers to take away from this article:
- Over the medium and long-term, valuation matters, but not necessarily over the short term.
- Over the short term, the market can remain irrational without limitation.
- The market tends to focus on the short term, almost never looking more than 1 year into the future when it comes to earnings trends. This can “justify” or “rationalize” irrational stock price movements.
- If you are a fundamental-based investor, you need to focus on the medium and long term and not take cues from short-term market moves.
- Well-known brand name stocks with fantastic long-term records are not immune to deep losses.
- Every business has a life-cycle, so estimating where a business is in that cycle is important.
Next, I’ll share an updated valuation since the price has dropped considerably to see where the valuation stands today.
Current Earnings Growth Estimates
Establishing an estimated long-term earnings growth estimate is not only important for the math of an earnings valuation, it’s also important to help estimate where a business is in its lifecycle. As businesses grow into their addressable market, earnings growth naturally slows. So, a pattern of slow earnings growth is often a sign of a more mature business, or one that is getting disrupted, or one that is experiencing changing consumer tastes.
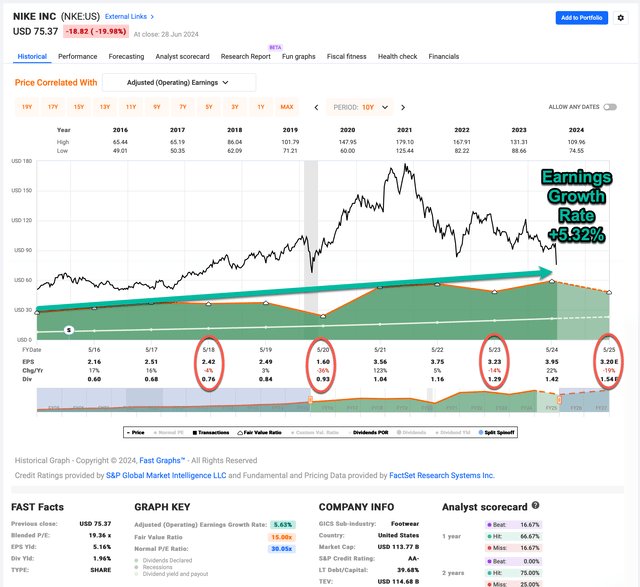
I usually start my earnings growth estimate by using the most recent economic cycle as a guide for what earnings growth might look like going forward. In Nike’s case, I will use 2016 through 2025’s forward earnings to estimate their earnings growth rate. I will include negative earnings growth years and I will control for stock buybacks since I want to know how much money I would be able to keep from earnings as an owner of the business. (While I don’t really count the 2020 recession as a ‘real’ recession, I think Nike’s earnings decline that year is likely similar to what we might expect during a typical recession, so I think it is fair to treat 2020’s earnings decline as an average recession decline in this case.)
I like to take into account the years in which earnings declined when I estimate my earnings growth rates rather than simply measure from one point in time to another and assume smooth earnings growth occurred over that period. Additionally, when using earnings per share like in the FAST Graph above, I control for stock buybacks as well because they can inflate the EPS growth rate by lowering the share count.
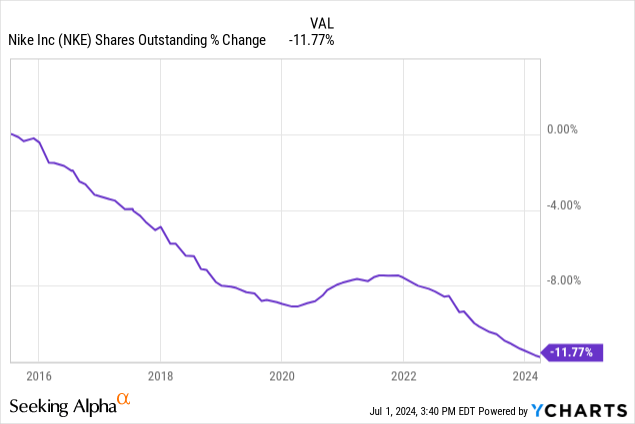
Nike has bought back about 12% of the company since mid-2015.
When I control for those things, I get an earnings growth estimate of about +5.32%, slightly lower than FAST Graph’s +5.63% measurement, but still very close. Under any circumstances, this is a pretty low earnings growth rate, but when we consider what recent inflation has been, it makes this level of earnings growth look much more like that of a fully mature business rather than one that has considerable growing room.
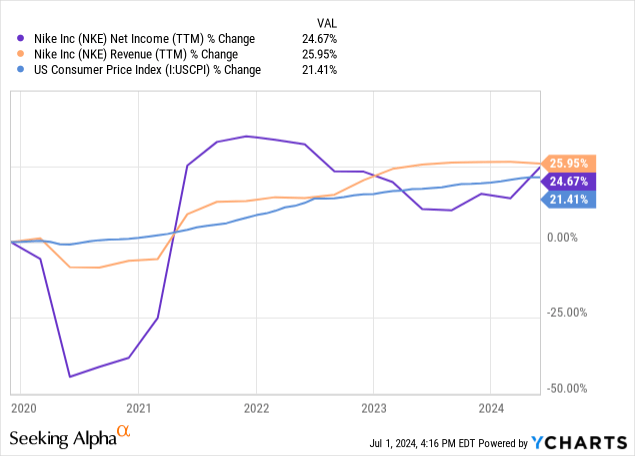
Since my first bearish article in September 2019, both Nike’s net income and revenue have essentially matched inflation. So, in real terms, Nike has gone nearly 5 years now with no real revenue or earnings growth. There is nothing “wrong” with that in and of itself. This is a natural process that all businesses go through. However, it is very important that investors understand that Nike is now a mature business in which real earnings growth will be difficult to come by. On a positive note, they have been able to keep pace with inflation so their business hasn’t actually started declining, yet.
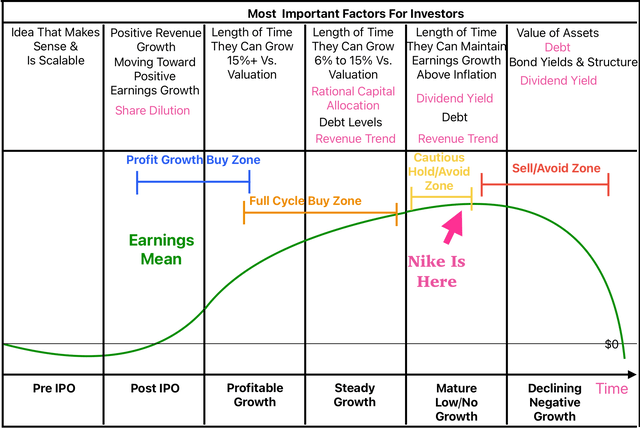
I created the graphic below to help illustrate where I think Nike is on the typical business life-cycle timeline.
Back when Nike was trading near a 50 P/E a couple of years ago, it was trading as if it was a young business in the “Profitable Growth” stage, with lots of room for further growth rather than the reality, which is that it was a mature business that will fundamentally require a new growth driver to improve from where they are now. This massive disconnect is what led to the recent stock price collapse. For what it’s worth, I think the biggest contributing factor that led to the massive overvaluation is that Nike grew earnings a staggering 123% in 2021. The market looked at that growth rate and assumed that was sustainable for some time, when really most of it was simply making up for a poor 2020 and the rest was driven by stimulus money that would eventually drive up inflation. This market reaction shows 1) how short-term and momentum-oriented the market can be, 2) how irrational the market can be at times, and 3) the market can be far from efficient because it only required some basic logic to understand that Nike’s valuation was far from rational at the time.
Nike’s Current Valuation
Now that I’ve estimated Nike’s earnings growth rate at +5.32%, all we need to do is determine the current earnings yield to estimate the valuation now that the stock price has fallen. I will use forward earnings estimates for that.
Right now, as shown in the previous FAST Graph, Nike is expected to earn $3.20 per share this fiscal year. As I write this, the stock price is $76.04. This produces an earnings yield of 4.22%. (The earnings yield is the inverse of the P/E ratio, or earnings over price E/P, expressed as a percentage.) I like to think of this valuation from the perspective of a business owner, so if I bought Nike’s business for $100, I would earn $4.22 per year, and that would grow at a +5.32% rate each year. I assume that profit is taken and spent on whatever the owner pleases and not reinvested. What I want to know is what sort of CAGR this would produce after 10 years of collecting earnings (I pull the first year’s earnings growth forward when I do this).
When I run the numbers on this, I could earn $56.70 in earnings after 10 years for every $100 invested in Nike stock at today’s price. This translates into about a +4.59% 10-year earnings CAGR. Usually, if I own a stock and the 10-year earnings CAGR estimate falls below 5% I consider selling the stock for valuation reasons, so Nike stock doesn’t currently look like a buy even after its gigantic sell-off. However, it is possible they could do things like cost-cutting over the next year to improve the forward earnings outlook, and right now, the market is generally pretty negative on the stock. Earnings expectations are relatively low. So, while the stock price could go lower, I am going to rate the stock a “Hold” here since there could be some investors who might be convinced of a Nike turnaround story and put a bottom under the stock price for a while.
In terms of what I price, I would consider buying the stock, based on today’s estimates, Nike would trade around a 6.5% 10-year CAGR if the stock traded at a price of about $49 per share. I prefer to have a margin of safety when I buy stocks, so I personally require an 8% 10-year CAGR estimate. In order to produce that 8% CAGR, Nike stock would need to trade at about $37 per share, or about -50% lower than where it trades today. If investors think that Nike’s recent earnings decline might be due more to an economic slowdown, and not due to other more persistent factors like competition, then, based on how Nike performed during the 2008 recession, it would be a good buy around $52 per share.
Conclusion
Valuations really do matter over the long term when it comes to stock investing. It’s worth noting that I haven’t been bearish on all shoe stocks. On September 19th, 2022 I published a bullish article on Adidas stock after purchasing it titled “It’s Time To Buy adidas Stock And Wait For A Recovery“. I still own the stock. Here is how it has performed.
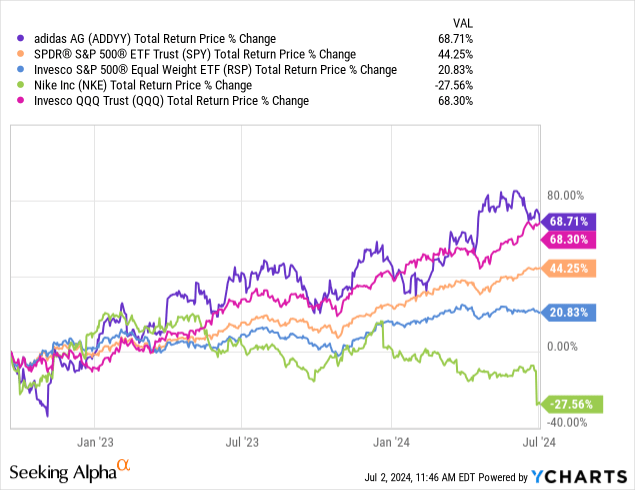
Adidas has outperformed both the S&P 500 and Nike, and kept pace with the high-flying tech-heavy (QQQ) since that article. Investors simply had to buy the stock when it was undervalued. I often hear critiques that my buy prices are too low and will never occur. But adidas shows that opportunities do come along from time to time, even for well-known brands, and that I am willing to step in and buy when those opportunities occur. I also own an additional shoe company in my investing group.
When we zoom out, I think Nike stock has a challenging road ahead. Much like other US brands that have expanded into China, there is a risk that China’s poor economy and deteriorating geopolitics could reverse growth. Nike also faces multiple new successful competitors. If the stock was trading at a cheap valuation like adidas was a couple of years ago, that would be one thing, but I don’t think even after this -60% decline that the stock is cheap, yet, so I would continue to avoid for now.
Analyst’s Disclosure: I/we have a beneficial long position in the shares of ADDYY either through stock ownership, options, or other derivatives. I wrote this article myself, and it expresses my own opinions. I am not receiving compensation for it (other than from Seeking Alpha). I have no business relationship with any company whose stock is mentioned in this article.
Seeking Alpha’s Disclosure: Past performance is no guarantee of future results. No recommendation or advice is being given as to whether any investment is suitable for a particular investor. Any views or opinions expressed above may not reflect those of Seeking Alpha as a whole. Seeking Alpha is not a licensed securities dealer, broker or US investment adviser or investment bank. Our analysts are third party authors that include both professional investors and individual investors who may not be licensed or certified by any institute or regulatory body.
If you have found my strategies interesting, useful, or profitable, consider supporting my continued research by joining the Cyclical Investor’s Club. It’s only $40/month, and it’s where I share my latest research and exclusive small-and-midcap ideas. Two-week trials are free.
