Summary:
- Tech earnings season is kicking off with Alphabet and Microsoft.
- Three critical facts about GOOG’s dividend are more important than anything we’ll learn during earnings.
- GOOGL’s cash-rich AA+ balance sheet makes for one of the lowest-risk dividends on Wall Street.
- GOOGL’s incredible growth prospects, including potentially quadrupling free cash flow by 2030 could allow for 10X dividend growth in six years.
- GOOGL is trading at a modest 12% discount, with 15% upside potential within one year, 40% within three years, and 140% within five years, far better than the S&P. Combined with the best optionality of any new dividend growth blue-chip, GOOGL is a potentially excellent buy on any post-earnings weakness.
Nattakorn Maneerat
It’s earnings season once more, and tech earnings season is kicking off this week with Alphabet Inc. (NASDAQ:GOOG)(NASDAQ:GOOGL) and Microsoft Corporation (MSFT).
Naturally, many articles will preview and review Alphabet’s earnings results this week.
That’s to be expected since the financial media has to fill time, and the Mag 7 mega tech names make up almost 30% of the S&P market cap.
Alphabet Earnings Surprises: Hint… If The Economy Is Strong, GOOG Tends To beat.
Seeking Alpha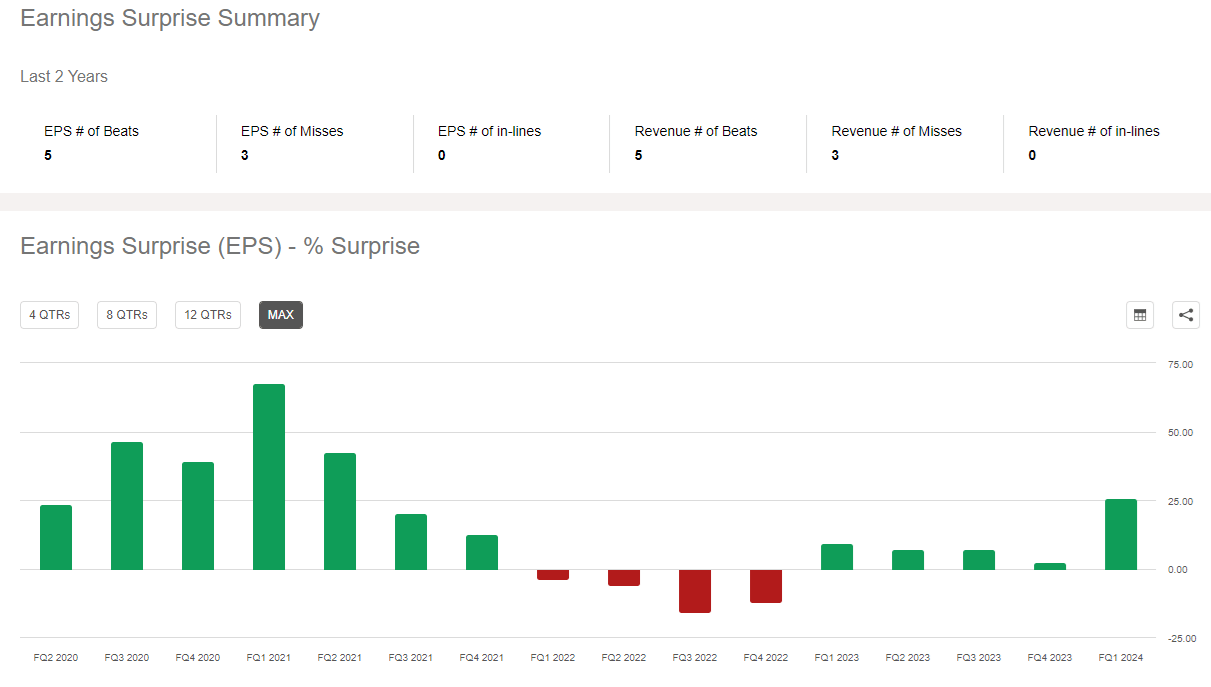
However, as I like to remind readers, stock price is vanity, cash flow is sanity, and dividends are reality.
Focus On Dividends
Dividends are critical to long-term investing success.
Hartford Funds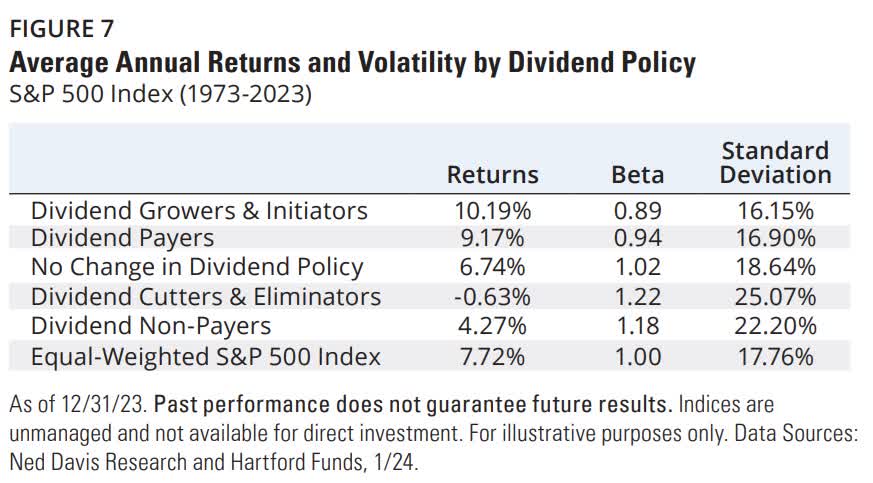
Dividend growth stocks outperform over time because the companies that are healthy enough to pay a consistently growing dividend, such as dividend aristocrats and today’s tech giants, have several characteristics that historically generate superior returns.
- Strong balance sheets.
- Wide moats.
- Long-term corporate culture.
- Strong risk management culture.
These are all things needed to minimize the risk of cutting dividends, which history has shown is the No. 1 warning sign of poor long-term real returns.
Hartford Funds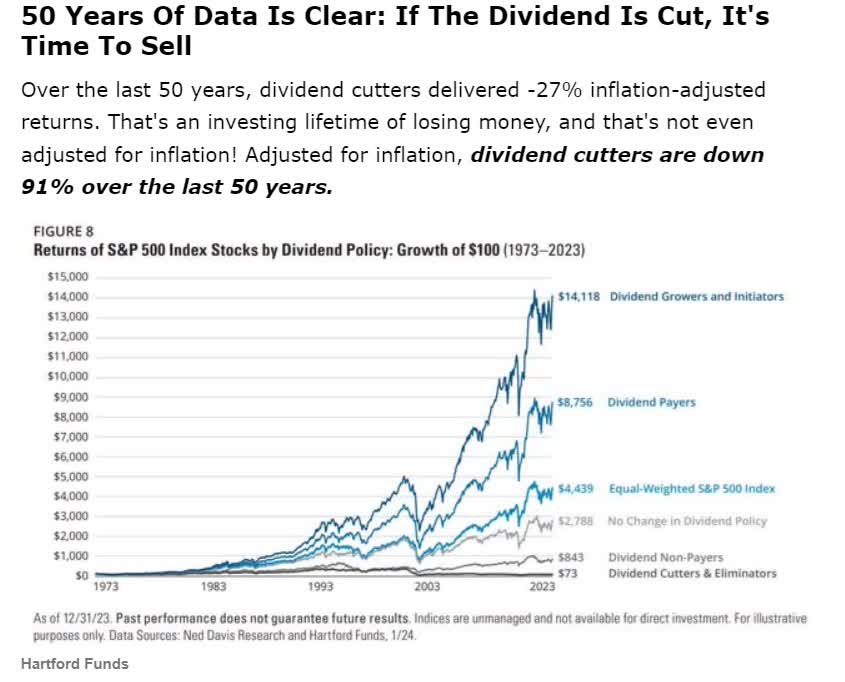
So, let’s examine Alphabet through the lens of dividends to see what investors need to know about this incredible company.
Specifically, let’s look at three critical facts about Alphabet’s dividend income that investors need to remember this earnings season.
Fact 1: Alphabet’s Dividend Is One Of The Most Dependable On Wall Street
Dividend Kings Zen Research Terminal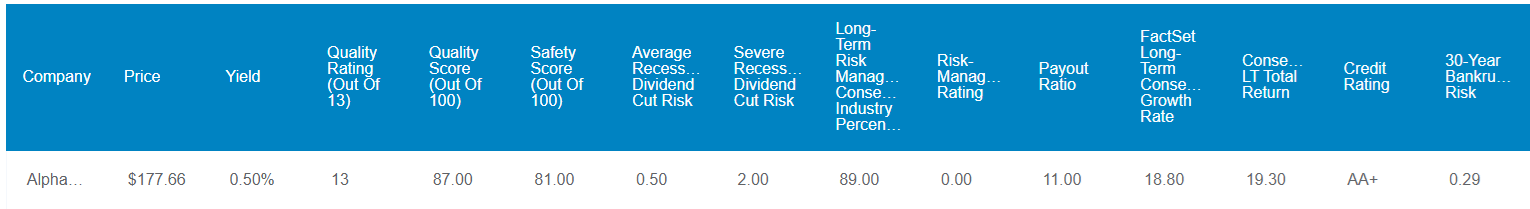
Alphabet’s dividend might be brand new, but it’s a very low-risk payout. The payout ratio is just 11%, and the AA+ credit rating is on par with the US government’s rating from S&P and Fitch.
S&P and Fitch estimate a 0.29% risk of GOOG defaulting on its bonds in the next 30 years.
That’s a good proxy for the risk of investors losing 100% of their investment, as usually occurs in corporate bankruptcies.
FactSet Research Terminal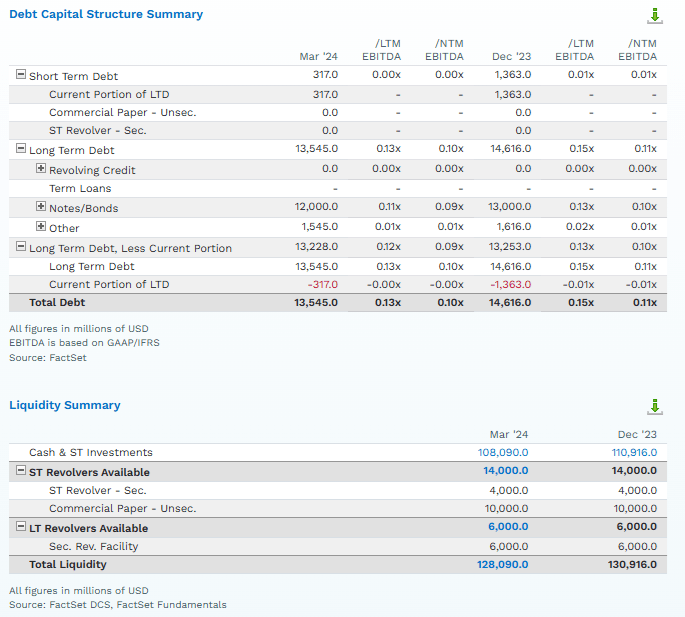
Alphabet has the highest net cash position of any US company, $96 billion. That means a net interest income of around $5 billion courtesy of the US government.
Wide moat? How many GOOG rivals are getting $400 million per month, $100 per week, from the US government risk free?
In the next 12 months, analysts believe GOOG will have access to $228 billion in liquidity.
For context, that’s approximately 4X of the estimated assets of the Vatican.
FactSet Research Terminal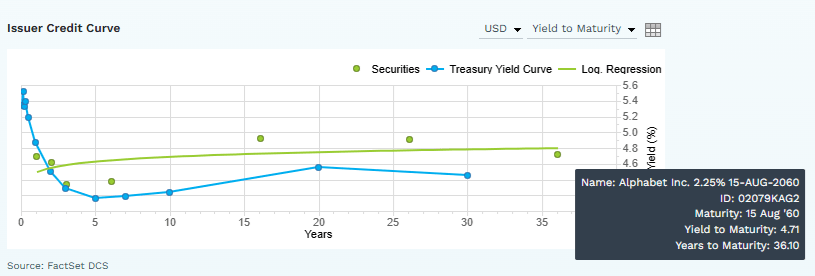
In August 2020, GOOG sold 40-year bonds at just 2.25% interest rates, part of a $10 billion bond sale.
The Fed has since raised rates to 5.25%, and GOOGL’s 2060 bonds yield 4.71%, just 0.3% above the 30-year US Treasury yield.
That’s how confident the bond market is in Alphabet’s risk management, balance sheet, and long-term growth prospects.
Fact 2: Dividend Growth Prospects Are Exceptional
Alphabet is a beautiful dividend-paying tech conglomerate.
It’s a world leader in search, digital marketing, streaming, and cloud computing, its major businesses.
FourWeekMBA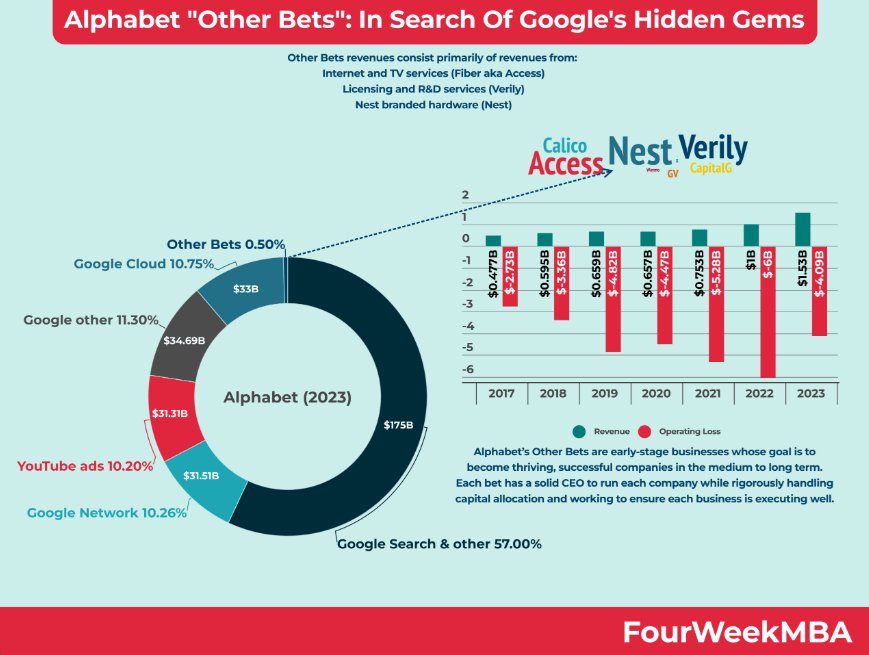
Alphabet’s other bets, its Moonshot subsidiary portfolio, generated 0.5% of revenue and lost $4 billion in 2023.
Perplexity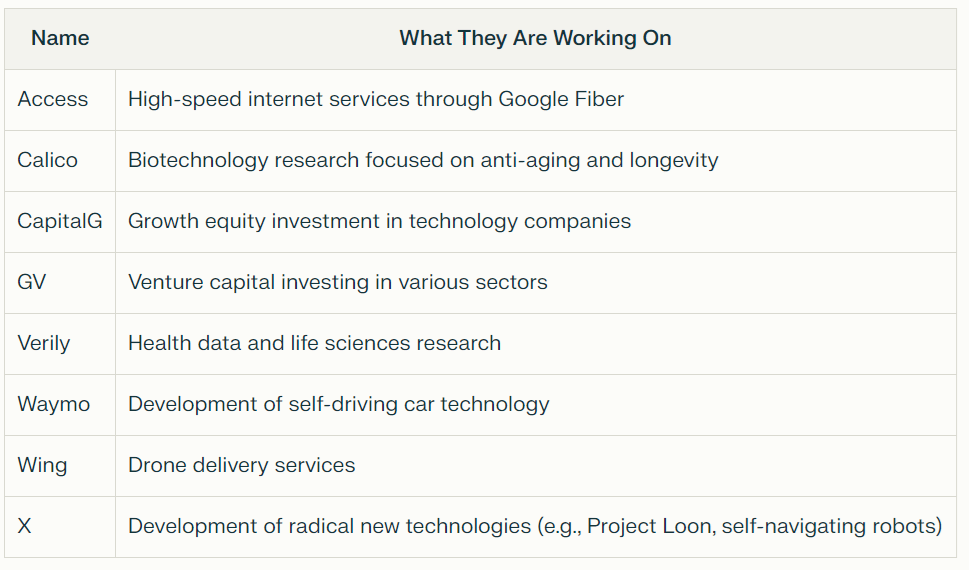
But the potential for some of those “other bets” to pay off is enormous. Consider GLP-1 drugs for fighting obesity.
GLP-1 drugs like Ozempic are a potential $150 billion annual market by the 2030s.
Right now, Anti-aging is a $72 billion annual market, and that’s not with effective drugs – it’s primarily supplements.
Projections vary, but estimates suggest the market could reach between $120.4 billion and $274.3 billion by 2032, with a compound annual growth rate – CAGR – ranging from 4.9% to 6.8%.
In other words, in a rapidly aging world, anti-aging could be a larger market than GLP-1, which is highly effective at treating obesity by helping people lose 15% to 25% of their body weight.
And that’s primarily supplements. Imagine what an “Anti-aging Ozempic” drug could mean.
That’s what Calico is working on.
Robo-taxis are a potential $10 trillion addressable market per year if the technology is perfected.
Alphabet is a leader in robot taxis and one of just two companies with the free cash flow capacity to build a potential global fleet of robot taxis.
To build a fleet of 260 million robotaxis at $135,000 each:
Cost = 260,000,000 vehicles x $135,000 per vehicle= $35,100,000,000,000
This is a reasonable estimate of what a global robo-taxi fleet would cost.
To obtain a similar market share in robo-taxis as the cloud giants have today in cloud computing would cost around $12 trillion.
Naturally, that would be invested over decades.
But $12 trillion invested over 30 years is still an incredible $400 billion annually.
For context, the US government is expected to spend $1.7 trillion on infrastructure, chip manufacturing and R&D through 2029.
| Company | Cumulative Growth Spending 2024-2029 | Free Cash Flow Return On Invested Capital | Future FCF From Growth Spending 2024-2029 | 10-Year Average Price/FCF | Market Value | Current FCF | Market Cap | Price/Free Cash Flow | Investment Spending CAGR | 2029 Growth Spending |
| Microsoft | $529,445 | 24.55% | $129,979 | 26.52 | $3,447,036 | $73,520 | $3,220 | 22.83 | 14.0% | $124,054 |
| Apple | $268,909 | 58.21% | $156,532 | 18.53 | $2,900,537 | $105,512 | $2,950 | 35.77 | 1.0% | $36,114 |
| Nvidia | $109,842 | 86.57% | $95,090 | 41.14 | $3,912,012 | $57,167 | $2,660 | 21.49 | 29.8% | $25,082 |
| Amazon | $1,063,878 | 18.55% | $197,349 | 49.18 | $9,705,642 | $62,608 | $1,880 | 33.30 | 6.3% | $203,097 |
| Alphabet | $693,209 | 24.05% | $166,717 | 29.13 | $4,856,459 | $82,052 | $2,090 | 39.26 | 6.7% | $134,463 |
| Meta | $585,139 | 31.43% | $183,909 | 32 | $5,885,094 | $44,549 | $1,190 | 37.44 | 7.3% | $112,942 |
| Eli Lilly | $103,748 | -11.68% | -$12,118 | 31.47 | $777,057 | $8,941 | $791 | 11.30 | 6.2% | $19,563 |
| Broadcom | $21,310 | 23.32% | $4,969 | 18.47 | $91,787 | $23,297 | $716 | 32.54 | 10.2% | $7,981 |
| Tesla | $98,582 | 2.29% | $2,258 | 127.7 | $288,241 | $5,108 | $555 | 9.20 | 7.5% | $22,039 |
| Visa | $8,262 | 32.94% | $2,722 | 29.7 | $80,856 | $20,643 | $551 | 37.46 | -12.9% | $1,659 |
| UnitedHealth Group | $19,780 | 6.50% | $1,286 | 18.24 | $23,451 | $25,836 | $551 | 46.89 | 3.0% | $4,186 |
| Mastercard | $5,545 | 48.38% | $2,683 | 33.9 | $90,969 | $13,512 | $428 | 31.57 | -9.4% | $1,181 |
| Average/Total | $3,507,649 | 28.76% | $931,375 | 38.0 | $32,059,141.27 | $522,745.00 | $17,582 | 29.92 | 5.8% | $692,361 |
| US Government R&D | $1,775 Billion | US Government 2029 Forecast | $617.53 billion. |
(Source: FactSet Research Terminal)
What about Alphabet?
Alphabet Growth Spending Consensus
| Year | Alphabet R&D (Millions) | Alphabet Capex (Millions) | Total Growth Spending (Millions) |
| 2024 | $49,290 | $47,945 | $97,235 |
| 2025 | $53,957 | $50,582 | $104,539 |
| 2026 | $57,752 | $52,096 | $109,848 |
| 2027 | $65,003 | $55,349 | $120,352 |
| 2028 | $71,025 | $55,747 | $126,772 |
| 2029 | $77,140 | $57,323 | $134,463 |
| Total | $374,167 | $319,042 | $693,209 |
| Annual Growth Rate | 9.4% | 3.6% | 6.7% |
(Source: FactSet Research Terminal)
$700 billion in growth spending in just the next few years.
That’s a level of growth spending that most governments can’t dream of.
Ycharts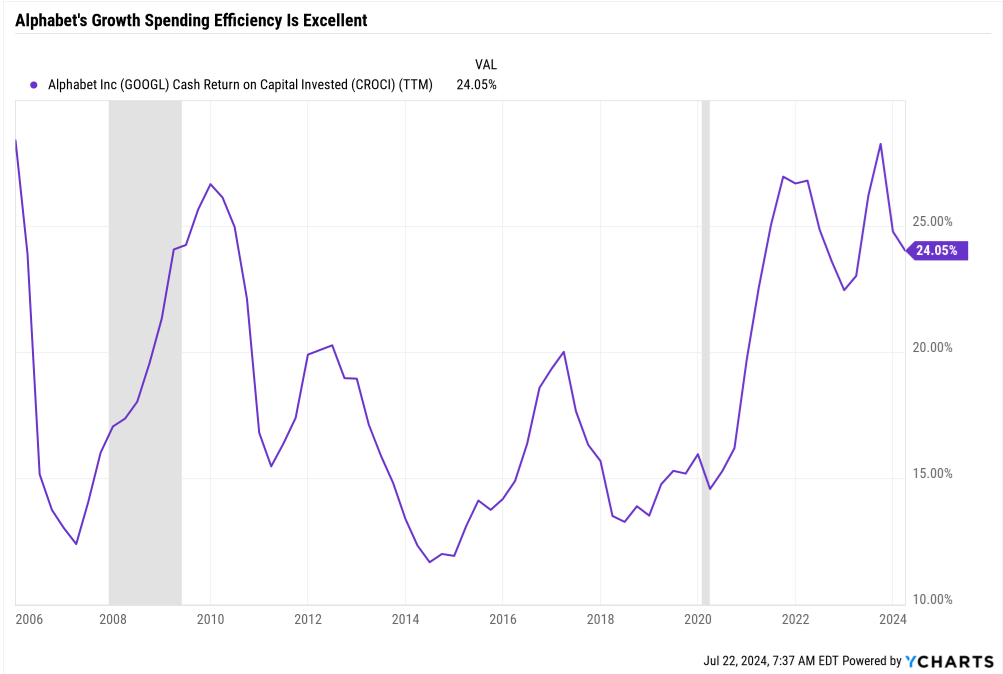
GOOGL’s free cash flow return on invested capital has averaged 17.5% since its IPO.
That’s approximately equal to private equity and venture capital funds, which historically earn 17% pre-fee returns and charge around 5% per year in fees.
However, while hedge and VC funds invest millions and sometimes billions, GOOG will soon invest over $100 billion annually.
Over the last year, its FCF return on capital has been 24%.
In other words, if GOOG is able to sustain that return on investment in two years, $100 billion in investment will translate into $24 billion in additional free cash flow.
| TTM Free Cash Flow Return On Invested Capital | 24.05% |
| Annual Cash Flow From Future Growth Spending Alone (2024 to 2029) | $166,717 |
| 10-Year Average Price/Free Cash Flow | 29.13 |
| Market Value Of Future Cash Flow Just From Growth Spending Through 2029 | $4,856,459 |
| Current Free Cash Flow | $69,495 |
(Source: FactSet Research Terminal)
Alphabet’s current growth spending could quadruple its annual free cash flow by 2030.
And if GOOGL continues to trade around 30X free cash flow as it has in the last decade, the extra cash flow that $700 billion in growth spending could generate might be worth $5 trillion.
In addition to its current value of $57 billion in FCF, GOOGL could have a potential $7 trillion market cap by 2029.
There are no bubbles here, just pure fundamentals courtesy of smart investments and rivers of free cash flow.
Alphabet Growth Consensus
| Year | Sales | Free Cash Flow | EBITDA | EBIT (Operating Income) | Net Income |
| 2023 | $307,394 | $69,495 | $120,582 | $84,293 | $73,795 |
| 2024 | $346,775 | $81,502 | $145,786 | $105,963 | $94,231 |
| 2025 | $385,814 | $93,343 | $165,543 | $118,510 | $105,260 |
| 2026 | $424,718 | $114,090 | $188,469 | $135,430 | $117,498 |
| 2027 | $475,887 | $131,934 | $212,113 | $154,717 | $137,873 |
| 2028 | $528,281 | NA | $249,184 | $183,478 | $165,716 |
| 2029 | $592,655 | NA | $291,331 | $213,917 | $199,779 |
| Annualized Growth 2024-2029 | 11.6% | 17.4% | 15.8% | 16.8% | 18.1% |
| Cumulative 2024-2029 | $2,754,130 | $420,869 | $1,252,426 | $912,015 | $820,357 |
(Source: FactSet Research Terminal)
$420 billion in free cash flow between 2024 and 2027, averaging $130 billion annually, after investing $310 billion in growth.
(Source: FactSet Research Terminal)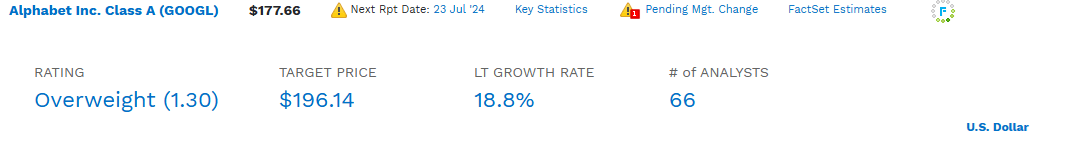
Alphabet’s long-term median growth consensus of 18.8% is exceptional, implying 19% to 20% long-term returns, including dividends.
(Source: FactSet Research Terminal)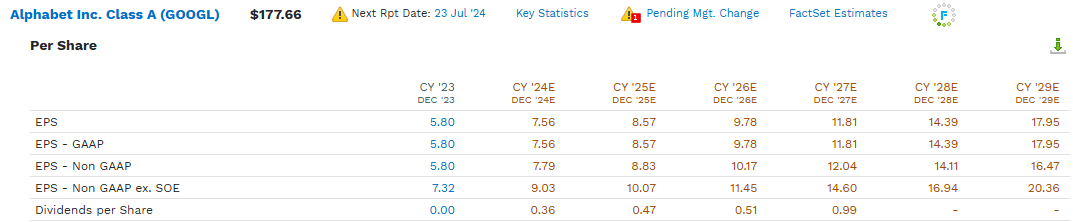
Analysts expect about 200% dividend growth through 2027, one of the world’s fastest growth rates of any dividend stock, with 40% annualized dividend growth.
Even with that strong growth, the consensus 2027 payout ratio is just 8%. That means GOOGL could keep growing the dividend faster than earnings for several years, raising the payout ratio.
Consider how companies like AVGO and TXN target 50% and 100% payout ratios, respectively (TXN has a 100% cash return policy). You can easily imagine GOOGL eventually spending 50% of its free cash flow on buybacks and 50% on dividends.
In other words, more than $200 billion in free cash flow in 2030 (based on growth spending consensus and cash return on invested capital) and a 50% FCF payout ratio would equal $100 billion in dividends, equating to about $8 in annual dividends.
47% CAGR dividend growth rate through 2030 would bring GOOGL to a 50% FCF payout ratio.
In other words, GOOGL’s current growth outlook supports the potential for a 10X increase in the dividend by 2030.
A potential 5% yield on cost for those buying today.
These are compelling consensus forecasts, but is GOOGL already pricing this potential growth?
Fact 3: A Wonderful Fast-Growing Dividend At A Reasonable Price
Dividend Kings Zen Research Terminal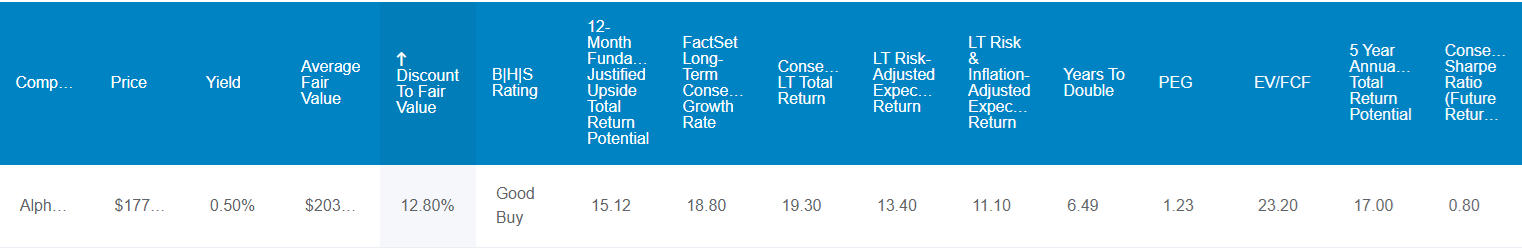
GOOG is about 13% historically undervalued, a potentially good buy for anyone comfortable with the risk profile.
Its fundamentals justify a 15% total return within the next year, compared to 7% for the S&P.
The inflation-adjusted risk-adjusted expected return is 11%, applying the probabilities of the company now growing at 18.8%, as analysts currently expect.
That means investors today can prudently and conservatively expect to potentially double their inflation-adjusted wealth in 6.5 years of owning GOOG.
The five-year consensus return potential is 17% per year, and the consensus future volatility-adjusted return ratio (Sharpe ratio) is 0.8, about 2X that of the S&P.
5-Year Consensus Total Return Potential: 137% = 17% Annually
FAST Graphs, FactSet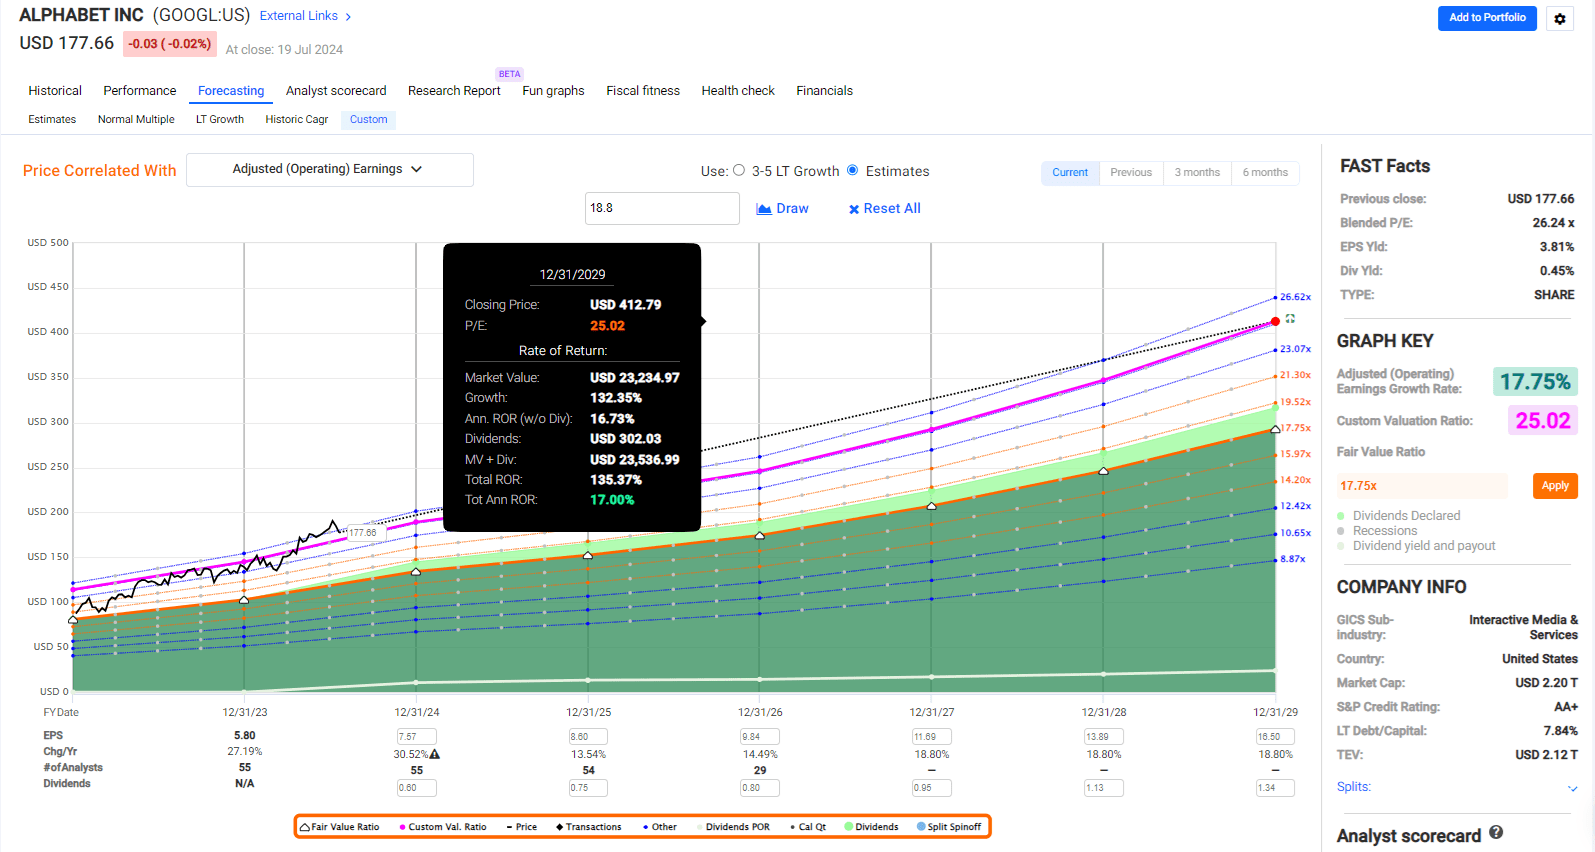
The S&P has a 75% consensus return potential over the next five years or 12% yearly.
GOOGL offers almost double that, a solid 17% return potential if GOOG earnings grow as expected and return to historical 10-year average fair value.
3-Year Consensus Total Return Potential: 40% = 15% Annually
FAST Graphs, FactSet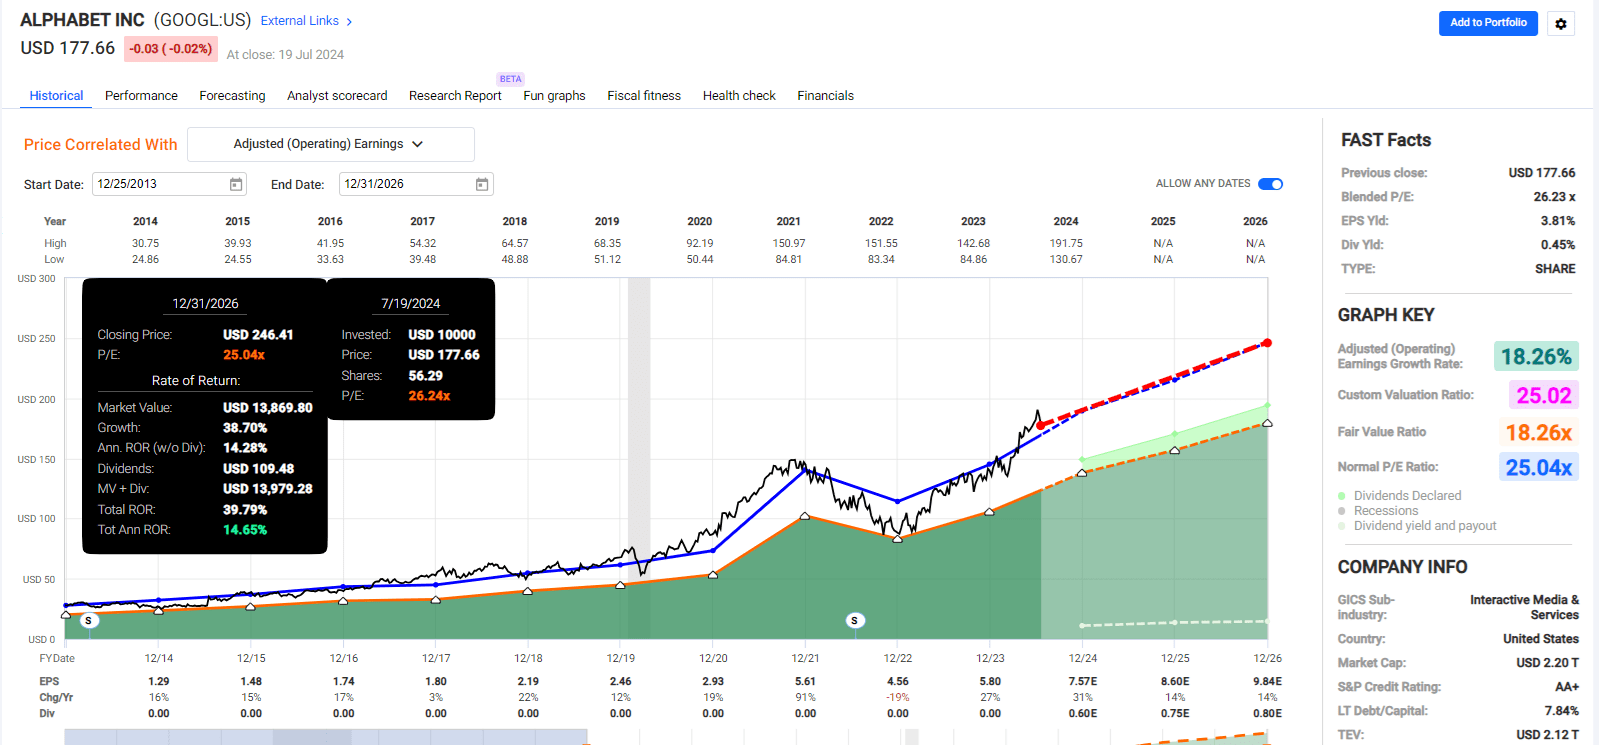
GOOG offers attractive short- and medium-term return potential and, over the long term, 19% to 20% return potential if current growth estimates hold.
Risk Profile: Why Alphabet Isn’t Right For Everyone
There are a lot of things that could threaten GOOG’s growth prospects.
One of the largest fundamental risks is government regulation, not just in the US but also in the EU.
Under the European Union’s General Data Protection Regulation (GDPR), the maximum fines that can be imposed on tech companies for non-compliance are substantial:
Up to €20 million, or 4% of the annual worldwide turnover of the preceding financial year, whichever is greater.
The EU accounts for about 30% of GOOGL sales, and if it violates GDPR, annual fines could be as high as $12 billion or $1 per month.
Then, there’s the risk of a breakup and forced spin-offs of things like YouTube. While this is a lower risk, and GOOG investors would likely benefit from unlocking value in things like YouTube, it would potentially impinge on GOOGL’s ability to gather data to feed its empire.
Remember that Google’s future is AI, and AI needs data. Having Google’s suite of tools, YouTube, and Cloud all under one roof creates the most streamlined AI acceleration platform.
And that’s just a taste of the regulatory risk GOOGL faces.
S&P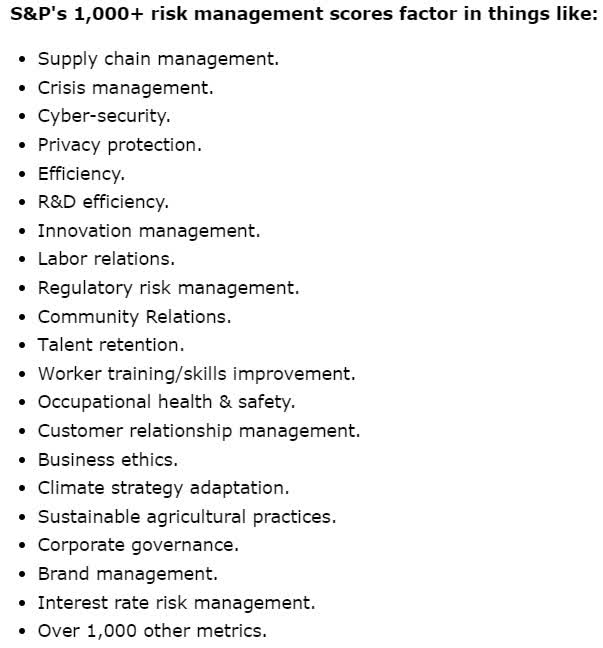
According to S&P, most large companies face over 1,000 significant risks they must manage over time.
| S&P LT Risk Management Score | Rating |
| 0% to 9% | Very Poor |
| 10% to 19% | Poor |
| 20% to 29% | Suboptimal |
| 30% to 59% | Acceptable |
| 60% to 69% | Good |
| 70% to 79% | Very Good |
| 80+% | Exceptional |
| GOOG | 64% Optimal |
| Global Percentile | 89% |
(Source: S&P)
S&P estimates GOOGL’s risk management is 64% optimal, comparing each risk against its industry’s No. 1 rated company.
That equates to risk management in the top 89% of global companies.
Bottom Line: Alphabet Is My Favorite New Dividend Growth Stock
We’ve had many new dividend growth stocks recently. Meta Platforms, Inc. (META), SalesForce, Inc. (CRM), and Booking Holdings Inc. (BKNG) are the biggest new dividend names, but Alphabet has what I consider to be the most optionality.
Alphabet is the world leader in search and digital advertising and the third-largest cloud computing company. AI and “Other Bets” are moonshots that could potentially transform the company in ways investors today can hardly imagine.
With earnings about to break, much digital ink will be spilled, and the price might increase significantly in the short term.
However, given the attractive prospects for its 0.5% yielding dividend safety, incredible dividend growth potential in the next six years, and attractive short to long-term return potential, be ready to take advantage of any short-term weakness on a potential earnings miss overreaction.
Analyst’s Disclosure: I/we have no stock, option or similar derivative position in any of the companies mentioned, and no plans to initiate any such positions within the next 72 hours. I wrote this article myself, and it expresses my own opinions. I am not receiving compensation for it (other than from Seeking Alpha). I have no business relationship with any company whose stock is mentioned in this article.
Seeking Alpha’s Disclosure: Past performance is no guarantee of future results. No recommendation or advice is being given as to whether any investment is suitable for a particular investor. Any views or opinions expressed above may not reflect those of Seeking Alpha as a whole. Seeking Alpha is not a licensed securities dealer, broker or US investment adviser or investment bank. Our analysts are third party authors that include both professional investors and individual investors who may not be licensed or certified by any institute or regulatory body.
—————————————————————————————-
Dividend Kings helps you determine the best safe dividend stocks to buy via our Automated Investment Decision Tool, Zen Research Terminal, Correction Planning Tool, and Daily Blue-Chip Deal Videos.
Membership also includes
-
Access to our 13 model portfolios.
-
my $2.2 million real-money family portfolio.
-
50% discount to iREIT (our REIT-focused sister service)
-
real-time chatroom support
-
real-time email notifications of all my family portfolio buys.
-
numerous valuable investing tools
Click here for a two-week free trial, so we can help you achieve better long-term total returns and your financial dreams.