Summary:
- The Coca-Cola Company delivered a strong Q2 overall, with healthy revenue and profit growth.
- Notably, operating margin and asset turnover rates both hover around multi-year peak levels.
- I see a well-rounded combination here, especially for income investors, with resilient profitability, consistent dividends, and reasonable total return potential.
pjohnson1/E+ via Getty Images
KO stock: Q2 recap
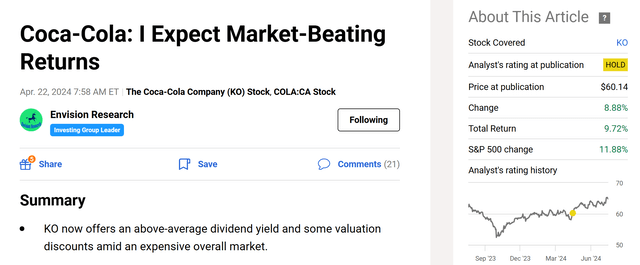
I last covered The Coca-Cola Company (NYSE:KO) about 3 months ago, as illustrated by the chart below. The article was titled “I Expect Market-Beating Returns” and was published on Seeking Alpha on April 22, 2024. More specifically, I made the following arguments:
KO now offers an above-average dividend yield and some valuation discounts amid an expensive overall market. As a result, I expect its long-term return potential to be noticeably better than what I expect from the overall market. Other positives offered by these shares include relatively low-price volatility, above-average dividend yield, and superb dividend growth consistency.
The focus of that article was thus oriented toward the long term. Given the release of its 2024 Q2 earnings report (“ER”) earlier today, I think it is a good idea to provide an updated assessment, with a focus on the near term to reflect the new developments since my last writing. In the remainder of this article, I will review my key takeaways from the ER – both the positives and the negatives. And you will see that my conclusion remains unchanged. I am expecting an annual return of ~8% under current conditions. This may leave more to be desired for growth investors, but I consider it a solid hold, especially for income-oriented accounts.
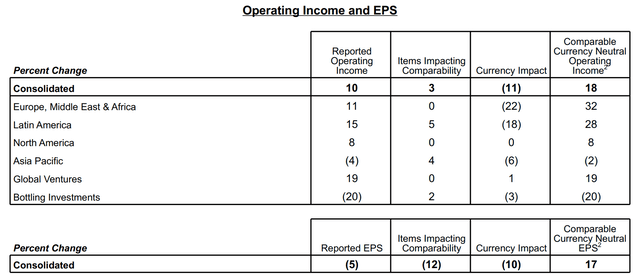
Before diving into the specifics of its Q2 financials, let me quickly recap the basics. Overall, the company reported robust results in both the top and bottom lines. Organic revenue increased 15% during the quarter, ahead of the 9.4% consensus estimate by a good margin. Profits are equally strong — or even strong in my view — as shown in the next chart. To wit, consolidated operating income increased by 10% as seen. Note that the growth was adjusted for an 11% currency impact (I will revisit this in the risk section). As a result, on a currency-neutral and non-GAAP basis, operating income grew 18% and EPS grew 17%.
When profit growth outpaces revenue growth, it, of course, means expanding margin, which is what I will elaborate on next.
KO stock: operating margin in focus
Operating margin (on a non-GAAP basis) dialed in at 32.8% (versus 31.6% a year ago). The next chart better contextualizes the performance. As seen, this level of operating margin is the highest in at least the past 3 years. Management attributed such expansion to strong business performance and the impact of refranchising bottling operations.
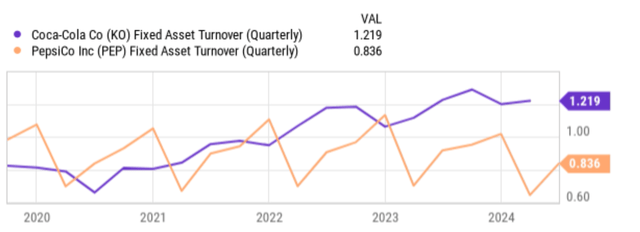
Broadening the context even more, the second chart below shows that KO’s business operations and refranchising efforts are indeed effective, both in comparison with its past performance and also in comparison against its old rival PepsiCo (PEP). To wit, the top panel compares their fixed asset turnover rates, and the bottom panel their operating margin. Fixed asset turnover is a measure of a company’s efficiency in using its fixed assets to generate sales. It is a key return driver in the DuPont Framework (with the other two being leverage and net profit margin). As seen, KO’s current asset turnover rate is indeed near a multi-year peak and definitively above PEP’s.
KO stock: growth outlook and valuation
Now, the less positive news. My overall takeaway is that growth remained challenged and uneven across different markets. The top growth drivers, unsurprisingly, were the Latin America market (+28%) and the EMEA (+30%). However, bear in mind that these also happen to be markets experiencing intense inflation, on top of the overall backdrop of above-average inflation in most of its markets. Thus, pricing actions played a significant role in offsetting shipping volume fluctuations. For example, in North America, unit case volume declined by 1%. All told, revenue growth was 3% YOY, among the bottom level in the past 3 years as seen in the chart below.
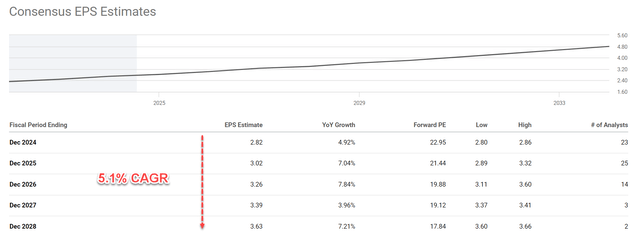
I expect the bottom-line growth to be slightly better, thanks to the expanded margin mentioned above and also share repurchases. Indeed, consensus EPS estimates point to an EPS growth rate of 5.1% (in terms of compound annual growth rate, CAGR) for the next five years as shown in the next chart.
The combination of a relatively slow growth rate and relatively high valuation multiple leads to a limited upside potential. As detailed in my earlier article, I am expecting an annual return of ~8% under these current conditions. To wit, KO’s forward P/E ratio is about 23x based on its FY 2024 EPS. It’s not cheap, either in absolute or relative terms. The current P/E ratio is actually quite unattractive from a growth-adjusted perspective. With a 23x P/E and 5.1% growth projection, the implied PEG ratio (P/E growth ratio) is over 5x, in comparison to the 1x ideal pick that most GARP (growth at a reasonable price) investors pursue. Of course, dividend-growth investors will object here to the use of PEG on KO. Indeed, the PEG ratio tends to understate the attractiveness of dividend stocks, especially those with sizable yields such as KO. In this case, I consider the PEGY ratio Peter Lynch promoted a more fitting yardstick because:
For dividend stocks, Lynch uses a revised version of the PEG ratio – the PEGY ratio, which is defined as the P/E ratio divided by the sum of the earnings growth rate and dividend yield. The idea behind the PEGY is very simple and effective (most effective ideas are simple). If a stock pays out a large part of its earnings as dividends, then investors do not need a high growth rate to enjoy healthy returns. And vice versa. And similar to the PEG ratio, his preference is a PEGY ratio below 1x.
For KO, plugging a projected growth rate of 5.1%, a P/E of 23x, and a dividend yield of 2.9%, its PEGY ended up being close to 3x (2.89x to be exact), still far 1x.
KO stock: Other risks and final thoughts
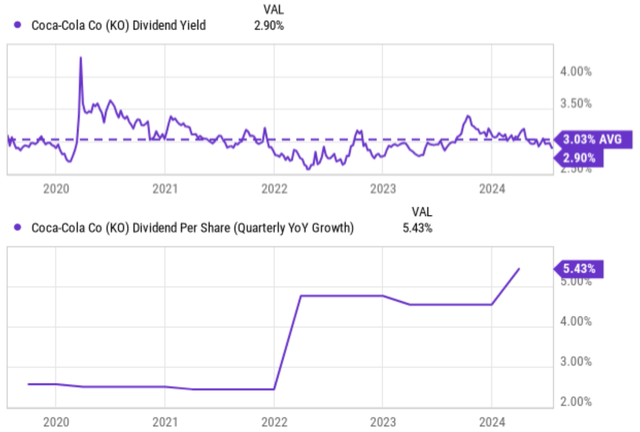
Given its dividend king status, the above valuation premium and limited growth are best reflected in its dividends in my view. More specifically, the chart below shows KO’s dividend yield (top panel) and dividend per share growth (bottom panel) in the past 5 years. As seen, the current dividend yield of 2.9% is slightly below the 5-year average of 3.03%, an indication of a valuation premium. Dividend per share has been growing at about 2.5% only between 2020 and 2022. The rates have accelerated to about 5% on average in the past ~2 years, consistent with the above EPS projection of around 5%.
Other downside risks include currency exchange rate uncertainties. As aforementioned, given the company’s global reach and the intense inflation in several of its markets, unfavorable currency exchange rates can turn into sizable profit headwinds. For FY 2024, the company mentioned a 5% to 6% currency headwind in the ER for comparable net revenues on a non-GAAP basis.
A final item worth mentioning is tax. The ER mentioned that KO expects its underlying effective tax rate to be 19.0% for FY 2024. This is consistent with its effective tax rates recently. However, this year, KO has an ongoing tax litigation with the U.S. IRS (Internal Revenue Service). Its tax obligation is therefore uncertain and hinges on the outcome of the litigation.
All told, my verdict is that The Coca-Cola Company Q2 earnings are overall positive. It showcases KO’s role as a cornerstone for income-oriented accounts to generate sizable current income with a relatively low beta amid various market conditions. Growth-oriented investors should look elsewhere, given the limited EPS growth potential and high PEG or PEGY ratio. But for more conservative investors, I see a well-rounded package here, a combination of healthy margin, consistent growth, and reasonable total return potential.
Analyst’s Disclosure: I/we have no stock, option or similar derivative position in any of the companies mentioned, and no plans to initiate any such positions within the next 72 hours. I wrote this article myself, and it expresses my own opinions. I am not receiving compensation for it (other than from Seeking Alpha). I have no business relationship with any company whose stock is mentioned in this article.
Seeking Alpha’s Disclosure: Past performance is no guarantee of future results. No recommendation or advice is being given as to whether any investment is suitable for a particular investor. Any views or opinions expressed above may not reflect those of Seeking Alpha as a whole. Seeking Alpha is not a licensed securities dealer, broker or US investment adviser or investment bank. Our analysts are third party authors that include both professional investors and individual investors who may not be licensed or certified by any institute or regulatory body.
As you can tell, our core style is to provide actionable and unambiguous ideas from our independent research. If your share this investment style, check out Envision Early Retirement. It provides at least 1x in-depth articles per week on such ideas.
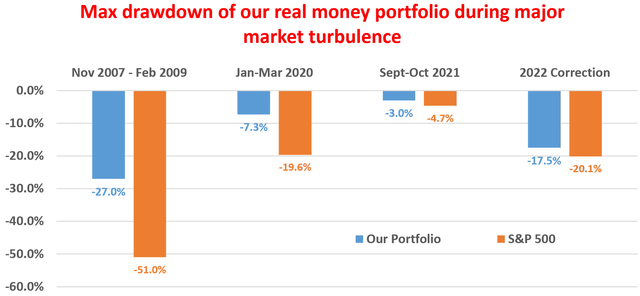
We have helped our members not only to beat S&P 500 but also avoid heavy drawdowns despite the extreme volatilities in BOTH the equity AND bond market.
Join for a 100% Risk-Free trial and see if our proven method can help you too.
