Summary:
- Exxon Mobil Corporation stock delivered strong Q2 earnings, beating consensus estimates on both lines.
- In particular, the progress and benefits from the Pioneer assets integration far exceeded my earlier expectations.
- The Pioneer acquisition boosts Q2 production to record levels, and I also expect it to lower breakeven costs.
- Combined with other catalysts, I see good odds for its share price to reach $174 in the next 1–2 years.
CHUNYIP WONG
XOM stock: Q2 recap
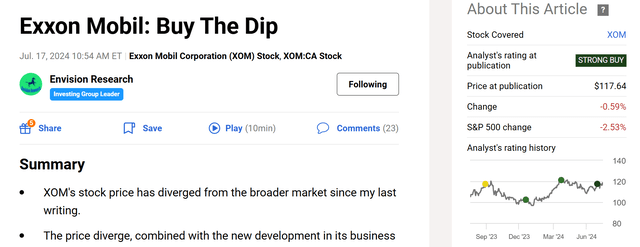
I last analyzed Exxon Mobil Corporation (NYSE:XOM) stock in mid-July. As you can see from the following screenshot, that article was titled “Exxon Mobil: Buy The Dip” and was published by Seeking Alpha on July 17, 2024. In that article, I argued for a Strong Buy rating based on the following two factors:
- Price divergence. XOM’s stock price has diverged from the broader market since my last writing. The price divergence, combined with the new development in its business fundamentals, has made XOM an even stronger buy.
- Margin recovery and the acquisition of Pioneer assets. Besides my outlook for higher oil prices, I also see several key catalysts afoot that are more specific to XOM. The top two are XOM’s margin recovery and the acquisition of the Pioneer assets. The acquisition boasts some of the lowest breakeven costs and could double XOM’s throughput in that region.
Since that article, XOM has reported its 2024 Q2 earnings report (“ER”). The ER provided some key updates on its financials and business operations, motivating this follow-up analysis. In particular, 2024 Q2 is also the first quarter that the impacts from the Pioneer acquisition have been included in its financial results. Therefore, in this follow-up analysis, I want to place a focus on this acquisition. You will see that my results point to more upside potential for its stock prices thanks to the productivity boost and relatively compressed valuation multiples.
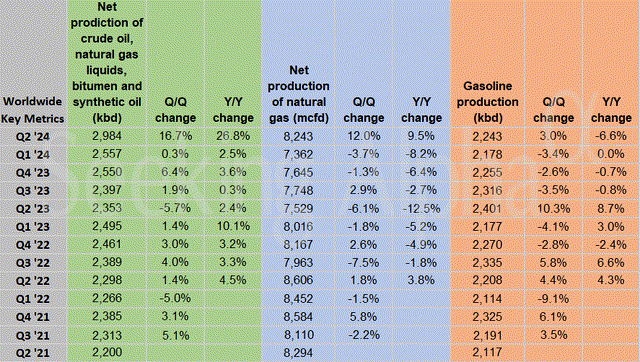
Overall, XOM delivered a strong Q2 and beat consensus estimates on both lines. Its Non-GAAP EPS dialed in at $2.14, beating consensus estimates by $0.13. Revenue totaled $93.06B, beating consensus estimates by $3.38B. More importantly, the Pioneer integration progressed better than expected. The Pioneer assets contributed $0.5B to earnings in the short first two months after the acquisition was closed and boosted production to a record level. As illustrated by the chart below, Q2’s production set a record level of $2.98 kbd, translating into a growth rate of 16.7% QoQ and 26.8% YoY.
Next, I will further elaborate on the potential impacts of this acquisition.
XOM stock: Pioneer acquisition in focus
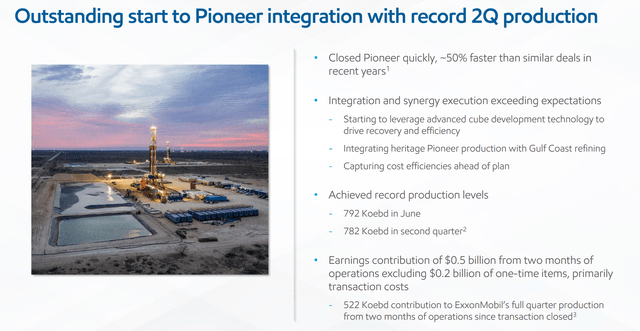
As argued in my earlier article, I view the Pioneer acquisition as highly accretive and synthetic to XOM’s existing operations. However, I cautioned readers about the potential speed bumps given the magnitude and complexity of the integration. The Q2 ER really surprised me by the speed and effectiveness of the integration process. The acquisition is indeed highly synergistic. As illustrated by the ER slide below, it already started to leverage advanced cube development technology to drive recovery and efficiency and to integrate the Pioneer production with Gulf Coast refining. The deal closed ~50% faster than similar deals recently, and already the company is capturing cost efficiencies ahead of plan.
In terms of throughput, as aforementioned, the Pioneer assets boosted XOM’s global production in Q2 to a record level. Specific to crude oil output, the production ramped up to 2.98M bbl/day in Q2. To provide a broader context, XOM has been averaging 2.3M bbl/day in the past 3 years before the acquisition.
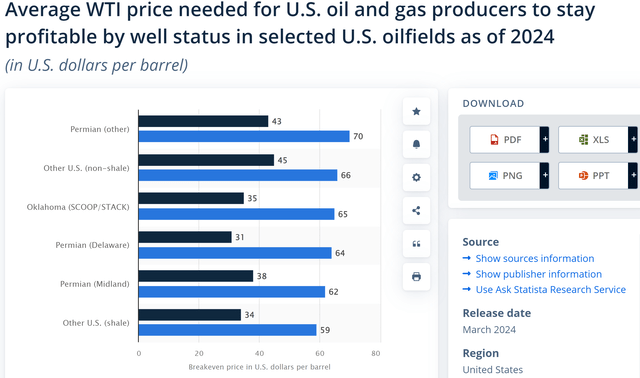
Moreover, the acquired assets feature some of the most lucrative break-even production costs in the industry (at least among U.S. oil-producing assets). When CAPEX investment and depreciation are considered part of the break-even costs, my guesstimate for XOM’s breakeven cost is around $45 recently. And as illustrated by the next chart below, the breakeven costs are only in the range of 31 to 34 dollars per barrel for the Permian region.
I expect the above production boost and cost advantage to translate directly into an EPS boost. As a projection, the table below displays my forecast of the impact on XOM’s EPS. In this forecast, I used the parameters mentioned above and further assumed A) an oil price of $75 (the current price as of this writing) and B) the number of shares outstanding to remain constant at the current level of ~4.2 billion (on a fully diluted basis). With these inputs, every $1 increase in oil price would lead to an addition of $0.26 to XOM’s EPS with the acquired assets, compared to $0.20 before.
Next, I will analyze what such an EPS boost means for its potential returns.
XOM stock: Return projections
The chart below summarizes XOM stock’s valuation grade. As seen, the shares currently trade at a P/E ratio (based on forward and non-GAAP earnings) of 13.35x. The multiple is at a noticeable discount from its historical average. For example, compared to its 5-year average P/E is 15.14, the current multiple is at a ~12% discount.
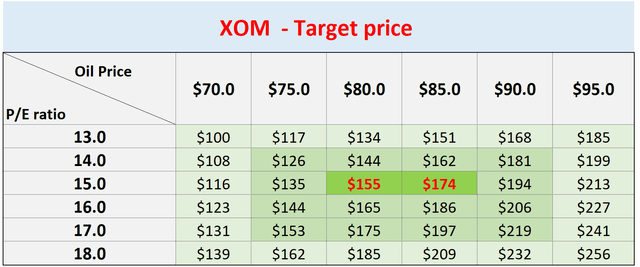
The combination of valuation discount and EPS growth creates a very favorable return profile. My return projections (shown in the chart below) point to a target price of up to $174 in the next 1~2 years. In this projection, I explored the impacts of different combinations of oil prices and P/E multiples in the next 1 year or so. The impact of oil prices on its EPS was based on the results presented earlier (i.e., every dollar of oil price increase translated into a $0.26 EPS boost). And the cells highlighted in red are what I view as the most probable scenarios based on the company’s historical P/E and my outlook for oil prices (detailed in my earlier article).
Other risks and final thoughts
In terms of downside risks, XOM entails a common set of risks generic to the oil industry. These risks include oil price volatilities (which are ultimately unpredictable), natural gas price volatilities (which are even more extreme than oil price volatilities), regulatory risks, etc. Here, I want to point out two risks that are more specific to the approach that I used in this analysis. First, other oil majors such as CVX and OXY also have large-scale acquisitions ongoing. For example, Chevron Corporation (CVX) is closing on its Hess Corporation (HES) acquisition. Occidental Petroleum Corporation (OXY) is also acquiring CrownRock and the acquisition will strengthen its U.S. production with the acquired Premier Permian Basin Assets. With these large-scale acquisitions afoot, XOM’s key rivals are also well-positioned to boost their productivity at more competitive break-even prices. The moves from its overseas competitors create another source of uncertainties. Notably, OPEC+ recently announced extended oil production cuts (see the following Reuters news for more details, emphasis added). New developments in the OPEC+ countries (and other oil-producing countries/regions) could diminish the competitive advantage XOM has gained from the acquired assets.
LONDON/DUBAI, June 2 (Reuters) – OPEC+ agreed on Sunday to extend most of its deep oil output cuts well into 2025 as the group seeks to shore up the market amid tepid demand growth, high interest rates, and rising rival U.S. production… OPEC+ members are currently cutting output by a total of 5.86 million barrels per day (bpd), or about 5.7% of global demand. On Sunday, OPEC+ agreed to extend the cuts of 3.66 million bpd by a year until the end of 2025 and prolong the cuts of 2.2 million bpd by three months until the end of September 2024…
All told, I see a highly skewed return/risk profile, judging by the financials and business progress presented in the Q2 ER. In particular, the integration of the Pioneer assets progressed far quicker and better than I expected earlier. Looking ahead, I expected the assets to boost production, lower break-even costs, and contribute materially to its EPS. When combined with the potential of an upward oil price and P/E swing, I see good odds for its share prices to advance to $174 in the next 1-2 years.
Analyst’s Disclosure: I/we have a beneficial long position in the shares of CVX either through stock ownership, options, or other derivatives. I wrote this article myself, and it expresses my own opinions. I am not receiving compensation for it (other than from Seeking Alpha). I have no business relationship with any company whose stock is mentioned in this article.
Seeking Alpha’s Disclosure: Past performance is no guarantee of future results. No recommendation or advice is being given as to whether any investment is suitable for a particular investor. Any views or opinions expressed above may not reflect those of Seeking Alpha as a whole. Seeking Alpha is not a licensed securities dealer, broker or US investment adviser or investment bank. Our analysts are third party authors that include both professional investors and individual investors who may not be licensed or certified by any institute or regulatory body.
As you can tell, our core style is to provide actionable and unambiguous ideas from our independent research. If your share this investment style, check out Envision Early Retirement. It provides at least 1x in-depth articles per week on such ideas.
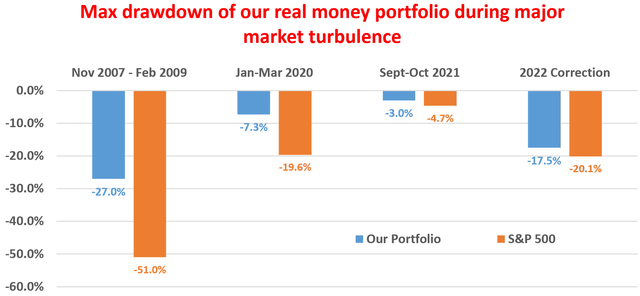
We have helped our members not only to beat S&P 500 but also avoid heavy drawdowns despite the extreme volatilities in BOTH the equity AND bond market.
Join for a 100% Risk-Free trial and see if our proven method can help you too.
