
Summary:
- Berkshire Hathaway continues to liquidate its Apple holdings, selling around 390 million shares in Q2, while boosting cash holdings to a record $276 billion.
- I believe Warren Buffett’s concerns include Apple’s China supply chain, the strong possibility of rising capital gains tax rates, and the odds of slower consumer spending in a global recession.
- Extremely weak free cash flow and dividend yields vs. high cash-investment rates of return are perhaps the main reasons to liquidate Apple’s slow-growth future.
- A rare EMV indicator downturn in July has forced me to downgrade Apple to Strong Sell for a 12-month outlook.
JohanSjolander
It was announced this weekend that Berkshire Hathaway Inc. (BRK.A) (BRK.B) continues to liquidate its massive Apple Inc. (NASDAQ:AAPL) holdings, likely as fast as it can without torpedoing the share quote. The Q2 2024 report’s highlight was the selling of around 390 million shares in perhaps the leading Big Tech name in the world, or about 50% of his position between March and June. In the process, Berkshire has spiked its cash holdings to a record, at an amazing amount of $276 billion!
Is CEO Warren Buffett worried about Apple’s China-focused supply chain as tensions with the U.S. soar? Possibly. Is he concerned about capital gains tax rates rising next year, to help slash the out-of-control U.S. fiscal deficit? He’s said as much, in my view. Is he looking forward to slower consumer spending in a global recession, and its negative effect on Apple’s operating results? Possibly. Is he worried that a $3 trillion company can no longer compound money at an above-average rate because of its sheer size? More than likely.
Yet, the #1 reason to be selling Apple now, in my opinion, may revolve around its clear overvaluation vs. past trading, and the structure of interest rates in the bond market. I have been screaming about this for over a year now in my previous articles on the stock. Owning an overpriced, slow-growth blue chip with interest rates in the 4% to 5% range makes little mathematical sense, even if it’s the Apple brand name.
Outside of founder Steve Jobs, Mr. Buffett has been perhaps the biggest Apple cheerleader over the company’s storied history. So, when his view sours, all Apple investors should take note. Is Mr. Buffett’s decision to sell shares for around $200 a warning signal to small retail investors? Absolutely.
The Overvaluation Problem
The primary valuation problem is barely growing free cash flow yields of 3%, which are a complete failure vs. 5% cash-investment returns in my view. Buffett began purchasing his position in 2016, when free cash flow yields of 11%+ were available vs. “risk-free” cash yields less than 2% (using prevailing 1-year Treasury rates), the opposite of today’s setup. In terms of buying a stock with a low valuation and selling it at a high one, Buffett’s trade may go down in history as “the” classic round-trip trade for its incredible dollar size, especially if Apple is sitting at the same quote as 2024’s high in 5-10 years (which I believe is entirely possible mathematically speaking).
YCharts – Apple, Free Cash Flow Yield vs. 1-Year Treasury Rate, Since 2000, Author Reference Points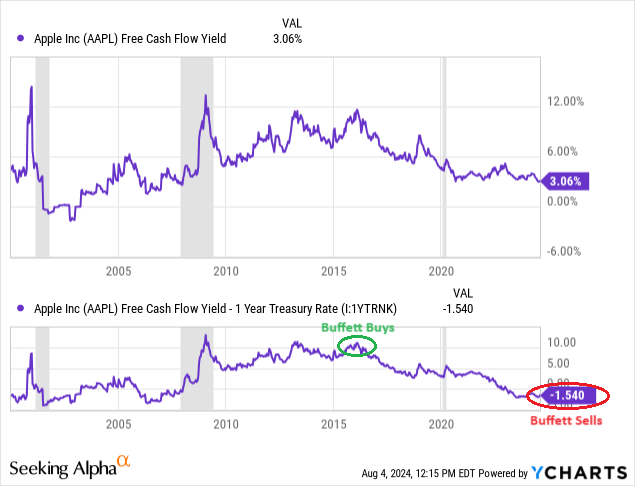
Further, when Berkshire acquired Apple shares, the annual cash dividend yield was 2.2%, about the same as the S&P 500 index average and considerably better than 1-year Treasury rates in 2016. The current dividend story of 0.44% vs. cash investments returning closer to 5% is a rotten idea to buy into, especially considering the equity price risk inherent in your decision (100% of your investment could theoretically be lost) vs. the all-but-guaranteed 100% return of your capital.
YCharts – Apple, Dividend Yield vs. S&P 500 ETF & 1-Year Treasury Rate, 10 Years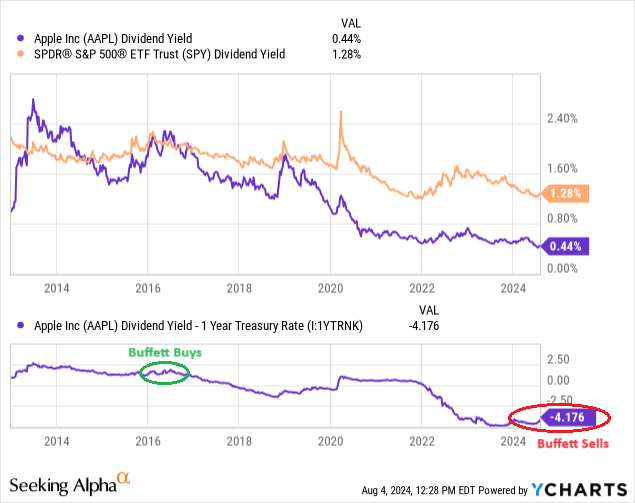
Anyway, Seeking Alpha’s computer-ranking system puts an overall “F” rating on Apple for a Quant Valuation Grade. When you go through all the fundamental metrics available to review the share’s price vs. underlying worth, there’s not much there to back up your investment. SA Quant’s formula looks at Apple’s 5-year trading history, plus current financial analysis ratios vs. peers/competitors in the technology industry.
Seeking Alpha Table – Apple, Quant Valuation Grade, August 2nd, 2024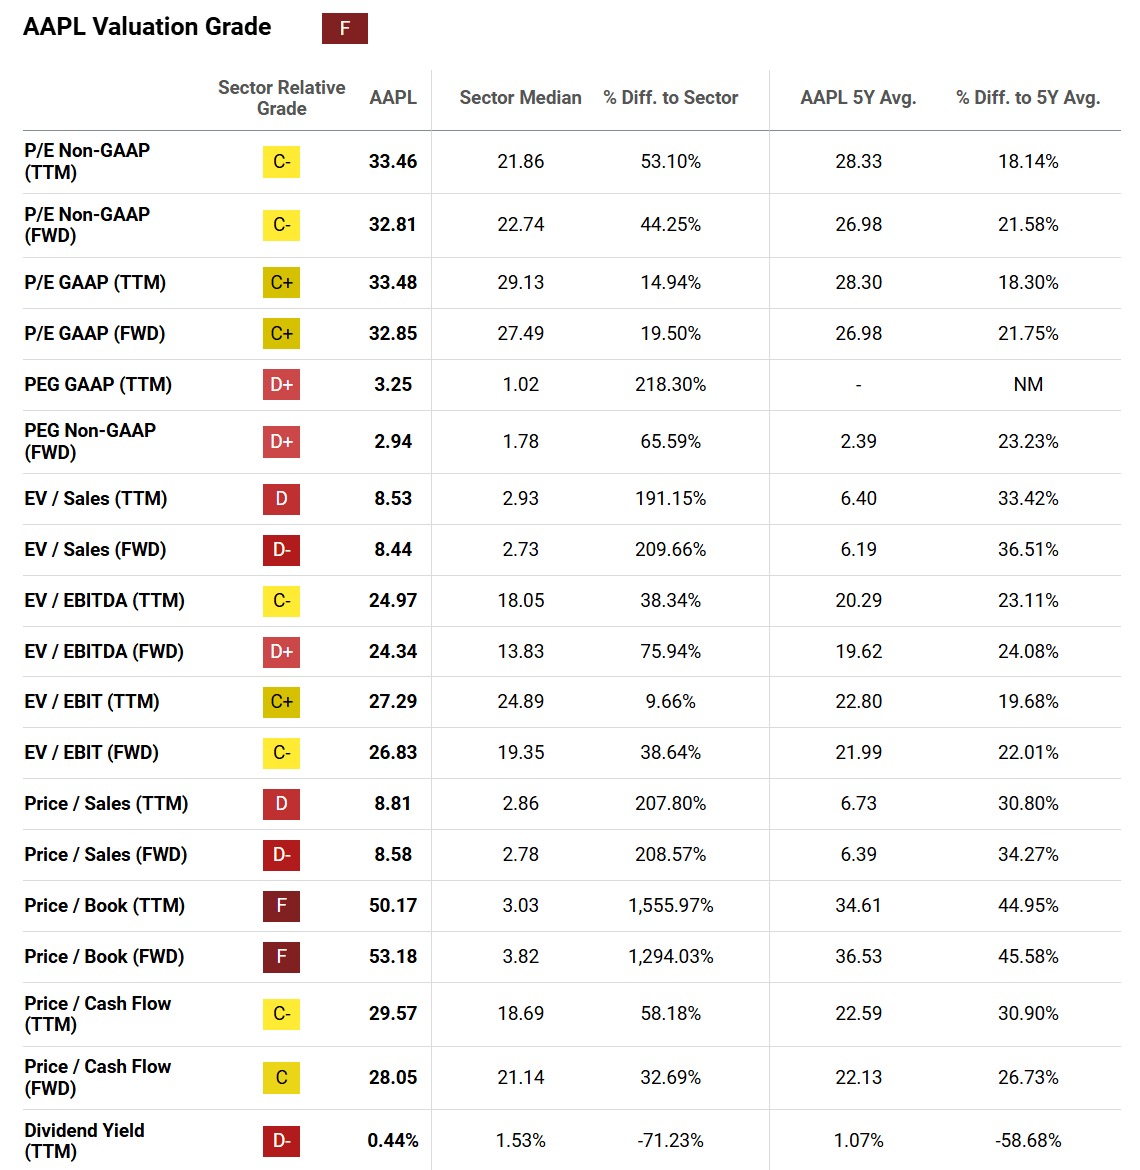
Technical Trading Reversal Underway
I was already quite nervous about Apple’s investment future, before Buffett announced he was selling months ago. That’s two strikes against this equity. The third strike has appeared since the end of July: numerous technical reversal signals have popped up as more evidence that something is amiss.
Sure, Apple has underperformed the NASDAQ 100 index for some time, as referenced in the comparison line vs. the Invesco QQQ Trust (QQQ) drawn below. After years of steady increases in the Accumulation/Distribution Line, Berkshire’s selling is clearly visible in the downtrending slope since February.
Perhaps most enlightening (and truly scary) as an immediate indicator issue for Apple shareholders is the new all-time low in the 14-day Ease of Movement calculation. In fact, moving from a record high three weeks ago to a record low over a relatively short period of time is rare (boxed in gold). It is usually associated with serious selling volumes vs. an absence of buying interest. When it’s “easy” to move the price lower, like in July, the EMV often screams that now is the time to sell.
Is my EMV signal foolproof and always correct for timing a sell? No. Sometimes price bottoms right after an EMV blowout decline and heads higher. Other circumstances, however, have proven its usefulness as a terrific timing device, predicting that far weaker quotes are coming over the next weeks, months, or even years.
StockCharts.com – Apple, 12 Months of Daily Price & Volume Changes, Author Reference Point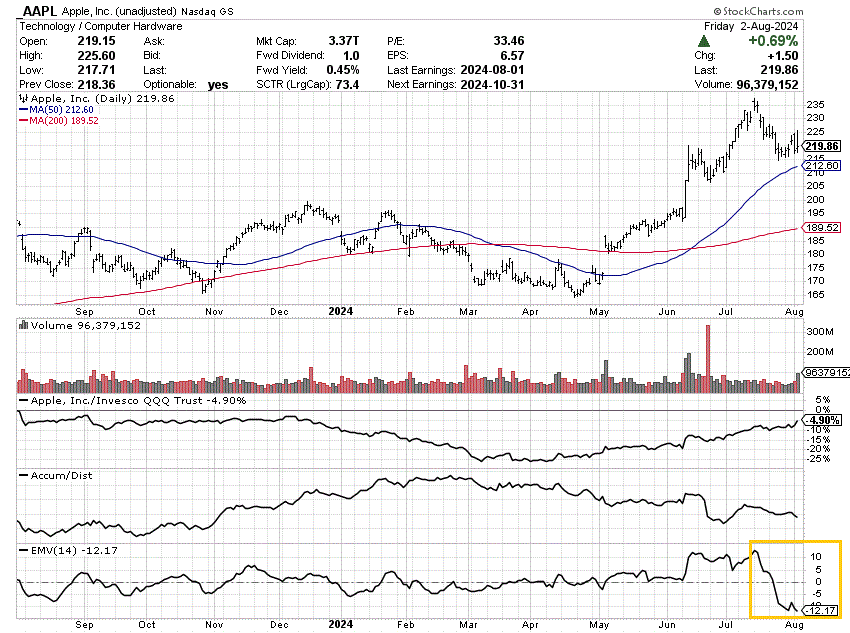
Let’s go through some historical Apple charts of how all-time lows in the 14-day EMV reading have fared in previous bear markets and recessions. In all honesty, I think Buffett may have been able to get out at peak pricing over the last several months.
2021-22
The last instance of two swings from record highs to lows (at that time) in the EMV came near Apple’s major top in late 2021, followed by another pivot to heavy selling in May 2022. Both are boxed in gold again below. Apple’s quote would end up declining by nearly -40% from its early January peak above $182 into January 2023.
StockCharts.com – Apple, Daily Price & Volume Changes, July 2021 to Jan 2023, Author Reference Points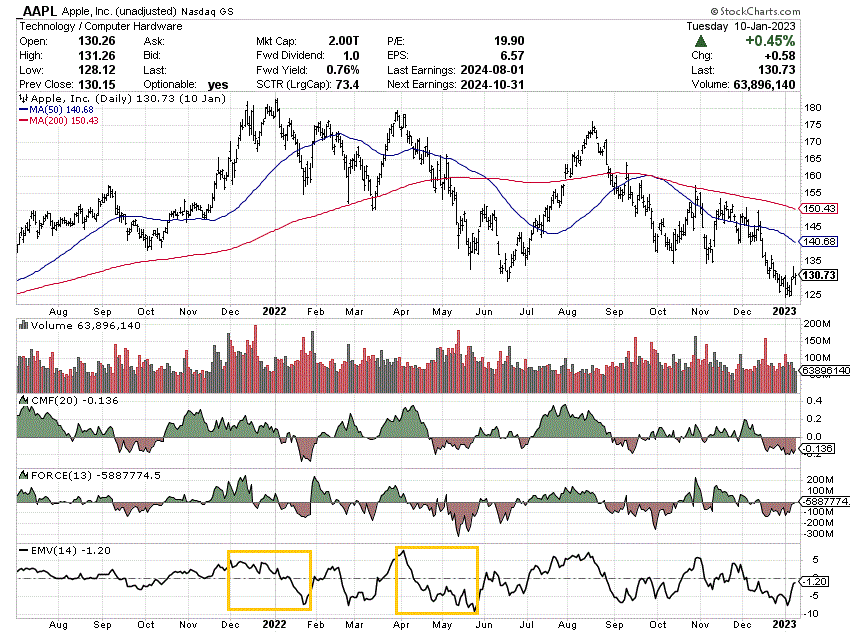
2020
Although short-lived for a selloff, the next signal came in the early days of the pandemic. Price would implode another -30% rapidly from the point of all-time lows (roughly -40% peak to trough), but recovered quickly.
StockCharts.com – Apple, Daily Price & Volume Changes, July 2019 to March 2020, Author Reference Point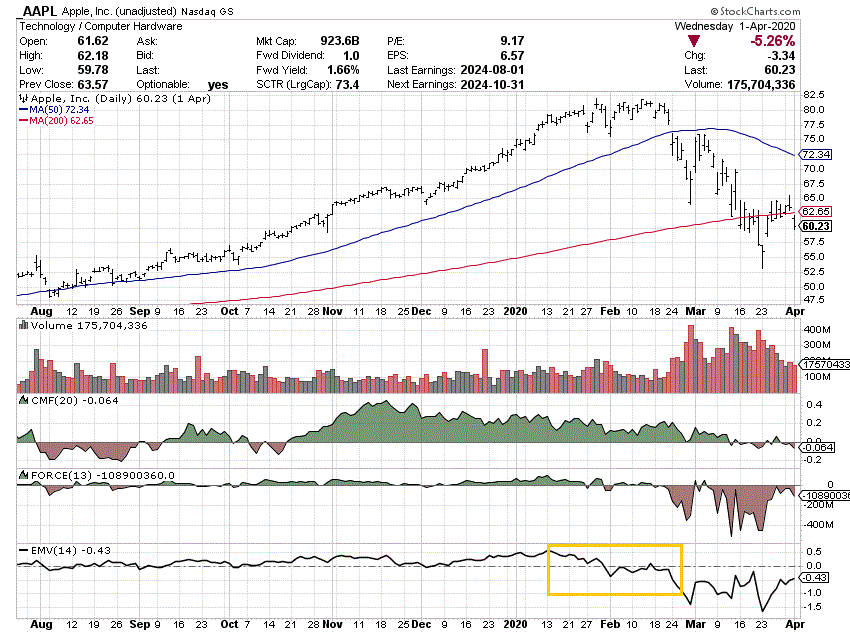
2018
Before that, 2018’s reversal proved to be another EMV signal winner for timing your sell. The phase change from greed to fear was quite pronounced in this early warning indicator. And, you could have gotten out before a -40% price implosion over 10 weeks.
StockCharts.com – Apple, Daily Price & Volume Changes, Sept 2017 to May 2019, Author Reference Point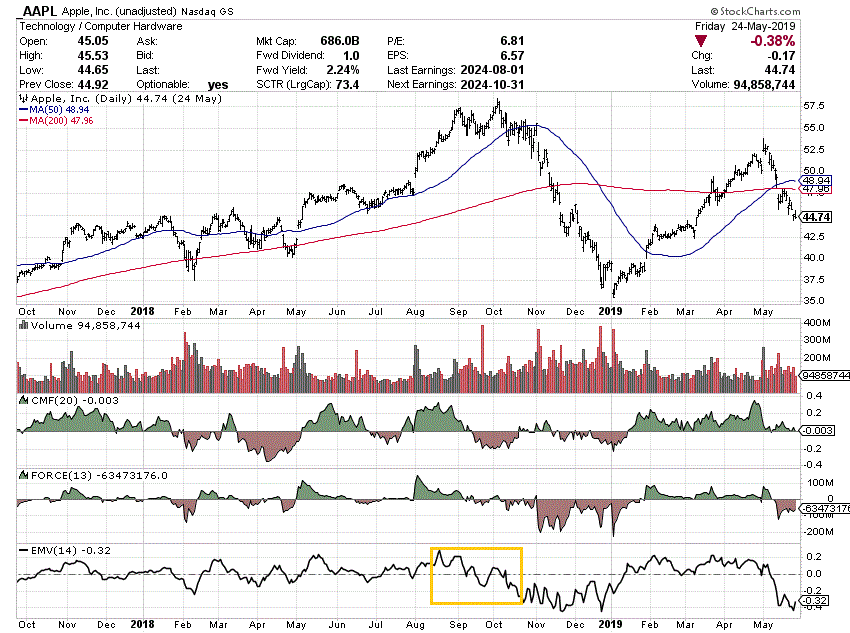
2007-08
How did the EMV construct do during the 2007-09 Great Recession period? Well, new all-time lows in the indicator are circled in gold below. The first signal proved a little early during August 2007 as Apple’s price continued another +35% higher. But a string of new lows were reached later that year and early 2008. Price would end up declining by -60% from its December 2007 peak, and -30% measured from the “first” signal into January 2009.
StockCharts.com – Apple, Daily Price & Volume Changes, Sept 2006 to Apr 2009, Author Reference Points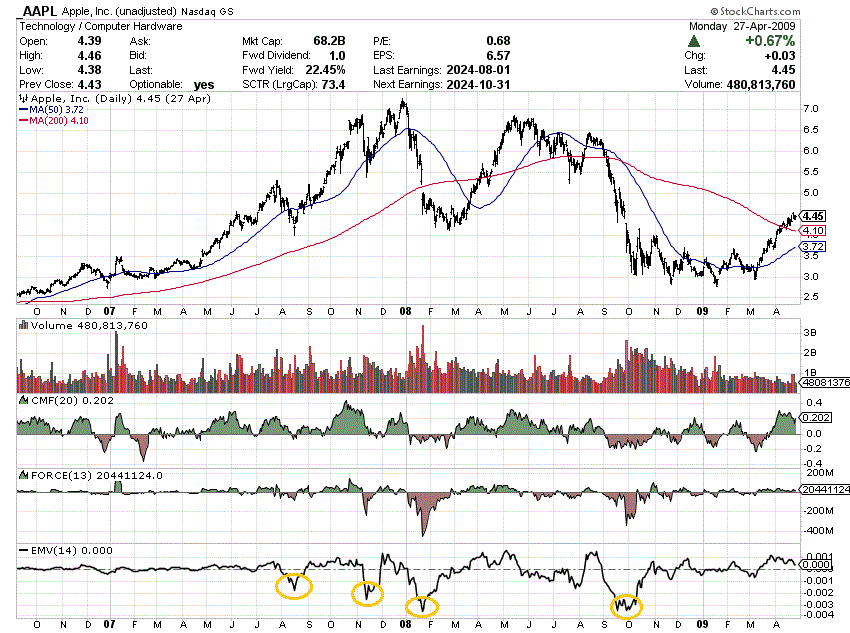
1999-2001
The original 1990s Dotcom bubble burst looked similar to the Great Recession EMV and price pattern from Apple. The first signal in December 1999 proved premature, while the second came right after its actual price peak, and the third warning appeared weeks before the bottom dropped out of its quote. From the March 2000 high, a total decline of -85% ran its course by December 2020. Afterward, the price failed to recover for years.
StockCharts.com – Apple, Daily Price & Volume Changes, Sept 1999 to Dec 2001, Author Reference Points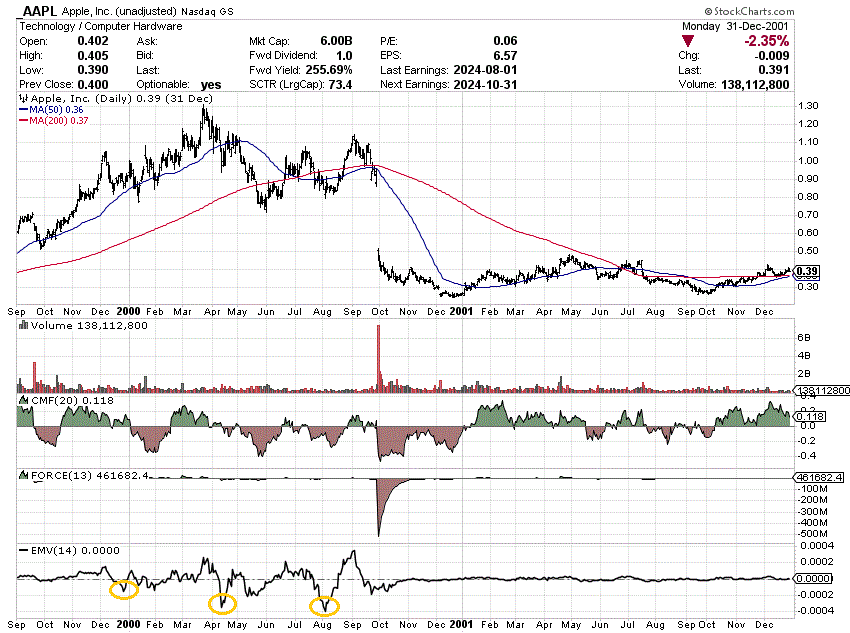
Final Thoughts
Operating business growth has already been subpar vs. the Big Tech group since 2021. Analyst estimates are upbeat for 2024-26, but forecasted rates of increase are still a far cry from past growth rates or those projected from the NASDAQ 100 index as a whole.
Seeking Alpha Table – Apple, Analyst Estimates for 2024-26, Made August 2nd, 2024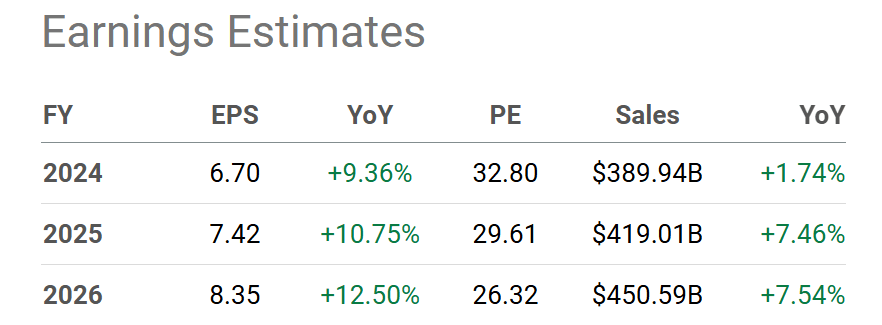
So, it seems to me that Buffett has decided to cash-in his chips at a high price, which, I believe, is the only viable risk/reward option. Heck, Berkshire can earn dramatically more in interest on cash, with a nearly “risk-free” guaranteed return of his upfront capital. My question is: Why are you holding or buying Apple at prices over $200 per share?
It appears to me that insiders and management cannot find enough good reasons to purchase Apple at its lofty valuation, either. In fact, there has only been one purchase vs. 34 sell trades over the last year reported to the SEC. A net of 2,314,118 shares have been “officially” sold, outside of Buffett’s rush to the exits.
Nasdaq.com – Apple, Insider Trading Activity, Past 12 Months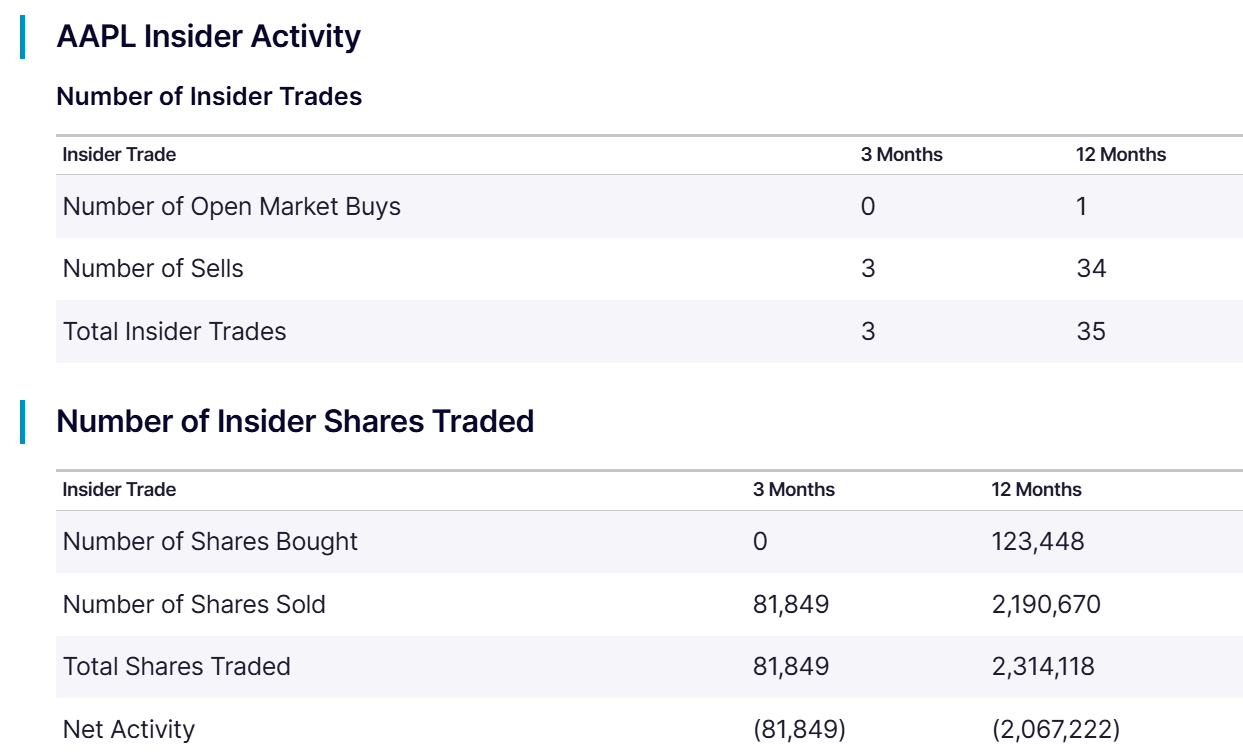
My view is prudent and reasonable investors should be waiting for materially lower prices to buy, and long-time shareholders should seriously contemplate moving on, just as Berkshire is doing. I believe a -20% to -50% price dump could be on the cards, with the worst returns experienced in a recession that sends sales and EPS lower at Apple, not higher. Don’t say it can’t happen. Oversized Apple share price declines have routinely taken place over the decades.
What could keep the price above $200 a share? No doubt, this is a great question. The answer is a “Goldilocks” economy, enjoying a steep slide in interest rates and inflation, matched against rising consumer spending. This soft-landing scenario is still the conventional wisdom expectation on Wall Street. I am not saying such an event will not occur.
It is also possible the EMV sell signal is premature, just like in late 1999 or the middle of 2007. I would place the statistical odds of this being the case at 25% to 33%.
However, if any new “black swan” sell catalyst shows up, a hard landing with potentially a deep recession could be on tap during 2025. For example, what if crude oil prices double to US$150 a barrel soon due to the Middle East trouble spilling over into military conflict in the critical shipping lanes of the Persian Gulf? Then, inflation and interest rates will almost surely rise, while the struggling economy is literally pushed into contraction. Under this scenario, an Apple share quote of $100-$125 is entirely likely. (A normalized P/E of 20x EPS declining to $6 would seem appropriate, if interest rates do not come down in lockstep with a rotten economy). It would be the dreaded double-whammy of falling valuation ratios on materially lower sales and earnings.
With the bad news piling up, I have decided to downgrade Apple to Strong Sell for a 12-month outlook. Even Warren Buffett, considered one of the all-time best investment minds, seems to agree that now is the time to exit this security.
Thanks for reading. Please consider this article a first step in your due diligence process. Consulting with a registered and experienced investment advisor is recommended before making any trade.
Analyst’s Disclosure: I/we have no stock, option or similar derivative position in any of the companies mentioned, and no plans to initiate any such positions within the next 72 hours. I wrote this article myself, and it expresses my own opinions. I am not receiving compensation for it (other than from Seeking Alpha). I have no business relationship with any company whose stock is mentioned in this article.
I am effectively short Apple through bearish positioning in NASDAQ 100 and S&P 500 derivatives. This writing is for educational and informational purposes only. All opinions expressed herein are not investment recommendations and are not meant to be relied upon in investment decisions. The author is not acting in an investment advisor capacity and is not a registered investment advisor. The author recommends investors consult a qualified investment advisor before making any trade. Any projections, market outlooks, or estimates herein are forward-looking statements based upon certain assumptions that should not be construed as indicative of actual events that will occur. This article is not an investment research report, but an opinion written at a point in time. The author's opinions expressed herein address only a small cross-section of data related to an investment in securities mentioned. Any analysis presented is based on incomplete information and is limited in scope and accuracy. The information and data in this article are obtained from sources believed to be reliable, but their accuracy and completeness are not guaranteed. The author expressly disclaims all liability for errors and omissions in the service and for the use or interpretation by others of information contained herein. Any and all opinions, estimates, and conclusions are based on the author's best judgment at the time of publication and are subject to change without notice. The author undertakes no obligation to correct, update or revise the information in this document or to otherwise provide any additional materials. Past performance is no guarantee of future returns.
Seeking Alpha’s Disclosure: Past performance is no guarantee of future results. No recommendation or advice is being given as to whether any investment is suitable for a particular investor. Any views or opinions expressed above may not reflect those of Seeking Alpha as a whole. Seeking Alpha is not a licensed securities dealer, broker or US investment adviser or investment bank. Our analysts are third party authors that include both professional investors and individual investors who may not be licensed or certified by any institute or regulatory body.