Summary:
- Ford Motor Company’s stock has shed value amid rising macroeconomic headwinds, a heavy second-quarter earnings miss, and a questionable July sales report.
- Although macroeconomic headwinds might continue, an argument exists that Ford’s bad news is priced in.
- Strong growth in the firm’s EV segment and possible input cost-cutting prospects might cushion against top-line pressure.
- Our dividend discount model suggests the Company is about 70% undervalued. Moreover, the stock has a dividend yield of 7%+ and seems cyclically underpriced.
- Although a 70% gain is highly unlikely, F stock seems undervalued, and buying into weakness could be a solid strategy.
overcrew
We turn to Ford Motor Company (NYSE:F) in today’s analysis. Ford and its peers have experienced turbulent times lately due to rising economic uncertainty and a volatile financial market environment. Consequently, Ford’s stock has shed more than 15% of its value in the past six months.
F Stock and Peer Performance (Seeking Alpha)
We last covered Ford in April 2023, when we assigned a bullish rating to its stock based on its valuation attributes. Since then, the stock has shed about 15% of its value, providing an opportunity to revisit our thesis.
Herewith is our latest take.
Recent Performance
Ford’s stock has slipped by over 22% year-over-year. However, some of its losses were shielded by dividends, leading to a total return loss of just over 17%.
Aside: Losses recorded at close on 02/08.
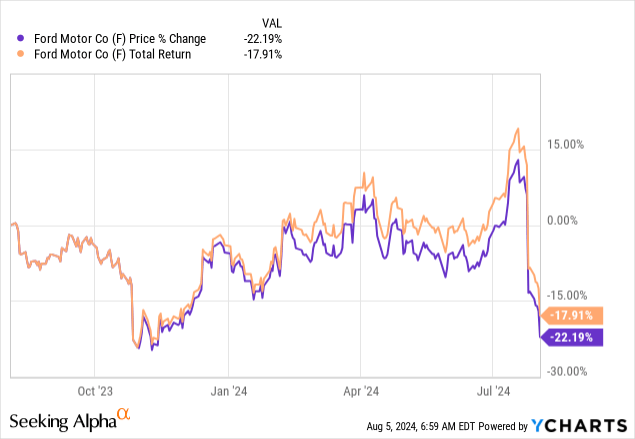
Looking at Ford’s return distribution, it’s evident that the market lost belief in the stock around late July. Although other factors contributed, Ford’s demise was due to a contemporaneous drawdown in the broader market. Moreover, Ford missed its second-quarter earnings target, concurrently revealing an $800 million spike in warranty costs.
As if the abovementioned factors weren’t enough, on Friday, August 2nd, Ford revealed a suboptimal July sales report, with total sales dropping by 20 basis points year-on-year. The event led to further decay in Ford’s stock price during pre-market trading on Monday, leaving many investors worried.
F Stock Pre Market (Seeking Alpha)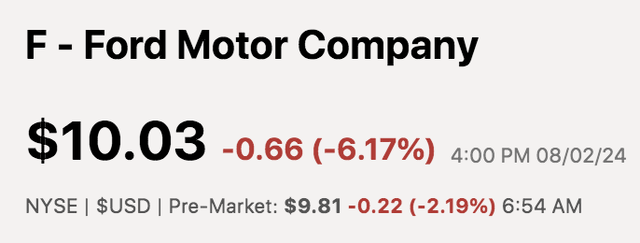
July Sales Report
Ford released its July sales report at the end of last week, revealing lower broad-based year-over-year numbers. Yet, a few positives occurred. Firstly, Ford’s EV and hybrid vehicle numbers increased by 31.2% and 47% apiece, showing that the firm’s renewed growth pockets are intact. Moreover, despite showing slower year-over-year sales, Ford’s net year-to-date sales increased by 3.1%.
U.S. July Sales Report (Ford Motor)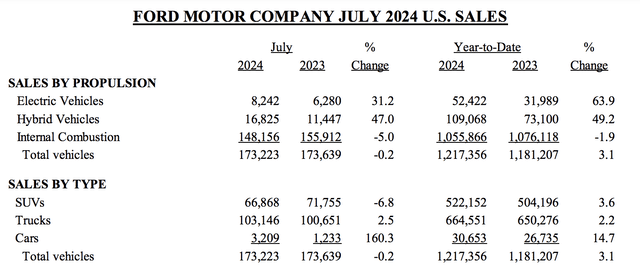
Our Take
I’m going to start by discussing top-down factors, as Ford is a cyclical company, after all.
In a recent event, Goldman Sachs (GS) raised its recession probability to 25% from 15%. It’s easy to see why, as unemployment is rising, consumer sentiment is waning, and business confidence is dropping.
Furthermore, inflation is cooling, which has led to talks of an interest rate pivot. For those unaware, an initial decline in interest rates usually occurs due to a slowing economy, especially when the parameters supporting the pivot are unstable. Additionally, a spike in credit risk generally occurs upon an interest rate pivot, concurrently exacerbating the market’s credit risk premiums.
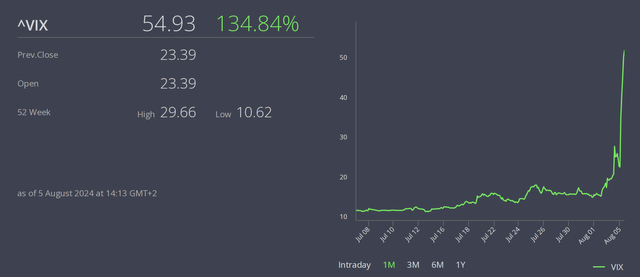
The macro factors I’ve just mentioned are reflected in the CBOE volatility index, also known as the VIX or fear index. The index surged on Monday morning, suggesting investors anticipate significant volatility (stocks and the VIX are usually inversely related).
Why did I just mention all of that?
I reiterate that Ford is a cyclical company that sells durable goods. Therefore, monitoring its risk in relation to the economic cycle is salient. I would take it a step further and argue the same for the rest of its sales regions, especially China, which is facing a minor banking crisis, downward revisions in GDP growth, and deflation.
Ford Wholesale Sales By Country FY 23 (Statista)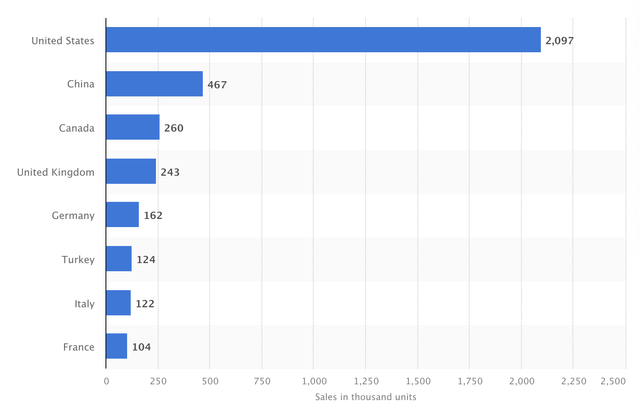
Having said all of that, a few positives are brewing.
Firstly, the company has announced exciting new models for 2025, including the 2025 Maverick and 2025 Mustang. Additionally, as previously mentioned, Ford’s existing EV line is popular, with the segment growing illustriously despite waning consumer sentiment. We anticipate systemic EV uptake to resume, with cash-heavy companies like Ford being front-and-center to benefit from it.
Furthermore, Ford’s entry into EVs, expansion of its credit segment (discussed later), and growing geographical diversification provide it with revenue-smoothing benefits. This means it can reduce its volatility throughout the sales cycle, making it less susceptible to point-in-time economic cycles.
Financials & Efficiency
Income Statement
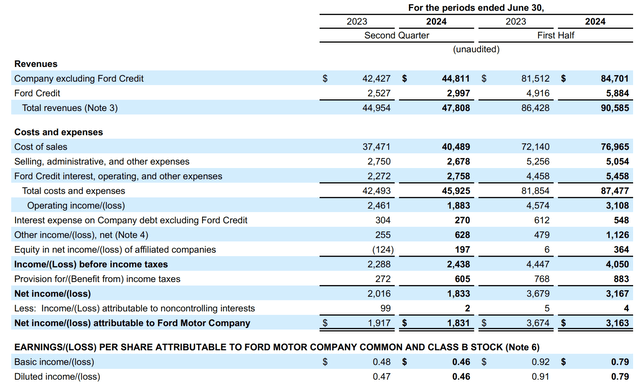
The following diagram shows Ford’s quarterly income statement; a discussion follows.
The big story of Ford’s second quarter was its warranty costs. The firm spent $2.3 billion in warranty and recall costs during the quarter, which is significant, considering it amounted to about 5.1% of the company’s quarterly revenue. This is turning into a recurring issue for Ford, one which investors will keep a close eye on from here on in.
Ford’s top-line revenue grew year-over-year. However, its operating costs caught up, driving the firm’s operating profit margin down to around 4.2%.
We think lower material and transport costs might decrease the company’s cost of sales in late 2024 and early 2025. Furthermore, rising U.S. unemployment introduces a softer labor market and potential SG & A cost-cutting.
GSCI Commodity Index (Trading Economics)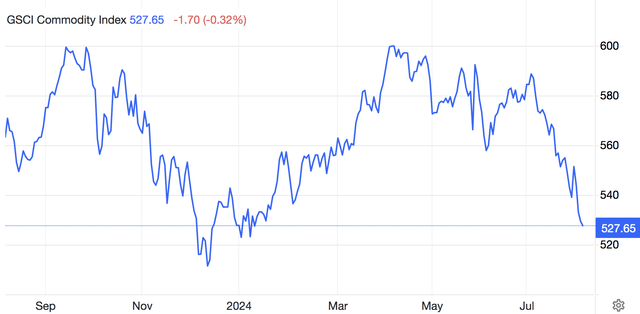
Although we are confident about lower input costs, we are unsure about Ford’s near-term revenue prospects. I touched on sales in the previous section. However, I failed to mention that lower inflation/stagflation might lead to lower nominal sales, which is a noteworthy consideration.
Balance Sheet
Considering the economic environment, glancing at Ford’s balance sheet metrics communicates a few matters worth worrying about. For example, the company has a debt-to-equity ratio of 3.5x while simultaneously possessing lean current and quick ratios. We outline this as a risk factor, especially if an extended economic drawdown had to occur.
Balance Sheet Metrics (Seeking Alpha)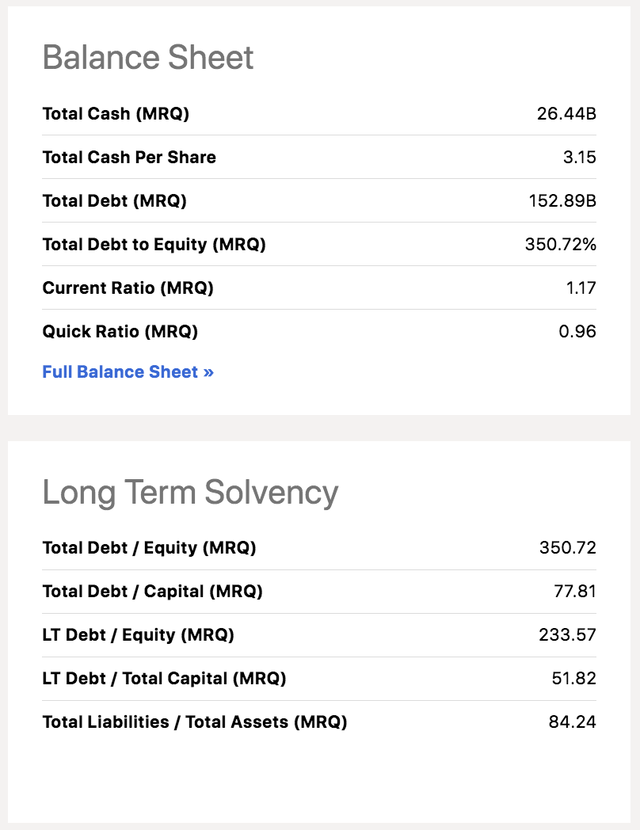
A closer look at Ford’s balance sheet line items doesn’t ring alarm bells. Given the current economic environment, we expected to see extended payables and/or higher receivables. However, that isn’t the case; Ford’s payables and receivables remain in line with last quarter’s.
In essence, we don’t see any material changes to worry about.
Assets & Liabilities (Ford Motor Company)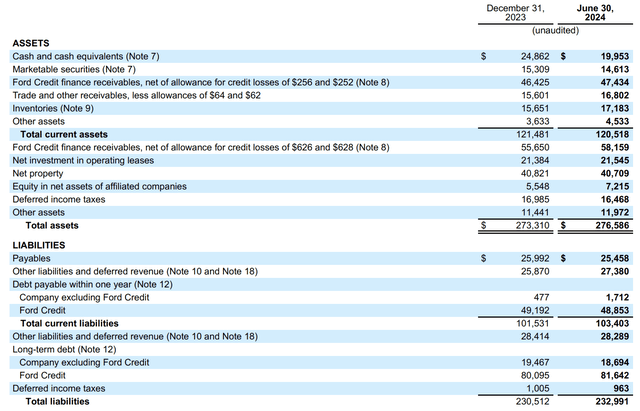
Credit Division
Ford’s credit division provided about 6.3% of its quarterly revenue in Q2 and assisted with synergies. Therefore, the analysis of the segment is justified.
Credit Segment (Ford Motor Company)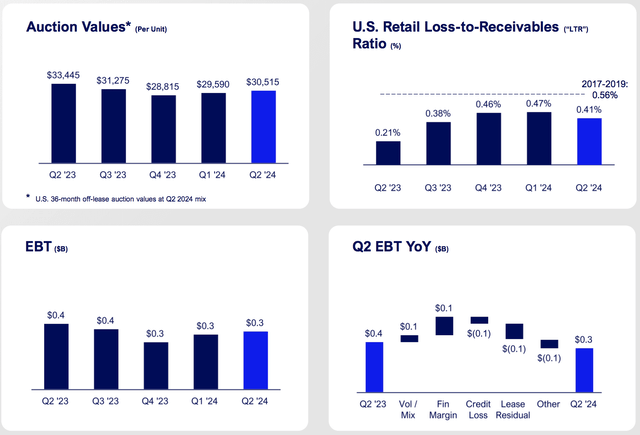
Ford says its credit segment’s FICO book has an average score of above 750. I don’t know whether that is true or not, but let’s give it the benefit of the doubt.
As shown in the earlier diagram, the segment’s loss-to-receivables ratio is trending down, and its earnings before tax margin is holding strong. Therefore, it is implied that Ford has benefitted from elevated interest rates and enhanced credit screening.
Despite the segment’s positive retrospective results, we fear the growing economic turmoil might result in rising credit risk and contemporaneously increasing defaults. The consequence could be higher provisions, increased receivables defaults, and lower loan origination volumes.
Valuation
Dividend Discount Model
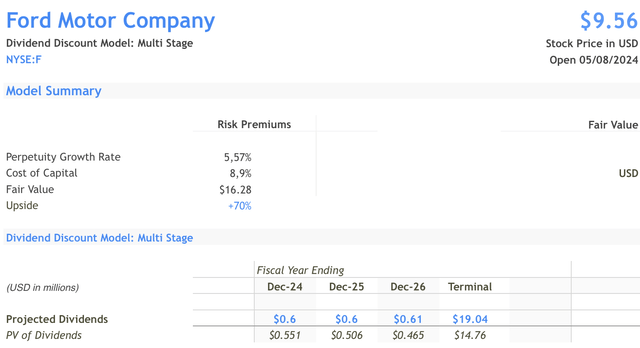
Ford is a regular dividend payer and a mature company, so we valued its stock using a multi-stage dividend discount model.
According to our calculations, Ford has a fair value of $16.28, providing about 70% upside potential. Although the DDM is merely a theoretical model, it provides valuable guideposts.
Herewith is a description of the model’s inputs.
- We calculated the perpetual growth rate by multiplying Ford’s ROE by its Dividend Retention Ratio.
- We used Alpha Spread’s CAPM for the cost of capital.
- Seeking Alpha’s database provided me with the necessary dividend forecasts.
Multiples
The number we got from the DDM was really high. Thus, we decided to look at a few price multiples to test my findings.
A bird’s-eye view of Ford’s price ratios shows that most of its salient price multiples are at normalized discounts, meaning they are below their five-year averages. In isolation, a normalized discount echoes the cyclical value. However, despite being optimistic about most of its multiples, we are concerned by Ford’s forward PEG ratio of 11.57x, which suggests that its EPS growth doesn’t justify its P/E. We’d like to see the value closer to 1x, especially for a cyclical stock like Ford.
F Valuation Multiples (Seeking Alpha)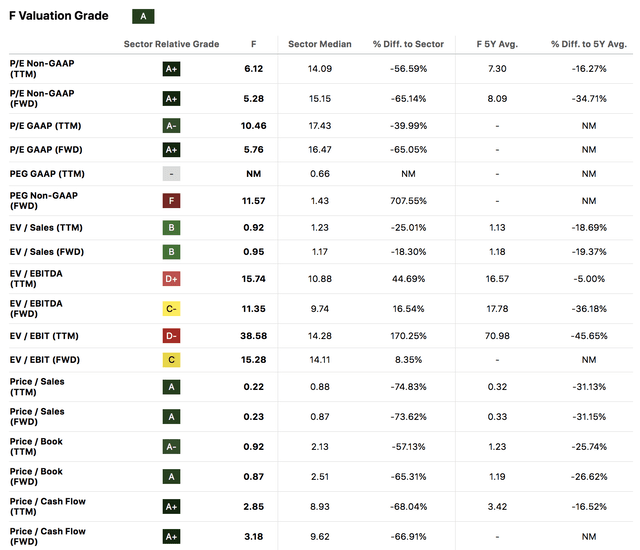
Dividends
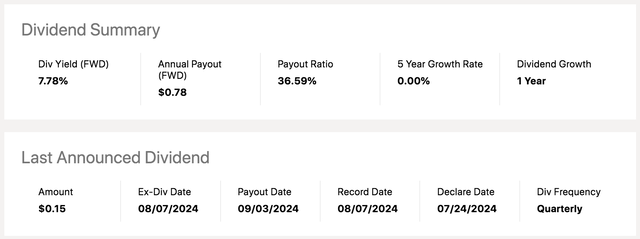
A look at Ford’s dividend is encouraging, as its stock’s drop has bolstered its forward dividend yield to 7.78%. However, I want to highlight that the stock’s dividend can be cyclical and even suspended, as was the case during the COVID-19 pandemic.
Conclusion
Our dividend discount model conveys that Ford’s stock is severely undervalued. Moreover, Ford’s price multiples suggest it is at a cyclical discount, while its forward dividend yield implies it is a best-in-class income-based stock.
Despite its noteworthy positives, Ford faces macroeconomic challenges in the U.S. and China. Moreover, investors seem worried about the company’s warranties and recall costs, which amounted to more than 5% of its second-quarter revenue. Furthermore, we think Ford’s balance sheet must be considered, as its debt levels and liquidity ratios are in unfavorable territory.
In essence, Ford’s key variables show that its prospects are juxtaposed. So, what’s our final call? We believe a soft buy rating is justified, as most of the bad news is likely priced in. Even though extended macroeconomic and fundamental implications can lead to further drawdowns, positives from EV growth and revenue diversification provide pushback. Although I concede that our valuation outlook for Ford is a tad ambitious, building up positions at its current lows might yield compelling long-term results.
Analyst’s Disclosure: I/we have no stock, option or similar derivative position in any of the companies mentioned, and no plans to initiate any such positions within the next 72 hours. I wrote this article myself, and it expresses my own opinions. I am not receiving compensation for it (other than from Seeking Alpha). I have no business relationship with any company whose stock is mentioned in this article.
Kindly note that our content on Seeking Alpha and other platforms doesn't constitute financial advice. Instead, we set the tone for a discussion panel among subscribers. As such, we encourage you to consult a registered financial advisor before committing capital to financial instruments.
Seeking Alpha’s Disclosure: Past performance is no guarantee of future results. No recommendation or advice is being given as to whether any investment is suitable for a particular investor. Any views or opinions expressed above may not reflect those of Seeking Alpha as a whole. Seeking Alpha is not a licensed securities dealer, broker or US investment adviser or investment bank. Our analysts are third party authors that include both professional investors and individual investors who may not be licensed or certified by any institute or regulatory body.

