Summary:
- Alphabet/Google continues to deliver record results each quarter, while the Tech Bust of 2022 has crushed the share quote.
- A 10-year low valuation and mean reversion action could send price 30% to 50% higher this year.
- The strongest balance sheet in corporate America and super-high profit margins are very desirable traits for long-term investors.
- Minor downside may play out for a few months, but I do not want to miss the boat on any big turn higher. I rate shares a Strong Buy.
SpVVK
My last article on search, streaming, and cloud giant Alphabet/Google (NASDAQ:GOOG) (NASDAQ:GOOGL), posted in July here, discussed its monster cash holdings and cash flow generation. Of course, the wicked 2022 technology selloff has taken down all related Big Tech names, regardless of long-term outlooks and projections. Shares have fallen another 20% since late summer, as bearish attitudes in the sector are now overwhelming all math and logic. To me, the buy proposition is even better than six months ago, and future upside (compounding potential) for investors continues to get brighter.
Today, I want to discuss the 10-year low valuation for Google. The good news is this lowball entry level for investors is still backed by the best balance sheet in the large-cap space on Wall Street. Additionally, tremendous profit margins are crossed with decent growth potential, despite an equity market capitalization above $1 trillion.
Its diversified business lineup has been created using the world’s leading search engine cash flow generation to fund new ventures. Another successful, high-growth monster has been developed through its YouTube media streaming division, as a second profit-center source of income rivaling Netflix (NFLX) and Disney (DIS) for online entertainment leadership. Plus, Google Cloud is now a top online storage and download service ranked next to the offerings of Amazon (AMZN), Microsoft (MSFT) and International Business Machines (IBM).
The diversification of business units and location of customers (53% outside America for fiscal 2022) provides layers of safety and stability for revenue and income as the U.S. economy slows down or enters recession this year.
Alphabet/Google 10-Q for September 2022 Alphabet/Google 10-Q for September 2022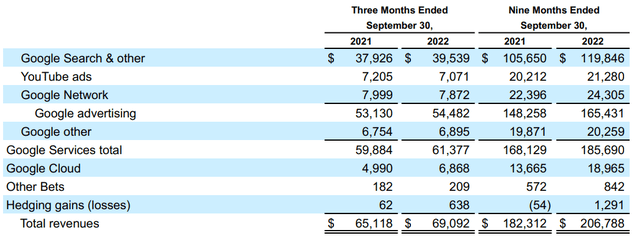

For sure, “the” strongest balance sheet in the major U.S. conglomerate sector is worth owning, especially if you can buy Google’s leading assets in the bargain bin. Below is a graph looking at cash and short-term investments of $116 billion at the end of September vs. total financial debt of just $13 billion.
YCharts – Alphabet/Google, Cash vs. Total Debt, 10 Years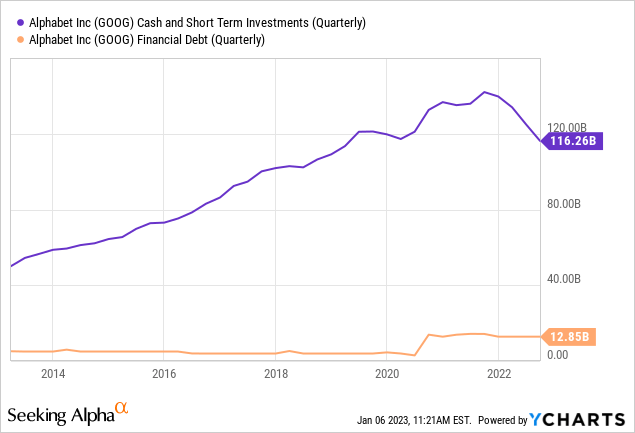
Compared to other Big Tech names plus leading healthcare, energy/oil, and diversified holding companies in the mega-capitalization space, Google stands out as the most conservative and financially flexible corporation of them all! The below sort list includes Meta Platforms (META), Apple (AAPL), Berkshire Hathaway (BRK.A) (BRK.B), NVIDIA (NVDA), Advanced Micro Devices (AMD), Intel (INTC), Tesla (TSLA), Johnson & Johnson (JNJ), Microsoft, Amazon, and Exxon Mobil (XOM).
YCharts – Alphabet/Google vs. Mega-Cap Peers, Total Debt minus Cash, 10 Years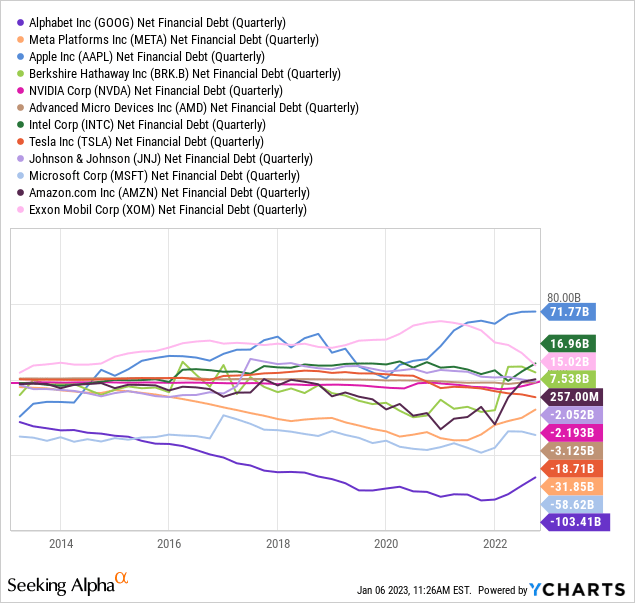
10-Year Low Valuation
The main reason I continue to like Google as an investment and am willing to hold temporary losses is investors appear to have given up on the business. Why is a good question? The long-term outlooks for targeted search revenue, streaming advertisements on eyeballs, on top of moving our technology-based world to the cloud remain quite bullish.
I know growth rates will not be the same over the next decade as the recent past. However, Google/Alphabet has enormous cash on hand and coming in the door daily to invest in new business units (organically or through acquisitions) or even to aggressively buy back existing shares (ownership units) to accretively help out results. In a recession, other companies will not be able to take advantage of the downturn in a similar fashion.
Final income margins on sales are above normal vs. the largest capitalization businesses in America. Really, only Microsoft has a higher net margin rate of 34% vs. Google’s 24% over the latest 12-month period.
YCharts – Alphabet/Google vs. Mega-Cap Peers, Final Income Margins, 10 Years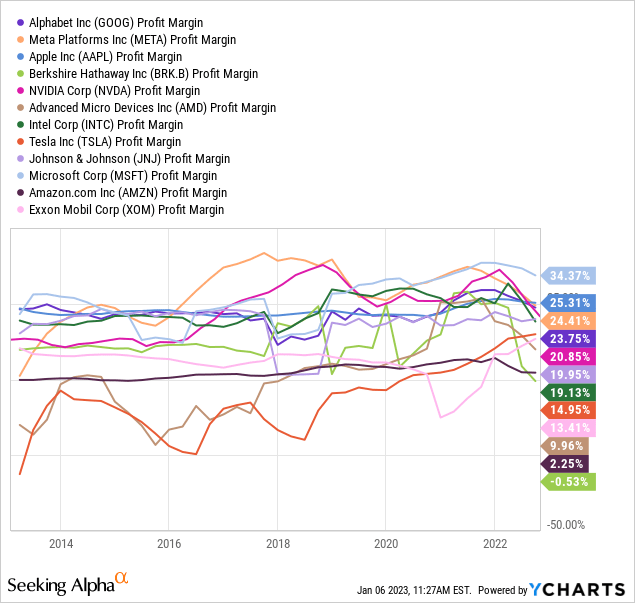
In the end, I do not understand the rationale of putting decade-low operating multiples on the business. Below is a ratio analysis picture of price to basic trailing fundamentals for Google. On earnings, sales, cash flow, and tangible book value, it appears Wall Street is uber-bearish on both the present and future of the company.
YCharts – Alphabet/Google, Price to Basic Trailing Fundamentals, 10 Years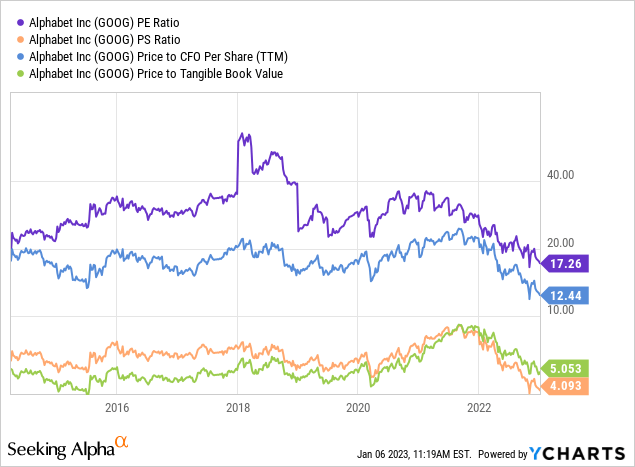
Yet more astonishing is the enterprise value of the company compared to underlying EBITDA (ground-floor cash generation) or revenues. When we subtract 10% in company value to account for the $103 billion in net cash held (not necessary to run the business), a much clearer bargain argument appears.
On EV calculations below, Google is priced at a 30% discount to 10-year averages, and a better than 50%-off sale from 2021’s peak valuation. Bottom line, to get back to the same enterprise value multiples of late 2021, shares would have to DOUBLE in price to $180 (as the underlying business continues to grow, albeit at a slowing pace).
YCharts – Alphabet/Google, EV to Trailing/Forward EBITDA & Sales, 10 Years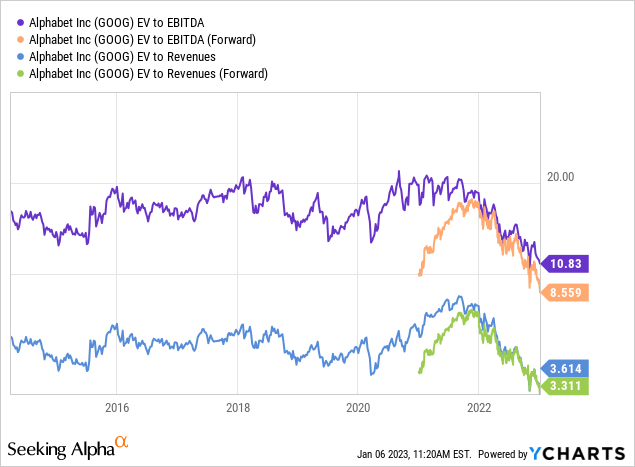
Again, when we review EV multiples on forward projected EBITDA, Alphabet/Google is priced as one of the “cheapest” Big Tech and large-capitalization businesses in America. The current 8.5x ratio is a rough 30% discount to the median average of our sort group. Does it make sense for one of the highest-margin businesses, with the best balance sheet, and solid growth prospects to be valued on the low end of the spectrum? My answer is a hard NO. Logically, the opposite should be reality. Essentially, Google could easily be valued at above-normal rates vs. the alternatives.
YCharts – Alphabet/Google vs. Mega-Cap Peers, EV to Forward EBITDA, Since 2021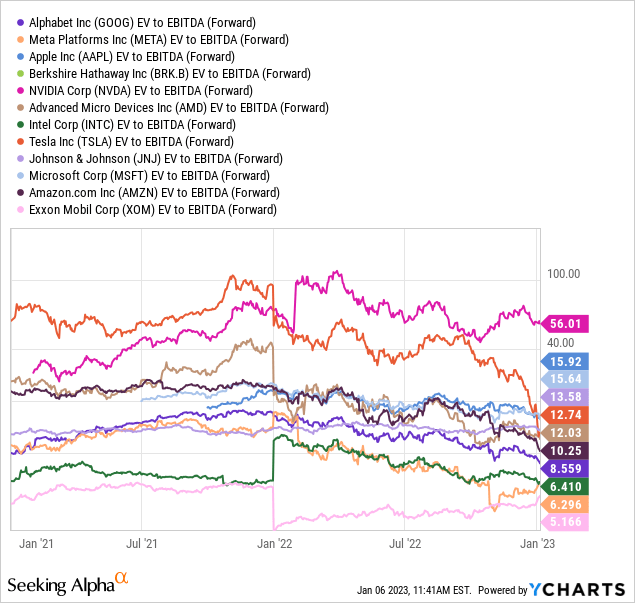
Technical Trading Considerations
Unfortunately for shareholders, total returns over the last year have been a sizable -37% loss, drawn below. Fortunately for shareholders, this number has widely outperformed other Big Tech choices. 2022 losses from the majority of peers are in the -50% to -90% range (many not pictured) for total returns. So, Google owners don’t have much to complain about, especially if price recovers to all-time highs later in 2023 or 2024.
YCharts – Alphabet/Google vs. Mega-Cap Peers, Total Investment Returns, 12 Months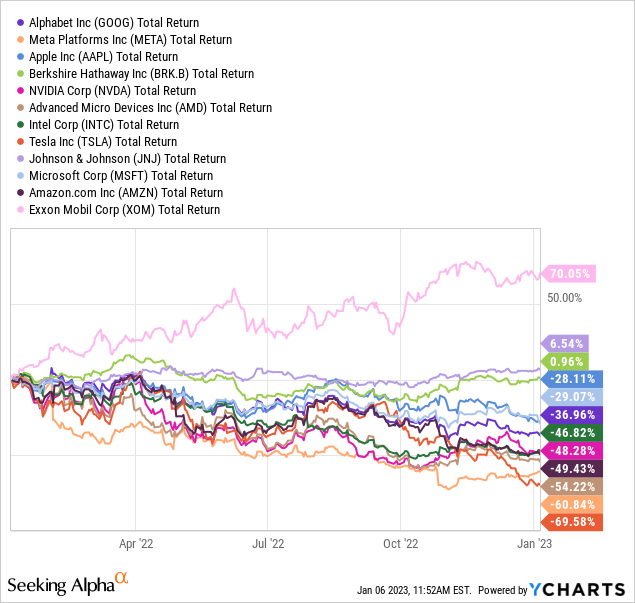
On the technical momentum front, I wish I had positive news to report. Out of my favorite quant-sort list of 10 indicators, only a few are showing any type of bullish activity. Perhaps the smartest combination of indicators for bulls is drawn below.
Google has been able to outperform Big Tech peers and competitors over 1-year and 2-year periods. Over a 2-year span, total returns have bested the Invesco NASDAQ 100 ETF (QQQ) by 10%.
The best hint of a potential immediate bottom in price is found in the relative action of the 14-day Money Flow Index vs. the 14-day Average Directional Index. The oversold MFI conditions under a 30 score (circled in blue) that coincide with a lower-volatility ADX score under 15 (circled in green) have been rare. Today’s instance is similar to the January 2021 and January 2022 setups. Marked by the green arrows for price, the last two circumstances proved decent to great times to buy Google for a several month trade. Will history repeat this January and help investors to gains in February and March?
StockCharts.com – Alphabet/Google, Daily Price & Volume Changes, Author Reference Points, 2 Years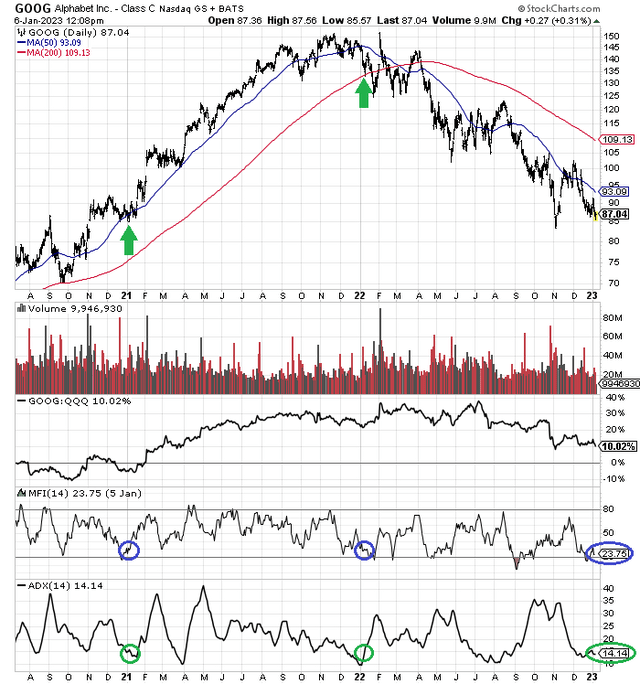
Final Thoughts
Although the momentum picture is not very optimistic, I view the current price under $90 as Strong Buy territory. If the Google quote falls further in coming weeks, I will likely add to my stake. Eventually, investors will return to the stock. When they do, price could rise 30% to 40% rapidly. That would just bring the valuation story back to 10-year normal levels (a mean reversion effort), as operating results continue to rise. If an economic rebound takes place in the second half the year, pushing sales and income higher than expected into 2024, a share advance beyond 50% is probable over the next 12-18 months. At least that’s the way I see it.
What are the investment risks? The main worries are a deep recession hurting advertising trends further and a stock market bear continuing during the year. Both are risks to seriously consider, as the odds of either playing out are high (25% to 50% range, in my opinion). Other risks revolve around antitrust actions in Europe, the U.S., and elsewhere. Governments would like to regulate the near monopoly on search engines, and might even attempt to break up the business into three or more separate companies. I personally feel today’s undervaluation may already be discounting such actions, to a degree.
My view is buying this blue-chip winner on weakness will be rewarded in time.
I place the odds of price sinking under $70 per share in 2023 (20% loss from $87) at a less than 1 in 10 probability. Against the potential of 50%+ gains in a best-case scenario over the next 12 months, the playing field may be heavily tilted in favor of bulls.
Seeking Alpha’s Quant Ranking system places a Top 8% score on Google today vs. alternative equity choices. Still rising operating results and an improving valuation are usually positive developments for investors.
Seeking Alpha – Alphabet/Google Quant Rank, January 6th, 2022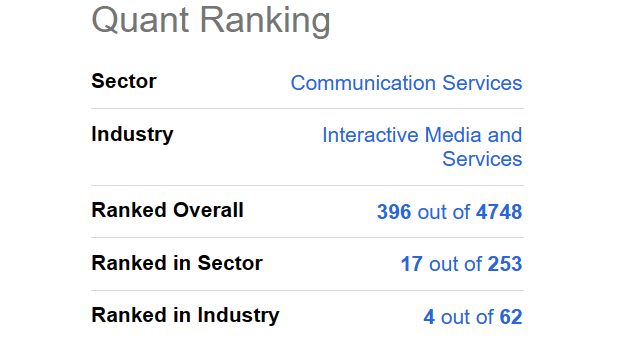
Google really is one of the Top 10 companies in the U.S. measured by a variety of metrics like balance sheet strength, profits margins, raw size and reach, employee pay, customer satisfaction, etc. If you want to participate in the U.S. stock market’s future, owning this media/tech blue-chip at an unreasonably low valuation is something of a no-brainer in portfolio construction.
Thanks for reading. Please consider this article a first step in your due diligence process. Consulting with a registered and experienced investment advisor is recommended before making any trade.
Disclosure: I/we have a beneficial long position in the shares of GOOG, DIS either through stock ownership, options, or other derivatives. I wrote this article myself, and it expresses my own opinions. I am not receiving compensation for it (other than from Seeking Alpha). I have no business relationship with any company whose stock is mentioned in this article.
Additional disclosure: This writing is for educational and informational purposes only. All opinions expressed herein are not investment recommendations, and are not meant to be relied upon in investment decisions. The author is not acting in an investment advisor capacity and is not a registered investment advisor. The author recommends investors consult a qualified investment advisor before making any trade. Any projections, market outlooks or estimates herein are forward looking statements and are based upon certain assumptions and should not be construed to be indicative of actual events that will occur. This article is not an investment research report, but an opinion written at a point in time. The author’s opinions expressed herein address only a small cross-section of data related to an investment in securities mentioned. Any analysis presented is based on incomplete information, and is limited in scope and accuracy. The information and data in this article are obtained from sources believed to be reliable, but their accuracy and completeness are not guaranteed. The author expressly disclaims all liability for errors and omissions in the service and for the use or interpretation by others of information contained herein. Any and all opinions, estimates, and conclusions are based on the author’s best judgment at the time of publication, and are subject to change without notice. The author undertakes no obligation to correct, update or revise the information in this document or to otherwise provide any additional materials. Past performance is no guarantee of future returns.
