Summary:
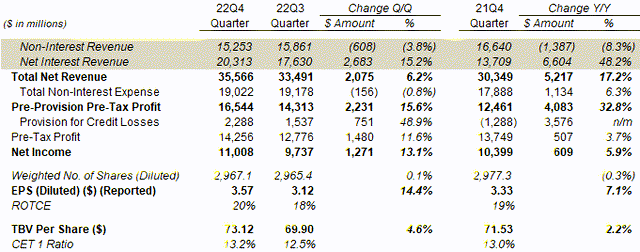
- JPMorgan Chase & Co. delivered another steady quarter, with profits up year-on-year and a strong 20% Return on Tangible Common Equity.
- Strong Net Interest Income, driven by both higher rates and loan growth, more than offset a modest fall in Non-Interest Revenues.
- JPMorgan now has more than enough credit reserves for a mild recession, and will likely remain profitable even in a bad one.
- Buybacks are resuming after JPMorgan hit a capital ratio target early. The dividend represents a 2.8% yield now and should rise further.
- With JPMorgan Chase & Co. shares at $142.94, we expect a total return of 40% (12.5% annualized) by end of 2025. Buy.
Drew Angerer
Introduction: Why is JPM Stock Up?
JPMorgan Chase & Co. (NYSE:JPM) reported their Q4 2022 results this morning (January 13). JPM shares initially fell by as much as 2.8% at the open, but are now up 2.4% (as of 13:10 EST).
We have covered JPM stock on Seeking Alpha since 2019. Our current Buy rating was the result of an upgrade last April; since then, JPM shares have gained 15% (including dividends), outperforming the S&P 500 Index (SP500) by nearly 25%:
|
Librarian Capital JPM Rating History vs. Share Price (Last 1 Year)  Source: Seeking Alpha (13-Jan-23). |
Q4 2022 represented another quarter of steady profitability. JPM achieved a Return on Tangible Common Equity (“ROTCE”) of 20% in Q4 and 18% for the full year. Strong Net Interest Income (“NII”), benefiting from both higher rates and loan growth, more than offset moderately weaker Non-Interest Revenue (“NIR”). Credit reserves are above what is needed for a mild recession.
2023 outlook includes good NII growth and more moderate expense growth. 2023 ROTCE will almost certainly be profitable even with a bad recession. Management reiterated their 17% average across-the-cycle ROTCE target. Buybacks will resume this quarter after a capital ratio target was exceeded one quarter early. JPM shares are at 1.95x Price / Tangible Book Value (“P/TBV”), a 12.6x normalized P/E and a 2.8% Dividend Yield. Our forecasts indicate a total return of 40% (12.5% annualized) by 2025 year-end. Buy.
JPMorgan Buy Case Recap
We believe JPM has the best franchise among large U.S. banks, though Bank of America (BAC) has similar advantages and is also Buy-rated in our coverage. We believe large U.S. banks can grow their earnings at “GDP +”, thanks to their scale, diversified franchise, and leading market positions:
- Large banks achieve NII on favorable Net Yields, thanks to their cheap deposit funding; Net Yields had shrunk in recent years due to Quantitative Easing (“QE”), but are reversing with recent rate hikes
- They have large NIR such as investment banking fees, which tend to become elevated during periods of QE as cheap money stimulates corporate and market activity, offsetting NII weakness
- Their cost ratios tend to be stable or improving, as economies of scale and use of technology help them become more efficient
- They are now far less impacted by economic downturns than in the past, thanks to QE policies and much larger capital buffers after the 2008 crisis
As of our October update, we believe JPM can achieve a long-term, across-the-cycle average ROTCE of 15.5%, supported by its track record (adjusted for differences in capital ratios before 2008 and the tax rate before 2018), though 1.5 ppt lower than management’s own 17% average across-the-cycle target:
|
JPM ROTCE vs. Medium-Term Outlook (Since 2004) 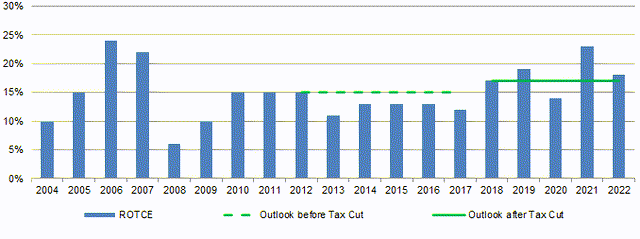 Source: JPM results supplements. |
JPM’s performance in Q4 and full-year 2022 significantly exceeded our long-term assumptions.
JPM Q4 Results Headlines
In Q4 2022, JPM achieved a ROTCE of 20%, about 2 ppt higher sequentially and 1 ppt higher year-on-year:
Total Net Revenue was up both sequentially and year-on-year. Strong double-digit NII growth was the driver in both cases, more than offsetting moderate declines in NIR. Expenses were up 6.3% year-on-year but down 0.8% from Q3.
Provision for Credit Losses were $750m higher sequentially and $3.56bn worse than the prior-year quarter (when there was a $1.29bn benefit), but Net Income was still 13.1% higher sequentially and 5.9% higher year-on-year.
The share count was 0.1% up sequentially and down 0.3% year-on-year, after JPM suspended share buybacks in July to build its capital base in anticipation of higher regulatory capital requirements.
The Common Equity Tier-1 (“CET1”) ratio was 13.2%, up 70 bps from Q3 2022, primarily from organic capital generation (63 bps) and helped by Risk-Weighted Assets optimization (16 bps), offset by the dividend payout (18 bps).
Q4 2022 also represented another quarter of steady profitability. Pre-Tax Profit has been rising steadily since Q1 2022, after an exceptionally strong 2021 when NIR was boosted by record low interest rates, and remained higher than pre-COVID 2019 levels. This steady profit growth is even more evident in Pre-Provision Pre-Tax Profit figures, which unlike Pre-Tax Profit are not affected by volatile credit reserve builds and releases:
|
JPM Earnings, Provisions & Pre-Tax Profit by Quarter (Since Q4 2019) 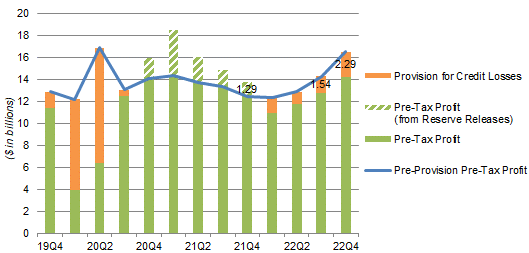 Source: JPM results supplements. NB. Figures on managed basis. |
For full-year 2022, JPM achieved a ROTCE of 18%, lower year-on-year mainly due to credit provisions being a $6.39bn charge this year compared to the $9.26bn benefit that they were in 2021:
|
JPM Results Headlines (Managed Basis) (2022 vs. Prior Year) 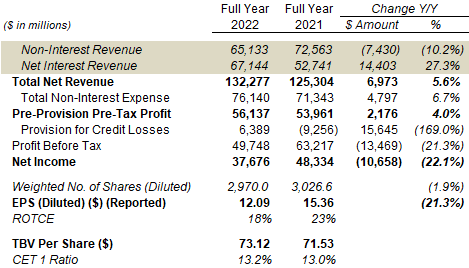 Source: JPM results supplement (Q4 2022). |
Just as importantly, JPM’s strong results showed the underlying strength of its businesses and growth drivers.
Rate Hikes & Loan Growth Helping NII
JPM’s strong double-digit NII growth was helped by both interest rate increases and loan growth.
On a year-on-year basis, JPM’s Net Yield on all interest-earning assets rose by nearly half from 1.63% to 2.47%, serving as the main driver of NII growth. Total interest-earning assets fell 2.2% year-on-year, primarily due to reductions in lower-yield Deposits with Banks and Investment Securities. The average Loans balance rose 6.2% year-on-year as of Q4, with good growth in Consumer Card Services, Commercial Banking and Corporate & Investment Banking (“CIB”).
|
JPM Interest Revenue, Loans & Rates (Q4 2022 vs. Prior Periods) 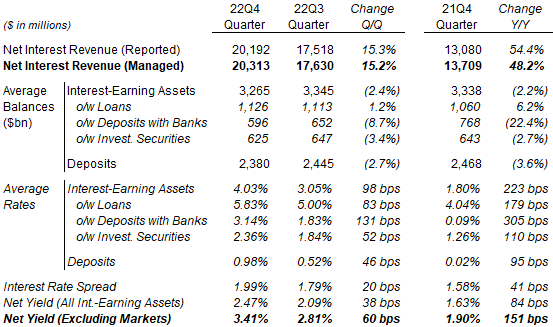 Source: JPM results supplement (Q4 2022). |
Sequential trends were similar, with average Loans balance growing 1.2% between Q3 and Q4 of 2022.
NIR Solid Except in Investment Banking
The moderate decline in NIR was primarily due to weaker Investment Banking (“IB”) Revenues. Compared to a $1.39bn year-on-year decline in group NIR in Q4 2022, IB Revenues in CIB fell $1.82bn. Markets (i.e. trading) revenues were solid, with Equity revenues similar to last year and Fixed Income revenues 12% higher year-on-year:
|
JPM CIB Revenues by Type (Q4 2022 vs. Prior Periods) 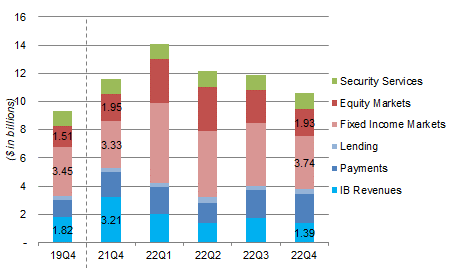 Source: JPM results presentations. |
The decline in IB Revenues was sector-driven and likely temporary. Management stated that JPM’s decline was “in line with the market,” and that JPM was ranked #1 for global IB fees in 2022 with a wallet share of 8%. IB Revenues were actually 24% lower than even pre-COVID Q4 2019, likely reflecting an artificially depressed figure. We believe JPM’s IB franchise remains market-leading and will benefit when corporate and capital markets activity levels rebound.
Credit Reserves Enough for Mild Recession
JPM’s credit reserves are now above what is needed for a mild recession, meaning that 2023 credit reserve builds should be moderate (for loan growth) unless there is a significantly worse recession.
JPM added $3.5bn of reserve build in 2022 (including $1.4bn in Q4), compared to a reserve release of $12.1bn in 2021:
|
JPM Provision for Credit Losses (Q3 2022 vs. Prior Periods)  Source: JPM results presentation (Q4 2022). |
Total Allowance for Credit Losses stood at $22.2bn and 1.81% of total retained loans at Q4 2022, higher than the $19.7bn and 1.62% figures a year ago, as well as the $14.3bn and 1.39% figures at the end of 2019.
Management stated that the amount of credit reserves “now reflects a mild recession in the central case” (including U.S. unemployment rising to 5%) as well as a number of more adverse scenarios, which means overall they have reserved more than enough than for a mild recession. CEO Jamie Dimon speculated that, in the event U.S. unemployment rose to 6%, they “would need about $6 bn more.” This would be easily funded by JPM’s Pre-Provision Pre-Tax Profit (which has exceeded $53bn every year in 2019-22).
JPM 2023 Outlook
Management has provided an outlook for 2023, which included NII of $73bn (compared to $67bn in 2021) and expenses of $81bn ($75.9bn in 2021), and Card Services Net Charge-Off (“NCO”) of around 2.60% (1.47% in 2022):
|
JPM 2023 Outlook  Source: JPM results presentation (Q4 2022). |
The $73bn NII figure already assumes some deposit attrition and repricing, and is lower than the Q4 run-rate of $81bn. The $81bn expense figure includes some headcount increases but less than in 2022, as well as $0.5bn of higher FDIC assessment. The higher Card NCO rate would imply an increase of at least $1.85bn in credit provisions, depending on the growth in Card balances. (Consumer Card NCO was $2.40bn in 2021.)
We make the following further assumptions for 2023:
- NIR to be $60.0bn, slightly lower than in 2019
- Provision for Credit Losses to be $6.5bn, similar to 2022, with higher Card NCO offset by lower reserve build
- Average CET1 capital to be 3% higher year-on-year.
Then we arrive at the following forecasts that imply a ROTCE of 16%, still higher than our 15.5% long-term assumption:
|
Illustrative JPM 2022 Forecasts 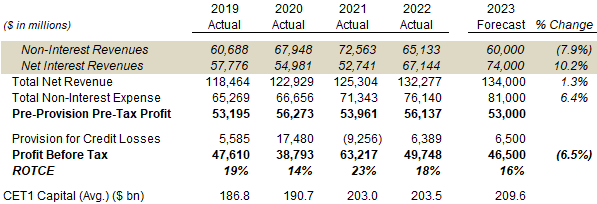 Source: Librarian Capital estimates. |
Management did not provide a specific 2023 ROTCE outlook, though they reiterated their confidence in their 17% average across-the-cycle ROTCE target. CEO Jamie Dimon also speculated that, “even in a real recession, it would probably equal the average industrial company.”
We believe JPM’s ROTCE will almost certainly remain positive even with a bad recession, just as it did during the initial quarters of COVID-19 when customer activity levels were low and large credit provisions were taken. (JPM’s ROTCE was 5% in Q1 2020 and 9% in Q2 2020.)
$12bn Buybacks & More Dividends in 2023
Management comments indicate there will be $12bn of share buybacks in 2023; we also expect another dividend hike.
JPM finished 2022 with a CET1 ratio of 13.2%, exceeding its 13% target for Q1 2023 one quarter early, and will, therefore, resume the buybacks that were suspended in July 2022. CFO Jeremy Barnum suggested on the earnings call that $12bn would be “a good number to use” in analyst models. This equivalent to 3% of the current market capitalization.
The increase in CET1 ratios is driven by regulatory requirements, and the next target is to reach 13.5% by the end of Q1 2024. We believe JPM will generate enough capital to achieve this as well as dividends and buybacks. (We are assuming that finalization of Basel III standards will not result in a further increase in regulatory requirements.)
JPM last raised its dividend, by 11% (from $0.90 to $1.00 per quarter), in September 2021 after passing the Fed’s CCAR (Comprehensive Capital Analysis & Review) stress tests. We expect another increase around the same time this year.
JPM Stock Valuation
With the share price at $142.94 (as of 13:10 EST), JPM shares are trading at 1.95x P/TBV (TBV/Share is $73.12).
Relative to normalized earnings, the P/E multiple is 11.5x if we apply management’s targeted ROTCE of 17%, or 12.6x if we apply our expected long-term ROTCE of 15.5%. Relative to history, JPM shares are on 12.1x 2019 EPS and 11.7x 2022 EPS (adjusted for subsequent buyback).
JPM stock pays a dividend of $1.00 per quarter ($4.00 annualized), representing a Dividend Yield of 2.8%.
Our JPM Stock Forecasts
For 2023-25, we revised our assumptions as follows:
- Tangible Book Value to rise to $225.2bn at 2023 year-end then stay flat (was $226.4bn)
- ROTCE to be 16% in 2023 (was 12%) and 15.5% in 2024-25 (unchanged)
- Dividends to be on a 36% Payout Ratio (was 40%)
- Net Income after dividends to be spent on buybacks from 2024 (unchanged)
- Buybacks to be done at 2.1x P/TBV (was 1.8x)
- P/E multiple to be 14.5x at 2025 year-end (unchanged).
Our new 2025 EPS forecast of $12.81 is 3% lower than before ($13.17):
|
Illustrative JPM Return Forecasts 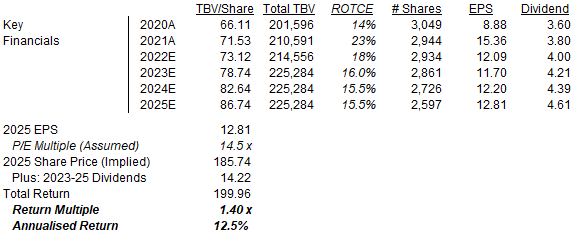 Source: Librarian Capital estimates. |
With shares at $142.94, we expect an exit price of $186 (implying a P/TBV of 2.1x) and a total return of 40% (12.5% annualized) by 2025 year-end.
Conclusion: Is JPM Stock a Buy?
We reiterate our Buy rating on JPMorgan Chase & Co. stock.
Disclosure: I/we have a beneficial long position in the shares of BAC either through stock ownership, options, or other derivatives. I wrote this article myself, and it expresses my own opinions. I am not receiving compensation for it (other than from Seeking Alpha). I have no business relationship with any company whose stock is mentioned in this article.

