
Summary:
- KLA Corporation’s 47% stock price increase is justified by strong growth drivers like advanced packaging, GAA architecture, and high NA EUV technology, boosting revenue forecasts by 3.3%.
- Despite a slight underperformance in 2023 due to TSMC delays, KLA is poised for recovery with TSMC’s Arizona plant on track for 2025 production.
- We expect the closure of KLA’s FPD division to contribute to margins minimally, increasing the total weighted average margin by only 0.3%.
- Our updated DCF valuation with a higher price target reflects the higher growth forecasts, which support current price levels.
sankai
In our previous analysis, we highlighted KLA Corporation’s (NASDAQ:KLAC) strong profitability with a 5-year average FCF margin of 24.24% and forecasted the forward average of 28.7%. We expected KLA to maintain a stable market share in legacy nodes, with consistent revenue exposure to China over the last three years. We also expected a semicon equipment market rebound in 2024 (12.7% increase in semicon process control equipment), to bold well for the company’s growth outlook.
In this analysis, we focused primarily on examining whether the substantial 47% increase in the company’s stock price since our last review was justified. We first assessed KLA’s revenue growth by segment and compared it with our previous forecasts to determine if it was in line with the actual performance in 2023. Additionally, we explored key growth drivers in the semicon process control segment as a whole, to determine if they could substantially boost the company’s growth outlook. Finally, we considered the impact of the closure of the company’s Flat Panel Display Business, analyzing whether this could drive a positive growth outlook.
Expected Growth Recovery
In the first section, we analyze the company’s revenue growth breakdown by segment and compare it with our previous forecasts to determine whether our forecasts were in line with its actual performance in 2023.
We compiled the company’s revenue breakdown by segment below and updated it with the latest FY2024 figures and our previous forecasts.
|
Revenue by Major Product Categories ($ mln) (FY*) |
2020 |
2021 |
2022 |
2023 |
Our Previous 2023 Forecast |
Average |
|
Wafer Inspection |
2,661 |
4,015 |
4,337 |
4,333 |
4,190 |
|
|
Growth Rate (%) |
27.9% |
50.9% |
8.0% |
-0.1% |
-3.4% |
21.7% |
|
Patterning |
1,506 |
2,050 |
2,791 |
2,054 |
2,665 |
|
|
Growth Rate (%) |
17.8% |
36.1% |
36.2% |
-26.4% |
-4.5% |
15.9% |
|
Specialty Semiconductor Process |
305 |
415 |
492 |
471 |
483 |
|
|
Growth Rate (%) |
13.0% |
36.2% |
18.6% |
-4.3% |
-1.8% |
15.9% |
|
PCB, Display and Component Inspection |
562 |
562 |
378 |
291 |
286 |
|
|
Growth Rate (%) |
13.1% |
0.1% |
-32.8% |
-23.1% |
-24.2% |
-10.7% |
|
Services |
1,678 |
1,910 |
2,117 |
2,330 |
2,191 |
|
|
Growth Rate (%) |
13.6% |
13.8% |
10.8% |
10.0% |
3.5% |
12.1% |
|
Other |
206 |
259 |
381 |
334 |
355 |
|
|
Growth Rate (%) |
1.6% |
25.7% |
46.9% |
-12.4% |
-6.9% |
15.4% |
|
Total |
6,919 |
9,212 |
10,496 |
9,812 |
10,170 |
|
|
Growth Rate (%) |
19.2% |
33.1% |
13.9% |
-6.5% |
-3.1% |
14.9% |
* Financial years ending in H1 are considered the previous year
Source: Company Data, Khaveen Investments
From above, our previous FY2023 forecast of the company is fairly in line with the actual, where we projected a growth rate of -3.1% with the actual being -6.5%. In terms of the PCB, Display and Component Inspection segment, the segment had the second-largest decline by -23.1%, but the segment only accounts for 5.4% of total KLA revenue, this is fairly in line with our projection as management mentioned in its latest earnings briefing that the PCB “market has been relatively sluggish”. However, the segment with the biggest difference between our forecast and actual was patterning (-26.4% vs -4.5%). On the other hand, services revenue experienced a positive growth rate in 2023 at 10%, as well as demonstrating a consistent growth rate averaging 12.1% from 2019 to 2023. This surpasses our forecasts of 3.5%. According to management, this is due to the utilization rates which have “steadily improve(d) across all segments in the course of this year”, indicating that equipment is still under operation despite the slowdown in market demand. In our previous analysis, we projected KLA’s full-year segment revenue based on the sum of the actual Q1, Q2 guidance, and H2 revenue based on market forecast CAGR as we expected a market recovery.
The revenue growth for the patterning segment fell nearly 22% below our expectations. While the inspection subsegment surpassed our forecast, this was not enough to offset the strong decline in patterning. Management noted in the Q2 FY2024 earnings transcript that this decline is due to customer pushout, specifically mentioning the “hundred million dollars of business” that has been postponed by approximately 12 months. Additionally, a Reuters report from September 2023 also indicated that “TSMC has been forced to push back production at the Arizona plant by a year to 2025,” primarily due to workforce shortages. Given that TSMC accounts for more than 10% of KLA’s revenue in the Semicon Process Control segment (as stated in the annual report), we believe that the pushout could be a major factor behind the significant decline in patterning revenue as this 10% translates to TSMC’s revenue contribution to the segment being $638.8 mln. If the project was not delayed, we estimate the segment revenue for patterning would be at $2,693 mln, which would then show a -3.5% growth rate, closely aligning with our projection of -3.8%.
In terms of the growth outlook, management expects an improvement in the memory market due to HBM demand increase. This outlook aligns with the analysis from our previous coverage, where we compiled the capex for leading companies (Micron (MU), SK Hynix, and Samsung (OTCPK:SSNLF)) and derived an expected growth in the memory market of 23% YoY by 2024 as well as in 2025 at 31%. We believe that this growth is primarily driven by the expected increase in demand for leading-edge memory due to AI. Additionally, in terms of logic/foundry (59.7% of KLA’s revenue in FY2024), management also claimed to see a tailwind due to customers’ “continuation of scaling and incorporation of new technologies and slowly rising capital intensity”, such as the adoption of the upcoming plans for High NA EUV technologies as mentioned in our previous analysis of ASML (ASML), which aligns with our projection of the capex for foundry companies (TSMC (TSM), Samsung, Intel (INTC)) to be averaged at 20.2% growth by 2025.
Subsequently, our revenue growth forecasts for the company are fairly in line with the actual as we had anticipated a decline in 2023 due to market contraction. However, the actual revenue fell slightly below our expectations, primarily due to the underperformance in patterning caused by the customer pushout, which we believe refers to the TSMC delay in its production at the Arizona plant. Following the update in TSMC’s Q1 FY2024 earnings briefing, the company stated it is “well on track for volume production in the first half of 2025” at its Arizona fabs. We believe this also reflects a positive outlook and recovery for KLA together with both the logic/foundry and memory markets to rebound across 2024 and 2025.
Upward Revision of Growth Projections
In the first section of our analysis, we observed that the segment revenue of Semiconductor Process Control (65.1% of KLA’s total revenue in FY2023) deviated the most from our full-year projections, primarily due to a substantial decline in patterning due to the pushout of TSMC orders. Thus, in the second point, we shifted our focus to examining the growth outlook for the company’s Semiconductor Process Control-related segments, which include Wafer Inspection and Patterning. We foresee the segment’s outlook growing positively given that TSMC is on track for volume production as well as after identifying several key growth drivers that KLA could capitalize on.
Additionally, we observed several bullish factors that could propel the segment growth even higher than we previously forecasted. This includes the key growth drivers for the segment as highlighted during the latest earnings briefing such as advanced packaging, the transition to GAA architecture and high-NA EUV.
|
Revenue by Major Product Categories ($ mln) (CY) |
2023 |
2024F |
2025F |
2026F |
2027F |
|
Wafer Inspection |
4,237 |
4,661 |
5,126 |
5,638 |
6,202 |
|
Growth Rate (%) |
-2.3% |
10.0% |
10.0% |
10.0% |
10.0% |
|
Patterning |
1,958 |
2,348 |
2,815 |
3,375 |
4,047 |
|
Growth Rate (%) |
-29.8% |
19.9% |
19.9% |
19.9% |
19.9% |
|
Total Wafer Inspection and Patterning (Semicon Process Control) |
6,196 |
7,012 |
7,949 |
9,027 |
10,269 |
|
Growth rate (%) |
-13.1% |
13.2% |
13.4% |
13.6% |
13.8% |
|
Advanced Packaging |
320 |
500 |
625 |
781 |
977 |
|
Growth Rate (%) |
56.3% |
25.0% |
25.0% |
25.0% |
|
|
Total |
9,812 |
11,089 |
12,472 |
14,071 |
15,921 |
|
Growth Rate (%) |
-6.5% |
13.0% |
12.5% |
12.8% |
13.2% |
Source: Company Data, Khaveen Investments
We updated our projection for wafer inspection and patterning based on the global semicon wafer inspection equipment market and the e-beam wafer inspection market respectively. Overall, after the adjustments, our 4-year forward revenue growth rate for KLA now has an average of 12.9%, in contrast with our previous forward average of 9.6%. One of the key growth drivers is the transition to GAA architecture, which based on management, has increased the complexity of semicon manufacturing processes, leading to increased demand for more sophisticated patterning and wafer inspection technologies.
KLA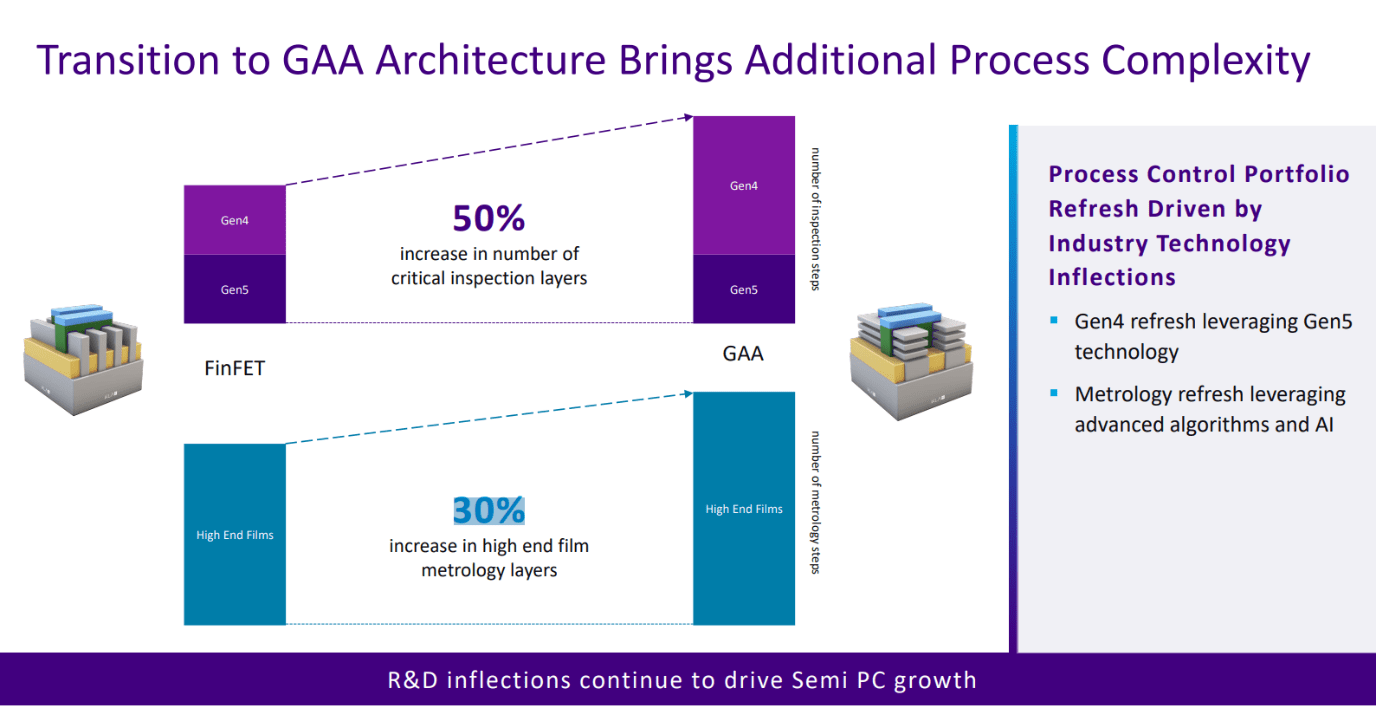
Based on the slide above, KLA claimed that the “Transition to GAA Architecture Brings Additional Process Complexity” due to a “50% increase in the number of critical inspection layers” and a “30% increase in high-end film metrology layers”. Additionally, major IDMs like Samsung and Intel are also transitioning from FinFET to the new Gate-All-Around (GAA) transistor design, similar to TSMC as the company plans to “shift to GAA technology for their N2 process node”. KLA has reported that during FY2021, FY2022, and FY2023, both TSMC and Samsung each contributed over 10% of its total revenues within the Semiconductor Process Control segment. This serves as a growth driver for KLA as the company provides essential technologies to manage and optimize this complexity. For example, this includes the company’s 29xx series for “Broadband Plasma Patterned Wafer Defect Inspection Systems”, which are specifically designed to support the complex manufacturing requirements of GAA transistor production.
Moreover, our previous analysis highlighted that high NA EUV supports the demand for KLA’s systems targeting EUV applications. We noted that companies including TSMC and Samsung, have ordered advanced EUV systems from ASML, which are KLA’s two largest customers contributing over 10% of its revenue. TrendForce reported that as the production capacity for advanced chips continues to expand, “ASML’s delivery volume in 2025 is expected to grow by more than 30%”. This forecast includes TSMC’s substantial order of EUV machines as well as orders from companies like Samsung and Micron. Hence, as the production capacity for 2nm chips increases, which requires “extremely high precision and complex process flow”, the need for KLA’s advanced inspection solutions such as the Voyager and Surfscan series positions the company well to capitalize on this growth driver.
KLA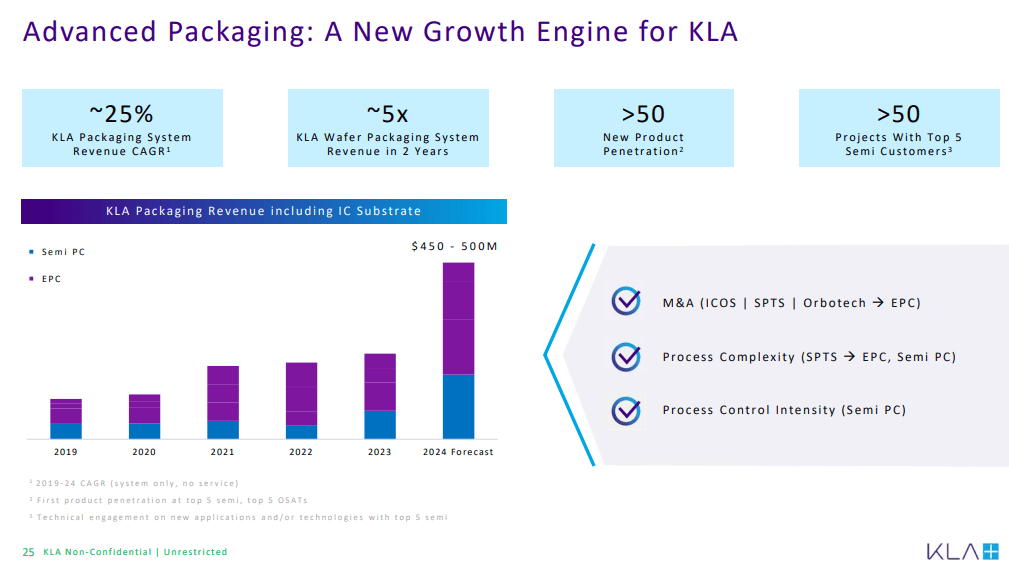
In terms of advanced packaging, KLA released an investor presentation showing a 25% historical CAGR in its packaging revenue, with management projecting the segment revenue to reach $500 mln by the 2024 calendar year. Management claimed it to be primarily driven by AI, which “is driving higher volume wafer manufacturing, more complex designs, larger die and chip size, and growing advanced packaging demands”, thus enhancing the intensity of the process control segment. Furthermore, management also indicated that of the forecasted $500 mln revenue, approximately 60% is attributed to the “classic semiconductor process control” segment and 40% to the specialty semiconductor process business.
From KLA’s official website, we identified systems tailored for advanced wafer-level packaging. Which include the Kronos 1190 for “advanced wafer-level packaging (AWLP) applications including 3D IC and high-density fan-out,” and the CIRCL-AP system for “high sensitivity including 2.5D/3D integration.” Additionally, the SPTS Delta PECVD system is designed for etch and deposition processes for packaging processes in low-temperature environments. Semicon Taiwan also highlights the “increasing need for high-precision inspection” in chip technology, noting that “2D-based inspections can no longer satisfy the needs for quality control where 3D inspection is becoming essential”. With its advanced technologies and partnerships with major OSATs like ASE, we believe KLA is well-positioned to capitalize on the substantial growth (25%) in the advanced packaging market.
|
KLA Total Growth Projection |
2024F |
2025F |
2026F |
2027F |
Forward Average |
|
Total Revenue (Our Previous Projection) |
11,067 |
12,106 |
13,304 |
14,680 |
|
|
Growth % |
8.8% |
9.4% |
9.9% |
10.3% |
9.6% |
|
Total Revenue |
11,089 |
12,472 |
14,071 |
15,922 |
|
|
Growth % |
13.0% |
12.5% |
12.8% |
13.2% |
12.9% |
Source: Company Data, Khaveen Investments
Overall, we believe KLA’s total wafer inspection and patterning segment revenue is well-positioned for future growth recovery given the key drivers. The transition to GAA architecture and the increased adoption of high NA EUV technology is driving demand for KLA’s advanced patterning and wafer inspection systems, with higher complexity and precision required in semicon manufacturing. Additionally, the significant growth forecast in the advanced packaging market, with a projected 25% CAGR provided by management. The increasing integration of AI also reflects a growing demand in the memory market, coupled with orders from major semicon foundry companies like TSMC, Samsung, and Intel, which we believe indicates a robust outlook for KLA’s revenue growth. After adjusting the growth rate and factoring in advanced packaging’s forecasted growth rate of 25% based on its historical CAGR, our projection for the company’s total revenue growth increases by 3.3%.
Minimal Profit Margin Impact from FPD Division Closure
Furthermore, following management’s claim of a weaker long-term outlook for its PCB, Display & Component Inspection segment due to challenges in the flat panel display business (1.4% of total revenue, 26% of segment revenue) and that they have “begun investigating strategic alternatives for this business”, we analyzed whether the company could benefit from the closure of its FPD division.
Firstly, we compiled the company’s revenue and gross margin breakdown by segment, focusing on the PCB, Display & Component Inspection segment’s performance relative to KLA’s total revenue. We then analyzed the impact of the closure on KLA’s total weighted average margin (segment revenue share multiplied by segment gross margin).
|
Revenue Breakdown by Segment ($ mln) |
2020 |
2021 |
2022 |
2023 |
2024F |
2025F |
2026F |
2027F |
4-year Historical Average |
4-year FWD Average |
|
PCB, Display & Component Inspection Revenue |
562 |
562 |
378 |
291 |
260 |
232 |
207 |
185 |
||
|
Growth Rate (%) |
13.1% |
0.1% |
-32.8% |
-23.1% |
-10.7% |
-10.7% |
-10.7% |
-10.7% |
-10.7% |
-10.7% |
|
Total |
6,919 |
9,212 |
10,496 |
9,812 |
11,089 |
12,472 |
14,071 |
15,921 |
||
|
Growth Rate (%) |
19.2% |
33.1% |
13.9% |
-6.5% |
13.0% |
12.5% |
12.8% |
13.2% |
14.9% |
12.9% |
Source: Company Data, Khaveen Investments
According to the above, the PCB, Display & Component Inspection segment has shown the worst performance in revenue growth, with a 4-year historical average growth of -10.7%, lower compared to the total revenue average (14.9%). In 2022, the PCB, Display & Component Inspection segment saw a significant decline of -32.8% in growth, primarily due to a “softness in the mobile market,” as stated by management. This downturn aligns with Canalys’ reporting the global smartphone shipment with “a 12% drop in annual shipments” for the same year. In 2023, management described the market as “relatively sluggish,” as Canalys reported a slight recovery in smartphone shipment in H2 2023, though shipments were still down by 4% compared to 2022. Furthermore, given that the segment also includes Flat Panel Display products, DSCC also reported an oversupply in 2022 and 2023 where “FPD demand area decreased”, hence also driving a low utilization rate with the fab utilization rate for 2022 to be around 55% (a decrease from ~90% in 2021) and 2023 being below 50%. Additionally, the 2023 decline in the PCB, Display & Component Inspection segment could be also attributable to “the cancellation of a significant new technology project by a major customer” in Q3 FY2024, which led to the company’s decision “to exit the Company’s Display Business”.
|
Flat Panel Display Business Closure Impact |
% of Revenue (Before) |
% of Revenue (After) |
Segment Gross Margin |
Weighted Average Margin (Before) |
Weighted Average Margin (After) |
|
Semiconductor Process Control |
89.0% |
90.2% |
64.2% |
57.1% |
57.9% |
|
Specialty Semiconductor Process |
5.6% |
5.7% |
53.8% |
3.0% |
3.1% |
|
PCB, Display and Component Inspection |
5.4% |
4.0% |
43.8% |
2.4% |
1.8% |
|
Total |
100.0% |
100.0% |
62.5% |
62.8% |
Source: Company Data, Khaveen Investments
Given that management stated in the Q2 FY2024 earnings transcript that the FPD business “accounted for 1.4% of total revenue in calendar 2023,” we analyzed the impact of its closure. By removing $137 mln in the revenue from PCB, Display, and Component Inspection segment, we calculated the revenue share to decrease by 1.4% and correspondingly increased the revenue share for the semicon process control and specialty semicon process segments. We then calculated the weighted average margin before and after the closure by multiplying each segment’s revenue percentage by its gross margin. Following the closure, we observed only a slight increase of 0.3% in the total weighted average margin.
Overall, we believe the closure of the company’s FPD business is a good decision, given that this could improve the weighted average margin for the company’s largest segment of semiconductor process control. Besides, the global flat panel display market size is also observed with a relatively low market CAGR of 3.5%, aligning with the mature state of the consumer electronics market. However, given that the FPD business only represents 1.4% of the total revenue, the overall impact is minimal as the total weighted average margin is projected to only increase by 0.3% after the closure. Hence, we believe that the benefit of the FPD division closure is not significant enough to justify the company’s surge in stock price.
Risk: Inspection Equipment Product Development
ASML, the leader in the overall semicon equipment market in 2023, has announced its recent advancements in collaboration with IMEC. These developments focus on the High NA EUV specific solutions within the field of patterning, “including the development of advanced resist and underlayer materials, photomasks, metrology and inspection techniques”. We believe this could pose a risk for KLAC, which specializes in inspection solutions, as ASML may attract customers within segments where KLAC has held a strong market presence.
Verdict
All in all, we believe KLA is poised to capitalize on the semicon market recovery, particularly due to the tailwind in the memory segment driven by AI and in logic and foundry given the continuous investments from major companies such as TSMC and Samsung. Additionally, we expect minimal impact from previous delays by TSMC going forward with the progress of its expansion in Arizona guided to be on track for completion by 2025. Furthermore, we raised our growth outlook for the company’s process control segment growth, highlighting key growth drivers such as advanced packaging, GAA architecture and high NA EUV technology which could bode well for demand for the company’s process control equipment, leading to a 3.3% higher average revenue growth forecast for the total company. Finally, we believe the FPD division’s closure would benefit its margins, with a slight increase of 0.3%.
Khaveen Investments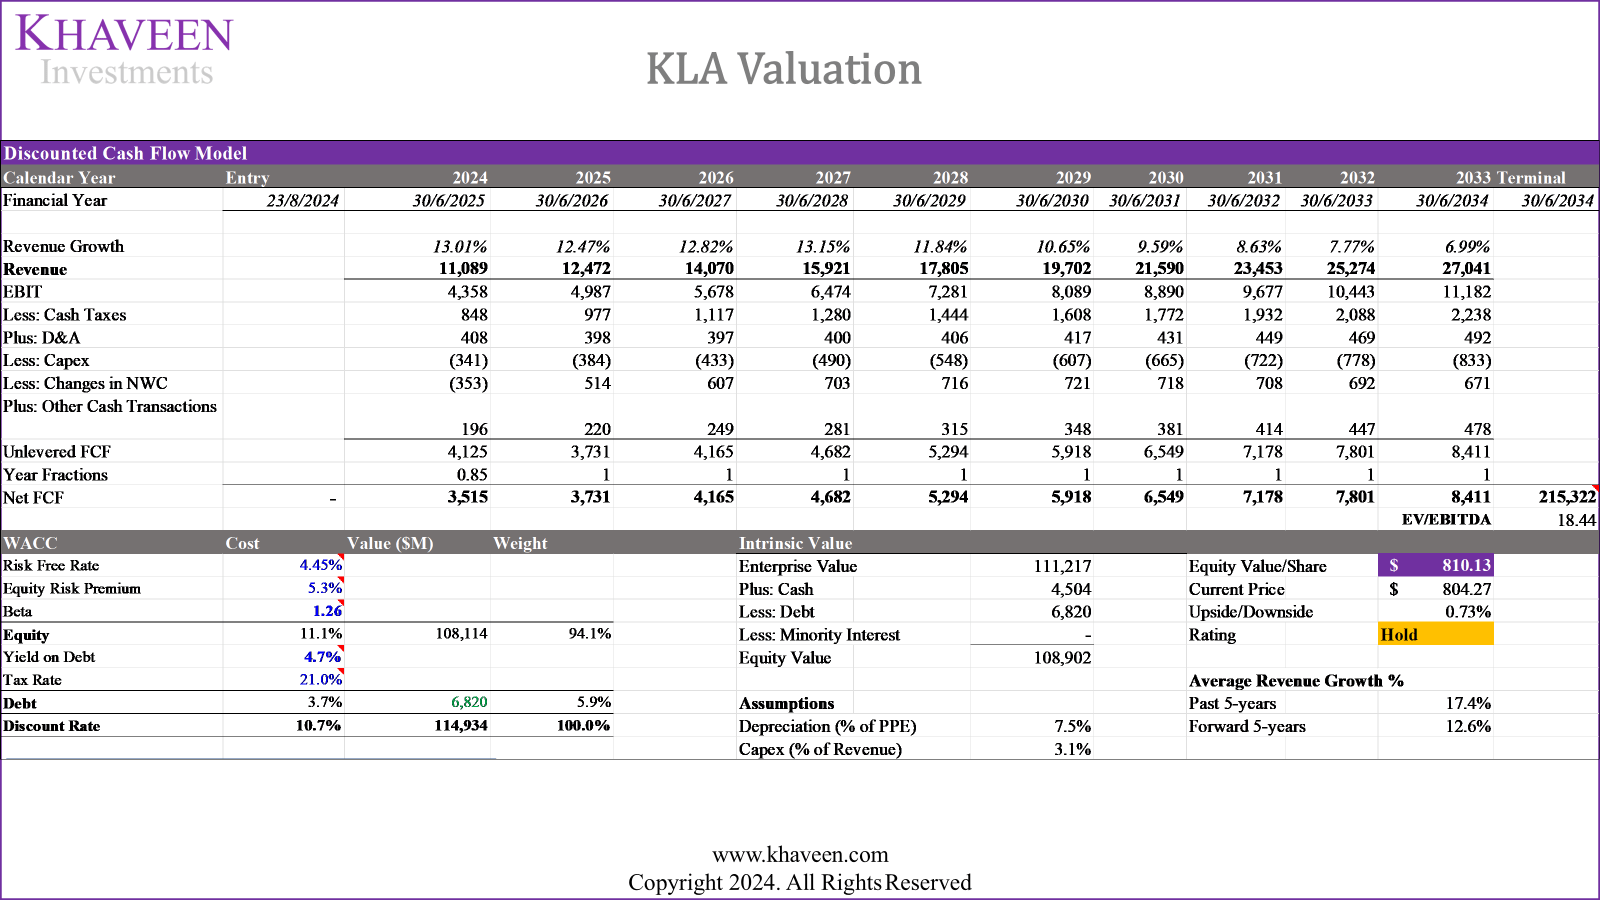
We updated our DCF valuation for KLA, factoring in our revised revenue and margin projections, with a discount rate of 10.7% (company’s WACC) and terminal value based on the top semicon equipment competitors’ 5-year historical average EV/EBITDA of 18.44x. Despite a higher price target of $810.13 compared to our previous analysis of $651.46, our model shows an upside of only 0.7%. Therefore, while we believe the strong run up in the company’s stock price by 47% since our previous coverage is justified, we rate the company as a Hold with a price target reflecting our higher growth forecasts (5-year average of 12.6% vs 7.1%), given the limited upside from current price levels.
Analyst’s Disclosure: I/we have a beneficial long position in the shares of KLAC either through stock ownership, options, or other derivatives. I wrote this article myself, and it expresses my own opinions. I am not receiving compensation for it (other than from Seeking Alpha). I have no business relationship with any company whose stock is mentioned in this article.
No information in this publication is intended as investment, tax, accounting, or legal advice, or as an offer/solicitation to sell or buy. Material provided in this publication is for educational purposes only and was prepared from sources and data believed to be reliable, but we do not guarantee its accuracy or completeness.
Seeking Alpha’s Disclosure: Past performance is no guarantee of future results. No recommendation or advice is being given as to whether any investment is suitable for a particular investor. Any views or opinions expressed above may not reflect those of Seeking Alpha as a whole. Seeking Alpha is not a licensed securities dealer, broker or US investment adviser or investment bank. Our analysts are third party authors that include both professional investors and individual investors who may not be licensed or certified by any institute or regulatory body.