Summary:
- Historically, rapid growth has led to ongoing concerns regarding excessive debt and poor distribution coverage among some analysts.
- Over the last year, ET has outperformed the S&P 500 while crude oil has declined 21.5%, suggesting investor confidence.
- Caution demands investors revisit the distribution cut in late October 2020.
- Cash flow, debt burdens, and distribution coverage are substantially improved, and distributions have been restored and even increased recently.
- I recommend long-term income investors buy ET at current market prices.
Dilok Klaisataporn
Background
Energy Transfer LP (NYSE:ET) is a limited partnership and as such pays most profits to unit holders in the form of distributions. These distributions are similar to corporate dividends, but they are treated differently for tax purposes. Limited partnerships like ET often attract income and conservative investors seeking reliable returns with limited risk.
ET stands out amongst its midstream peers with rapid growth not only by building new assets, but also by mergers and acquisitions. Rapid growth has, at times, led to concerns regarding excessive debt among some analysts.
Historic Performance
1-Year Performance vs. S&P 500
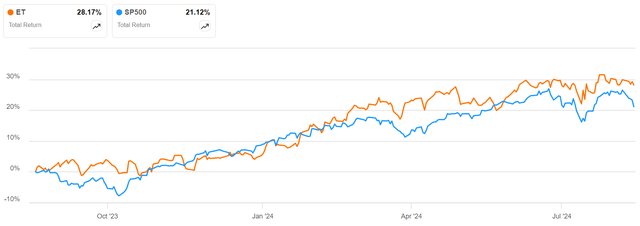
Over the last year, ET performed very well with a total return of 28% exceeding that of the S&P 500 by just over 7%.
1-Year Performance vs. Oil
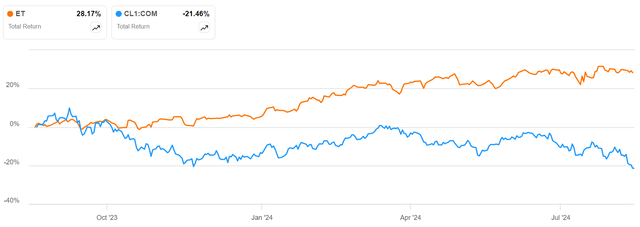
Strikingly, ET has outperformed the S&P 500 while crude oil has declined 21.5% indicating substantial investor confidence. However, long-term ET performance vs. oil may not support recent investor confidence.
Long-Term Performance vs. Oil
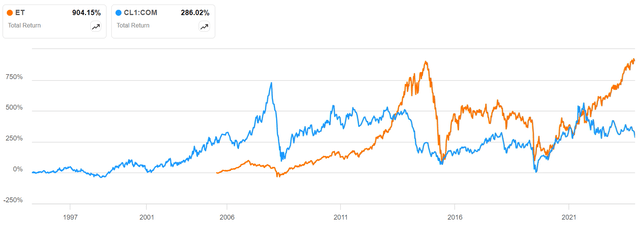
Since 2006, crude oil has suffered three notable downward cycles: the 2008 financial crisis, the 2014 shale boom, and the 2020 pandemic downturn. In 2008 and 2020, ET performance roughly tracked that of crude oil. However, in mid-2014, ET initially continued to rise for about two months as oil fell. Ultimately, ET declined sharply to reach its lowest point concurrently with oil in early 2016.
So far, it appears as though investors expect ET to resist the current downward pressure of falling oil and even broader economic concerns including weakening growth and possible recession.
Distribution History
Energy Transfer’s investor confidence and the stock’s forward performance are largely dependent on strong distributions.
Long-Term Distribution History
ET has rewarded investors with mostly consistent and growing distributions over nearly twenty years. The extraordinary exception is the 50% dividend reduction in late October 2020.
In early November 2020, ET’s CFO Thomas E. Long discussed the distribution cut as follows:
The reduction of the distribution is a proactive decision to strategically accelerate debt reduction as we continue to focus on achieving our leverage target of 4 times to 4.5 times on a rating agency basis and a solid investment grade rating. We expect that the distribution reduction will result in approximately $1.7 billion of additional cash flow on an annualized basis that will be directly used to pay down debt balances and maturities.
Incidentally, Thomas E. Long has since advanced to become ET’s co-Chief Executive Officer.
Debt and Cash Flow
With current downward pressure from both sinking oil and a possible economic downturn, many investors would rightly question ET’s ability to support its distributions going forward. Is ET a safer investment now than it was in early 2020? Has current management been including Mr. Long improved ET’s financial strength since late 2020?
Energy Transfer’s most recent investor presentation highlights several improvements. In June 2024, ET’s Sr. Unsecured debt rating was upgraded by S&P and Fitch to BBB with a stable outlook while Moody’s upgraded to Baa2. Further, Energy Transfer’s leverage ratios are now in the lower half of its 4.0-4.5x target.
However, Energy Transfer has continued to grow by building out its own operations and through mergers and acquisitions; net debt has actually increased since 2020. Therefore, it might be most helpful to examine net debt and interest expenses in relation to unlevered free cash flow.
Net Debt & Unlevered Free Cash Flow
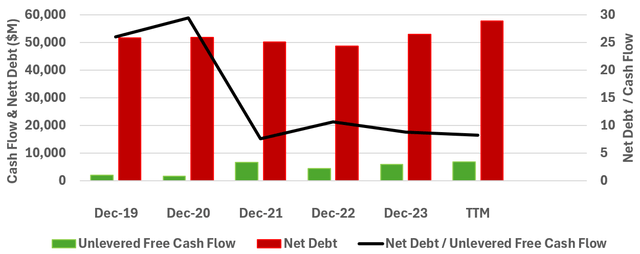
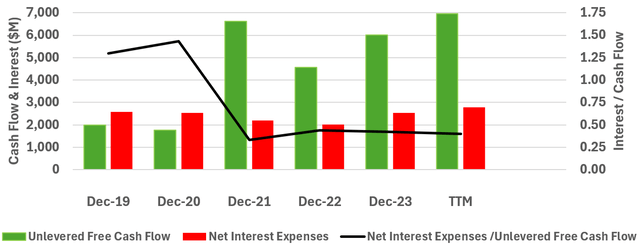
Since FY2020, net debt has increased by about 11% to almost $58B. However, over the same interval, unlevered free cash flow has increased almost 300% to nearly $7B. Consequently, the ratio of net debt to unlevered free cash flow has improved from approximately 29 to 8.
Net Interest Expenses & Unlevered Free Cash Flow
In FY2020 net interest expenses of about $2.5B exceeded unlevered free cash flow of about $1.8B by $765M. Growing concern by ET management, creditors, and investors was rightly justified. However, over the last twelve months, net interest expenses of about $2.8B were well covered by unlevered free cash flow of about $7B. Correspondingly, the ratio of net interest expenses to unlevered free cash flow has decreased from 1.4 in FY2020 to 0.4 over the last twelve months.
Distribution Safety
In the first quarter of 2022, ET began a series of distribution increases ultimately restoring and surpassing the pre-cut quarterly distribution of $0.305. Most recently, Energy Transfer raised its quarterly cash distribution to $0.32 per unit.
Commonly accepted wisdom suggests that a distribution that has recently been increased is a safe distribution. However, I remain cautious. Let’s continue our review of ET by examining its distribution coverage ratio in relation to cash flows.
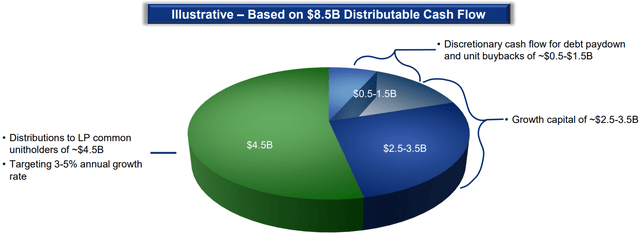
Energy Transfer’s most recent investor presentation provided the following distributable cash flow projection.
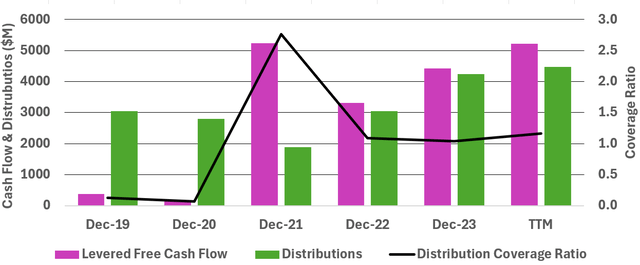
Based on these data, a distribution coverage ratio of $8.5B/$4.5B or 1.9 is suggested. However, I would prefer to calculate distribution coverage with relation to levered free cash flow; this approach is more rigorous as it accounts for total capex and financing expenses.
Distributions and Levered Free Cash Flow
Based on the FY2020 distribution coverage ratio (0.07), I would sell ET like it was on fire; it appears as if the distribution cut was absolutely necessary. However, since FY2022, the distribution coverage ratio has been steady at just over one. As the partnership agreement requires ET to distribute all available cash to unitholders, just over one is the bullseye.
Valuation & Distribution Yield
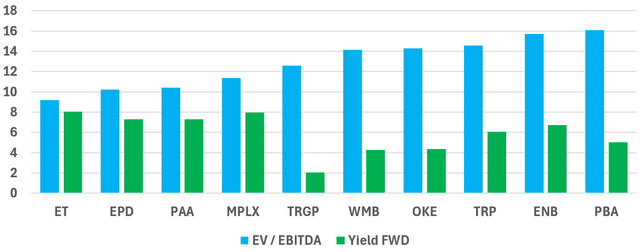
EV/EBITDA and forward yield of Energy Transfer and its nine largest peers are plotted below.
EV/EBITDA and Forward Yield
Based on these data, ET is most favorably valued amongst its peers while also offering the best forward yield (8.1%).
ET: EV/EBITDA
Based on EV/EBITDA, ET is near its five-year high. However, considering robust cash flows, improved financial strength, and healthy distribution coverage, ET could be considered an excellent value.
Investor Takeaways
Energy Transfer’s relatively low valuation compared to its peers is likely related to lingering market caution regarding excess debt and the 2020 distribution cut. Based on improved cash flow-to-debt ratios and solid distribution coverage, I conclude that caution is not supported by the current data.
I recommend long-term income investors buy ET at current market prices.
Caution, though very often wasted is a good risk to take. – Henry Wheeler Shaw, American humorist and writer.
Analyst’s Disclosure: I/we have no stock, option or similar derivative position in any of the companies mentioned, but may initiate a beneficial Long position through a purchase of the stock, or the purchase of call options or similar derivatives in ET over the next 72 hours. I wrote this article myself, and it expresses my own opinions. I am not receiving compensation for it (other than from Seeking Alpha). I have no business relationship with any company whose stock is mentioned in this article.
Seeking Alpha’s Disclosure: Past performance is no guarantee of future results. No recommendation or advice is being given as to whether any investment is suitable for a particular investor. Any views or opinions expressed above may not reflect those of Seeking Alpha as a whole. Seeking Alpha is not a licensed securities dealer, broker or US investment adviser or investment bank. Our analysts are third party authors that include both professional investors and individual investors who may not be licensed or certified by any institute or regulatory body.

