Summary:
- Eli Lilly has surged 58% in 2024, driven by breakthrough weight-loss drugs and strong earnings, with shares now trading above $900.
- Despite valuation concerns, LLY’s high growth rate and reliable earnings make it a buy, supported by strong Q2 results and raised guidance.
- Key risks include competition and production challenges, but EPS forecasts remain robust, with potential for $30 EPS by 2026.
- The technical chart shows consolidation, but a breakout above $970 could lead to a bullish move towards $1200, reinforcing the buy rating.
wellesenterprises
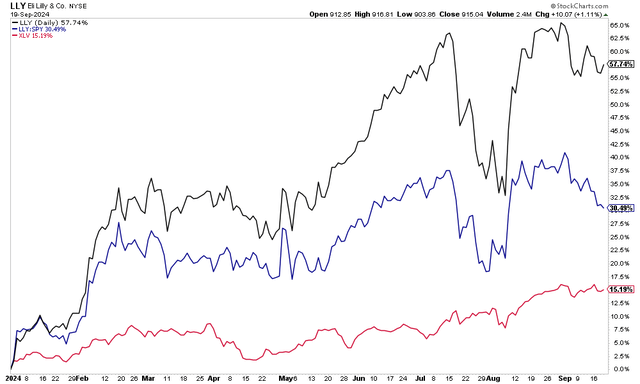
Shares of Eli Lilly (NYSE:LLY) have soared another 58% so far in 2024. The rally extends a bull market in the stock of the world’s most valuable pharmaceutical company, driven by ongoing optimism and real earnings growth due to its breakthrough drugs, namely its weight-loss-related products.
With shares now trading north of $900, the valuation multiple is sometimes called into question. I will lay out, however, that with a high growth rate and reliable and high-quality earnings, this stock is still one to own. LLY’s chart shows slower momentum, but it’s actually a common feature before previous periodic upward thrusts.
Big picture, LLY has helped power the S&P 500 Select Sector SPDR Healthcare Sector ETF (XLV) to new highs in recent weeks, even with LLY’s price consolidation. I reiterate a buy rating on the high-growth stock and will outline key dates to keep on your calendar and price points to monitor on the chart.
LLY Outpacing the S&P 500 in 2024, Lifting the Healthcare Sector
Back in August, LLY reported a very strong set of quarterly results. Q2 non-GAAP EPS of $3.92 topped the Wall Street estimate of $2.76 while revenue of $11.3 billion, up 36% from year-ago levels, was a material $1.33 billion beat. Driving the solid top-line figure were healthy sales from its diabetes drug Mounjaro and GLP-1 weight-loss drug Zepbound.
Along with the top- and bottom-line beats, LLY’s management team raised its FY 2024 guidance by $3 billion to a range of $45.4 billion to $46.6 billion. Adjusted EPS is now seen in the range of $16.10 to $16.60. Strong manufacturing capacity and successful international drug launches were catalysts for the more sanguine operational outlook.
Looking closer at its key drugs, Mounjaro sales tripled from the same quarter in 2023, hitting $3.09 billion last quarter. Zepbound, meanwhile, notched $1.24 billion in Q2 sales after hitting the market earlier in 2024. Supply issues remain in the spotlight, but LLY noted that production logistics turned better in the quarter as it continued to invest heavily in such capabilities.
Shares soared by 9.5% in the session that followed; it was LLY’s fifth post-earnings rally out of the last six reports. Looking ahead, the options market prices in a 5.4% earnings-related stock price swing after its October report, according to data from Option Research & Technology Services (ORATS). Seeking Alpha data reveal that the Indiana-based mega-cap has beaten EPS estimates in each of the past five quarters, and the Q3 EPS consensus forecast is $4.50 (non-GAAP).
Key risks include increased competition from fellow drugmakers such as Novo Nordisk (NVO) and increased sales of non-branded compounded GLP-1s. LLY must also keep up its production capabilities to meet demand for its products. Of course, any negative news regarding GLP-1 side effects or adverse FDA decisions could weigh on this high-P/E stock. A recent report noted that LLY is requesting access to the medical records of those taking compounded weight-loss medications due to safety reasons – I take this as a sign that the compounded versions of GLP-1s could be a legitimate threat in the quarters ahead, so it’s something to monitor closely.
There are also emerging signs of an all-out price war between Lilly and Novo as they seek to gain market share as more insurance providers cover Zepbound and Novo’s Wegovy. LLY recently introduced a $399 vial version of its drug, undercutting Wegovy. Novo also increased its rebate on its medication from 35% to 51%.
The price battle comes as Novo confirmed some safety issues after the latest tests of its next-generation weight-loss drug pipeline. LLY rose on that news – further evidence that it’s a match-play situation between the US and Danish drugmakers.
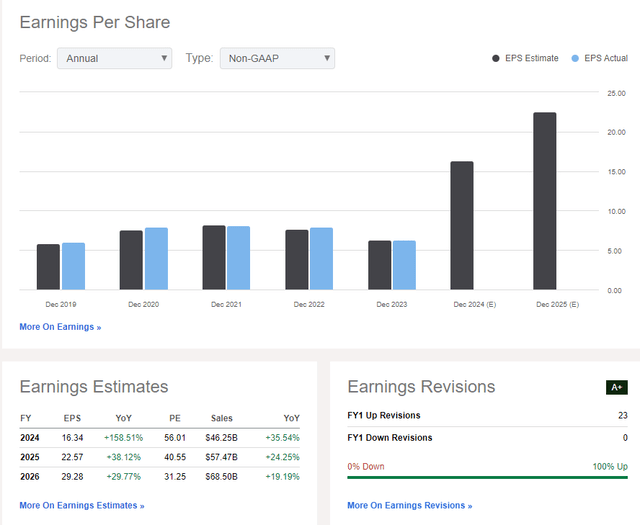
On the earnings outlook, analysts now expect more than $16 of operating EPS in the current year, a nearly 160% year-on-year increase, while out-year forecasts show per-share earnings surpassing $22. FY 2024 profit forecasts have jumped from my previous report in the second quarter following the strong Q2 report.
EPS could then approach $30 by 2026 as revenue growth eases from 35% to the high teens annually. LLY continues to invest heavily in its business, evidenced by negative free cash flow per share over the past 12 months.
LLY: Revenue, Earnings, EPS Revision Forecasts and Trends
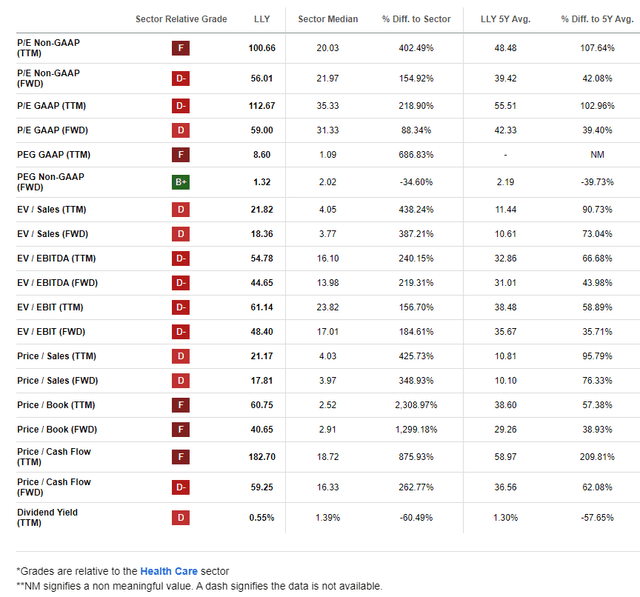
On valuation, LLY’s PEG ratio has actually retreated from when I last analyzed the stock. At 1.32x, it’s now about 40% below the five-year average. If we assume a normalized EPS growth rate of 20% and a below-average PEG of just 2.0, then the P/E should be near 40. Assuming $25 of forward EPS by the middle of next year, then a $1000 price objective remains absolutely in play.
Using FY 2026 estimates of $29 of non-GAAP EPS and a lower 35x P/E, then we arrive at a similar intrinsic value target. I concede that even its future price-to-sales multiple is very lofty, however, so LLY needs to continue to deliver on the bottom line.
LLY: Premium Valuation Metrics Justified By High Realized Profit Growth
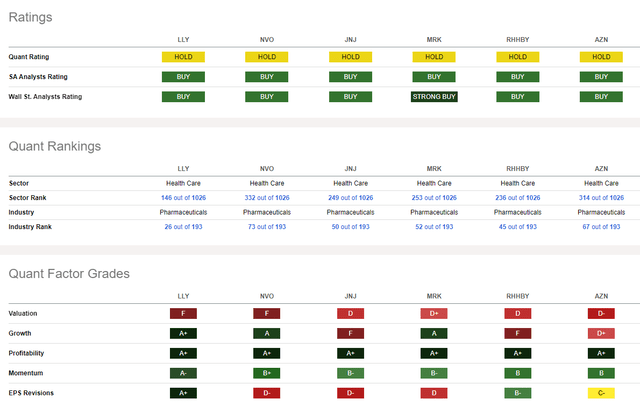
Compared to its peers, LLY features a weak valuation rating, but that is justified by high realized and forecasted profit increases. The $824 billion market cap company sports an industry-leading growth grade, while its profitability metrics are likewise best-in-class.
Share price momentum has eased just modestly in the last few months, but that’s common to see after periods of strong rallies. Finally, sellside EPS revisions have been decidedly to the bullish side in the past 90 days as we approach the Q3 report.
Competitor Analysis
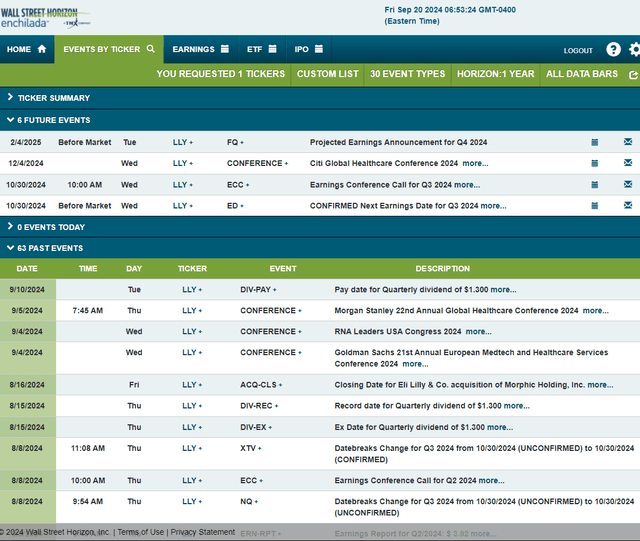
Looking ahead, corporate event data provided by Wall Street Horizon shows a confirmed Q3 2024 earnings date of Wednesday, October 30 BMO with a conference call later that morning. You can listen live here.
Its management team is then slated to present at the Citi Global Healthcare Conference 2024 in early December.
Corporate Event Risk Calendar
The Technical Take
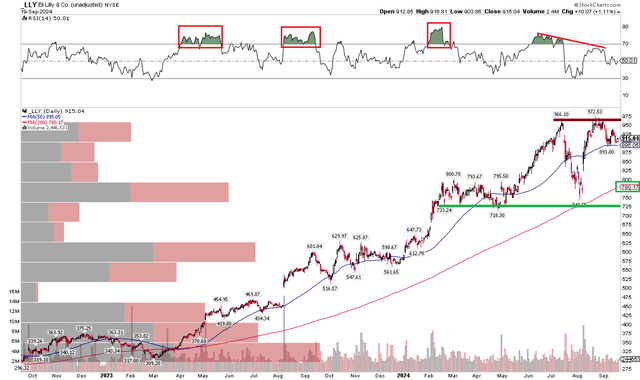
While I remain bullish on LLY, the technical chart is less impressive compared to earlier this year. Notice in the graph below that the pharma stock may have entered a trading range with resistance around $970 and support down in the $720 to $750 range. With a lower high in the RSI momentum oscillator at the top of the chart, it’s clear that upward price thrusts have been less impressive than several quarters ago.
But take a look at the long-term 200-day moving average – it’s rising in its slope, suggesting that the bulls remain in control of the primary trend. In the near term, LLY has attracted some buyers at the 50dma. Bigger picture, I found that LLY tends to consolidate for many weeks after stretches of excessive RSI momentum, so perhaps we see the stock keep consolidating ahead of next month’s earnings event.
A breakout above the all-time high would result in the triggering of a bullish upside measured move price objective to just below $1200 based on the height of the current trading range – perhaps that happens after the October report.
LLY: Shares Consolidating Following A Strong Q2 Rally
The Bottom Line
I have a buy rating on LLY. I see this high-growth market leader as reasonably valued with rising EPS estimates as it continues to deliver on big sales and profits related to its weight-loss drugs. The chart remains generally constructive, with key resistance in the mid- to high-$900s.
Analyst’s Disclosure: I/we have no stock, option or similar derivative position in any of the companies mentioned, and no plans to initiate any such positions within the next 72 hours. I wrote this article myself, and it expresses my own opinions. I am not receiving compensation for it (other than from Seeking Alpha). I have no business relationship with any company whose stock is mentioned in this article.
Seeking Alpha’s Disclosure: Past performance is no guarantee of future results. No recommendation or advice is being given as to whether any investment is suitable for a particular investor. Any views or opinions expressed above may not reflect those of Seeking Alpha as a whole. Seeking Alpha is not a licensed securities dealer, broker or US investment adviser or investment bank. Our analysts are third party authors that include both professional investors and individual investors who may not be licensed or certified by any institute or regulatory body.

