Summary:
- Despite Warren Buffett’s investment, Occidental Petroleum’s technical outlook is bearish across all time frames, with charts, moving averages, and indicators flashing red flags.
- OXY lacks significant support and is overvalued relative to its historical growth figures, making it a risky investment.
- Daily, weekly, and monthly analyses all confirm a downtrend with no signs of reversal, indicating further downside is likely.
- Occidental’s current valuation metrics suggest it is overvalued, and I initiate a strong sell rating due to its significant downtrend and lack of support.
jetcityimage
Thesis
It is no secret that Warren Buffett has placed a major bet on Occidental Petroleum Corporation (NYSE:OXY). But you should think again, if you are buying because he is buying. The near-term, intermediate-term, and long-term technical outlooks for Occidental are all bearish, with the end to the downtrend nowhere to be seen. The charts, moving averages, and key indicators are all flashing red flags for investors of all time frames. In addition, if you look into the fundamentals, Occidental is also overvalued relative to its historic growth figures. I have no idea why Buffett is so interested in Occidental, but in my view, investors should not touch this stock even with a ten-foot pole. I initiate Occidental at a strong sell rating.
Daily Analysis
Chart Analysis
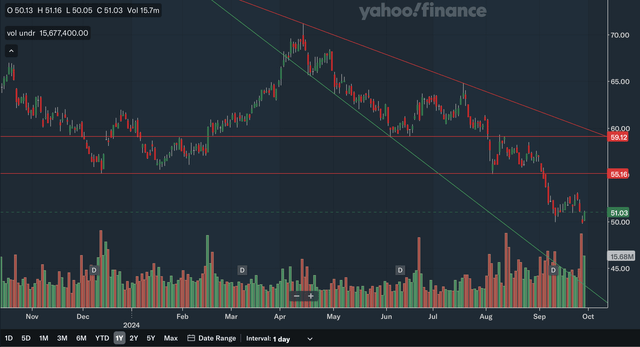
A first glance at the daily chart shows that Occidental has significantly more resistance overhead than it does support. The closest area of resistance I identified is in the mid-50s range, as that level has been bounced off from 3 times since the end of last year. The breakdown from that support level in late August reversed that area to become resistance. The next level of resistance would be at around 60 as that key area has been both support, in June, and resistance, in August. The downward sloping trend line should also be resistance as we head to 2025.
The only area of support I identified is a downward sloping support line. Downward sloping support lines are usually a weaker type of support and with it being over 10% below current levels and rapidly dropping, support will be quite minimal. Also, note that the largest volume spikes in recent months have all been bearish volume, indicating that the bears are clearly in control. Overall, from my daily chart analysis, it is clear that the near term trend is down.
Moving Average Analysis
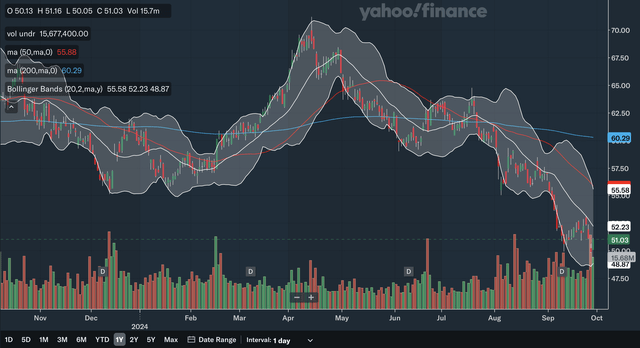
A moving average analysis of Occidental also shows a highly bearish near term situation. The 50-day SMA and 200 day SMA formed a death cross in July, and since then, the stock has continued to plunge. Currently, the stock is far underneath both the 50-day SMA and the 200-day SMA, showing that it may be oversold. However, if you look at the Bollinger Bands, since the 20-day centre line acts as resistance in a downtrend, resistance is much nearer than the SMAs show. The bounce off the centre line earlier this month confirms that Occidental is in a near term downtrend that does not have a sign of ending yet. In my view, although Occidental may be slightly oversold at current levels, the moving averages and Bollinger Bands shows a concerning outlook technically for Occidental.
Indicator Analysis
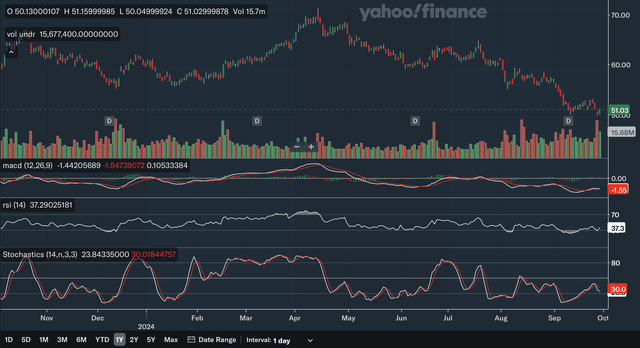
Currently, the MACD line is above the signal line, which is a positive signal. However, as you can see, the MACD line has failed to advance significantly after breaking the signal line earlier this month. That is demonstrated by the largely flat MACD histogram. This shows that the near term downtrend may just be pausing before continuing, rather than any significant reversal. The MACD also has confirmed all the troughs in the stock in the past few months, as there is no positive divergence to save Occidental stock. Lower troughs in the stock in June, August, and September were all confirmed by lower troughs in the MACD. For the RSI, it is currently at 37.3 which is quite a low reading, nearing oversold territory. The RSI also confirms a downtrend, as the drop to new lows in September occurred with the RSI dipping below the trough set in August.
Lastly, for the stochastics, the %K line is currently under the %D line, showing weakness. The recent crossover did not take place in the overbought 80 area, but nonetheless shows bears are relatively in control. The stochastics has also confirmed the downtrend, as its lower highs and lower troughs have generally coincided with lower highs and lower troughs in the stock. As you can see, the attempt for a higher high in the stock in July was not confirmed by the stochastics and later that short-term rally failed. Overall, from my analysis, the near term technical outlook is highly bearish as all three key indicators have confirmed the downtrend.
Daily Analysis Takeaway
The near term technical picture for Occidental is highly bearish as chart, moving average, and indicator analyses converge at the conclusion that further downside is likely. Occidental lacks any major support in the near term and with bears clearly in control, it could get ugly in the near future.
Weekly Analysis
Chart Analysis
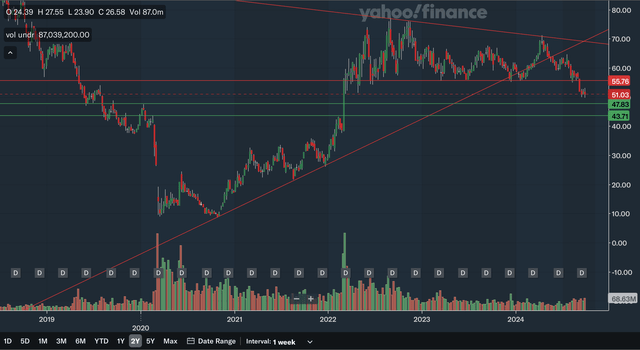
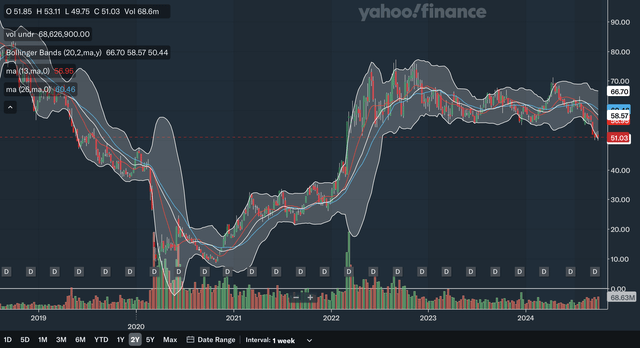
A look at the weekly chart shows a potential concerning intermediate term outlook for Occidental. The stock just recently broke down from a major support line that held all the way back in 2022. This zone will likely be significant resistance moving forward. Earlier this year, the upward sloping trend line that stretches back to 2020 was also broken, showing that the intermediate term uptrend was over. Although this line’s resistance is moving out of range, the break of line earlier this year should have been an early warning sign. In addition, there is also a downward sloping trend line that developed since 2022 that will be the next closest zone of resistance for Occidental. The two areas of support that I identified with the green line in the high 40s and low 40s are relatively weaker as they have not been bounced from since 2020 and 2022 respectively. Occidental will likely test these levels in the near future. If the stock does break these support levels, there does not seem to be significant support anywhere near current levels. Overall, the recent breakdown from the significant trend line and support zone are major red flags for the intermediate term technical outlook, as the remaining few support levels are relatively weak.
Moving Average Analysis
A look at the weekly moving averages shows that Occidental has major overhead resistance. In addition, the 13 week and 26 week SMAs recently had a bearish crossover earlier this year and the stock has basically not stopped dropping since. The stock did, however, hit the lower band on the Bollinger Bands, showing that it may be potentially oversold in the nearer term. Currently, the stock is below the 13-week SMA, the 26-week SMA, and the 20-week Bollinger Band centre line. All three lines are accelerating their downward trajectory and will continue to weigh on Occidental. Despite being a bit oversold according to the Bollinger Bands, in my view, the moving averages once again shows a worrying outlook.
Indicator Analysis
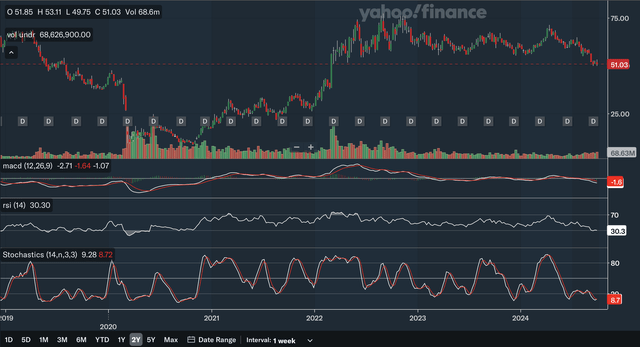
The MACD line broke below the signal line earlier this year and since then, the gap between the lines have increased, showing the acceleration of the downtrend. The MACD also confirms this year’s downtrend, as the MACD hit its lowest level since 2020 this year and seems to be continuing to drop. As for the RSI, it is currently at 30.3 potentially indicating the stock is oversold but as we know, a stock can remain oversold for long periods and continue to decline. Similar to the MACD, the RSI also confirms this year’s downtrend, as the RSI has hit the lowest level since 2020.
Lastly, the stochastics does show some near term positives for Occidental as the %K line has just broke the %D line within the oversold 20 zone by the slightest margin. This is a bullish signal. However, as you can see a very similar breakout in the stochastics occurred earlier this year and the rally very soon fizzled out with the downtrend resuming. Therefore, I would take the current bullish signal with a grain of salt and wait for a more clear and significant signal before being near term bullish. Overall, I believe the MACD and RSI confirms that Occidental is in an intermediate term downtrend. The stochastics should be monitored to see if the recent bullish crossover is a false alarm.
Weekly Analysis Takeaway
As a whole, the weekly analysis shows that the intermediate technical outlook for Occidental is a negative one. While there are some minor bullish signals such as the oversold signal in the Bollinger Bands and the bullish crossover in the stochastics, the majority of my analysis shows that Occidental is likely to decline in the intermediate term.
Monthly Analysis
Chart Analysis
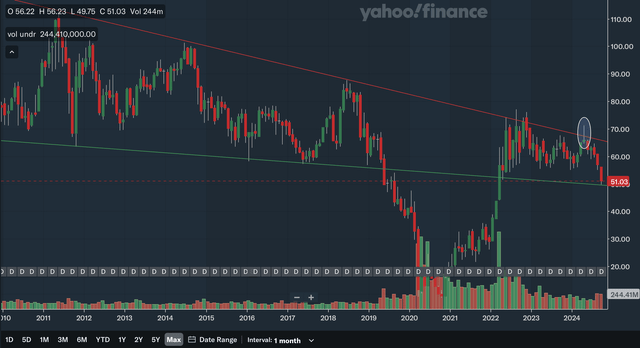
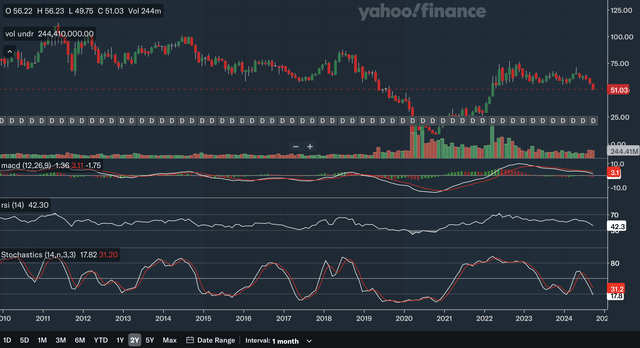
As you can see above, Occidental is in a longer-term downtrend. The downward sloping trend line has been in effect since 2011 and that line has been touched a total of 5 times. More recently, in 2022 there were a series of attempts by Occidental to break this trend line but ultimately failed to do so. This year, there was another attempt to break above the trend line, but once again the breakout failed and the stock has plunged as a result. I have circled the failed breakout candle as it is also a gravestone doji showing the significant reversal occurring.
There is a downward sloping support line that provided support all the way back to 2012, excluding 2019-2022. Currently, it seems as though the stock is experiencing support at this support line. But be aware since this support line is sloping downwards and was previously broken in 2019 showing this support is relatively weak. Overall, it is clear that Occidental is in a long-term downtrend and the recent failed breakouts show the bears are clearly in control.
Moving Average Analysis
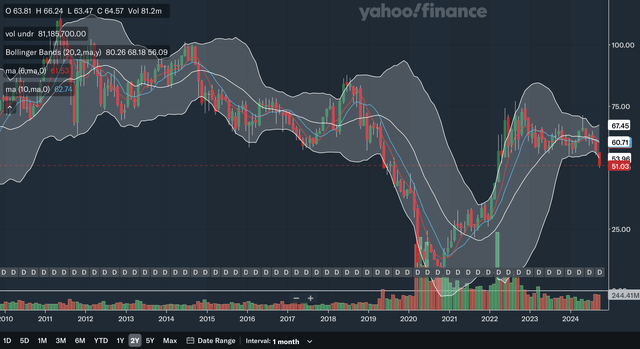
Currently, the 6 month and the 10 month SMAs are basically at the same level, with the stock trading beneath both of them. If you look very closely, the 10-month SMA is slightly above the 6-month SMA, and that is a bearish crossover. The stock is currently at the lower band of the Bollinger Bands, signalling that it is oversold and may bounce in the short term. However, since the Bollinger Bands are in an area of low volatility currently, it may signal that the bands will expand with volatility increasing in the upcoming years. The stock also has both the SMAs and the Bollinger Band 20 month centre line weighing on it. From my moving average analysis, the longer-term outlook is net negative.
Indicator Analysis
The MACD line broke below the signal line in early 2023 signalling the start of a long-term downtrend. The spread between the lines have been relatively small, indicating some hesitation by the bears, but as of late, the spread has started to widen as the downtrend has accelerated this year. As for the RSI, after flashing an overbought signal in 2022, it has slumped down into the low 40s. The failure of the RSI to remain above 50 showed that the uptrend momentum was gone, and the stock was at least going to drift sideways or drop.
Lastly, for the stochastics, earlier this year, the %K broke below the %D indicating the beginning of a longer-term downtrend. Even though the crossover did not take place within the overbought 80 zone I would still consider this to be a valid signal as the spread between the %K and %D was relatively large prior to the signal. Overall, in my view, these three key indicators converge at the conclusion that Occidental is in a longer-term downtrend.
Monthly Analysis Takeaway
Like the daily and weekly analyses, there is not much to like about Occidental technically. The charting, moving average, and indicator analyses converge at the conclusion, that Occidental is in a near term, intermediate term, and long-term downtrend with no end in sight.
Fundamentals & Valuation
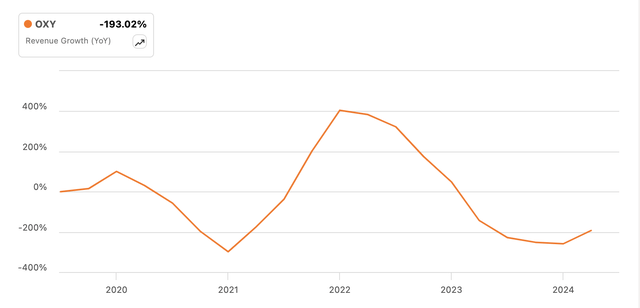
For their 2024 Q2 earnings, Occidental reported an EPS of $1.03 that beat expectations by $0.26. That represents a 2.2% increase YoY. They also reported revenue of $6.88 billion, representing a beat of $232 million. However, as you can see in the above chart, revenue growth for Occidental is extremely unhealthy by historic standards. Other highlights in their earnings included operating cash flow of $2.4 billion, and they maintained their full-year production guidance.
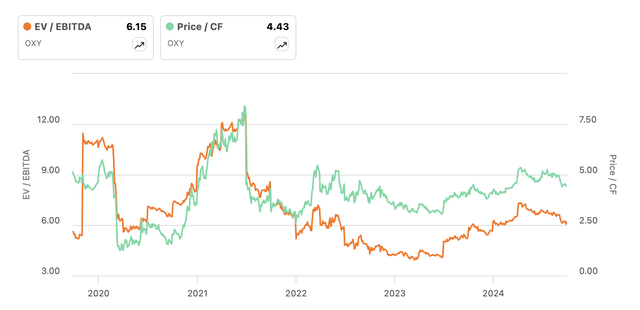
As you can see in the above chart, Occidental’s EV/EBITDA and P/CF ratios are not at extremely low levels, as the multiples have rebounded significantly from their 2023 troughs. The EV/EBITDA has increased from below 4.5 to above 6, while the P/CF ratio rose from below 3.75 to now above 4.4. A quick glance at the revenue growth chart above clearly shows that Occidental is overvalued by historic standards. The current revenue growth rate is very similar to that in mid-2023, while the EV/EBITDA and P/FCF have increased significantly since that period. Furthermore, if you look at the EV/EBITDA, in 2022 it was at the same levels as present day while the revenue growth rate in 2022 was much better. It is also a very similar story for P/FCF as the current levels of 4.43 were also seen in 2022 when growth was much better. As another reference point, in late 2019, the EV/EBITDA and P/FCF were relatively close to the levels seen currently. Since then, as shown above, the revenue growth rate dropped 193% into negative territory while the multiples are near levels seen in late 2019. In my opinion, Occidental would be more fairly valued at nearer to its 2023 trough than it is at current levels. From my analysis, it is clear that Occidental is overvalued relative to its growth. In addition, Seeking Alpha currently rates Occidental as a C- in valuation, showing that Occidental is mildly overvalued.
Conclusion
It is no secret that Buffett looks at the very long term when evaluating investments and to him, that may be a 30+ years investment horizon and Occidental may look better in that time frame. But for me and likely most investors, 10+ years is quite a long time. From my short, intermediate, and longer-term analyses, Occidental is not dead money. It is far worse than dead money. It is in a significant downtrend, and there is nothing to indicate that the downtrend has signs of easing. In addition, as discussed above, Occidental is not valued cheaply either. If you are following Buffett into this stock, you are doing so at a major risk. I initiate Occidental at a strong sell rating.
Analyst’s Disclosure: I/we have no stock, option or similar derivative position in any of the companies mentioned, and no plans to initiate any such positions within the next 72 hours. I wrote this article myself, and it expresses my own opinions. I am not receiving compensation for it (other than from Seeking Alpha). I have no business relationship with any company whose stock is mentioned in this article.
Seeking Alpha’s Disclosure: Past performance is no guarantee of future results. No recommendation or advice is being given as to whether any investment is suitable for a particular investor. Any views or opinions expressed above may not reflect those of Seeking Alpha as a whole. Seeking Alpha is not a licensed securities dealer, broker or US investment adviser or investment bank. Our analysts are third party authors that include both professional investors and individual investors who may not be licensed or certified by any institute or regulatory body.

