Summary:
- Despite impressive earnings and revenue growth, Nvidia Corporation’s stock has faced significant volatility and two-way price action, complicating the bullish longer-term bullish outlook.
- Key support levels to watch are $114.87 and $113.24; a break below $111.30 could lead to extended sideways consolidation.
- I have downgraded Nvidia from “strong buy” to “buy” due to recent downward price action, but a break above $131.26 could re-target all-time highs at $140.76.
serg3d
When I last covered Nvidia Corporation (NASDAQ:NVDA) with “Nvidia: Bull Flag Signals Another Major Breakout” on April 30th, 2024, the stock was experiencing a brief downside pullback after rallying by nearly 148.3% over the prior four-month period. However, given the immense size of the stock’s previous rally and the relatively brief period in which those incredible gains had materialized, it was not surprising to see that several readers commented with a healthy dose of skepticism regarding the stock’s true ability to complete another “repeat performance.”
In other words, the minor pullback seen in NVDA share prices during the prior six weeks amounted to just -22.3% when measured using the April 19th price troughs. For many, it looked as though this minor downside retracement was not enough to produce the type of corrective bearish move that might otherwise be required to properly address prior stock gains of almost 150%.
NVDA: Initial Bull Flag Chart Pattern Formation (Income Generator via Trading View)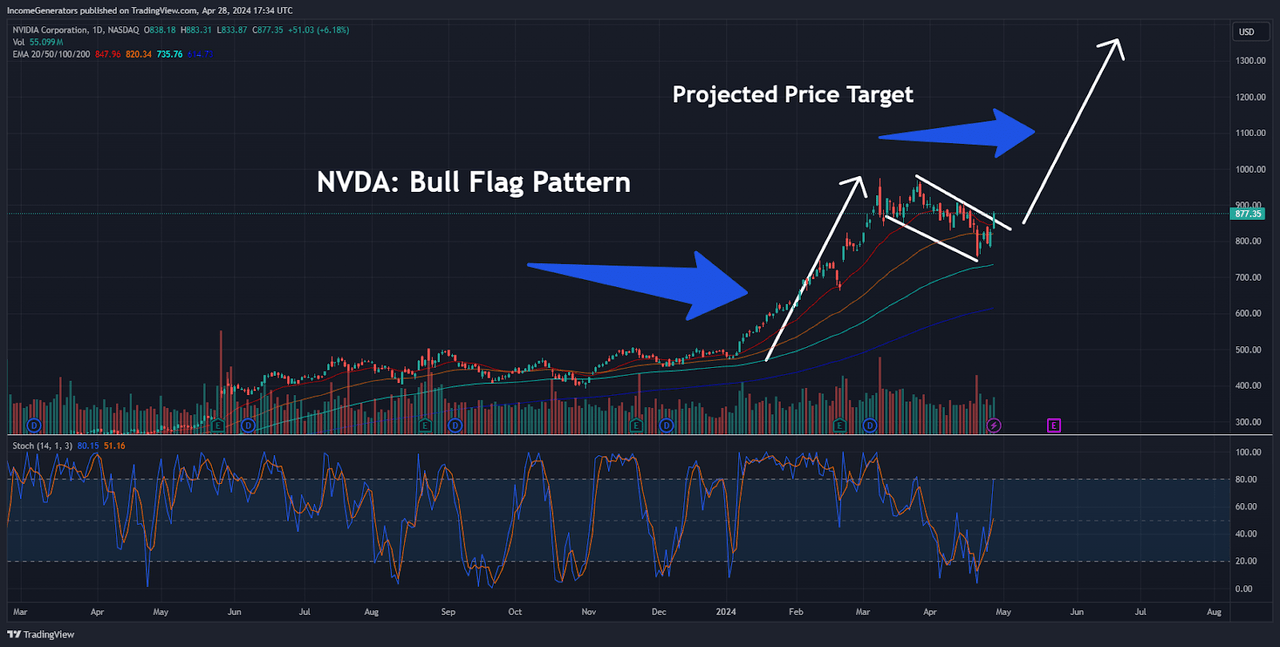
As the title suggests, the bullish chart outlook was based on the development of a nearly perfectly formed Bull Flag pattern (original chart is shown above for visual context). For anyone unfamiliar with the logical concepts that underlie this specific structural price formation, the essential idea is that a significant market rally initially creates a pole-like structure that is then followed by a brief period of downside retracement (in a pattern that is referred to as the “flag”). Once share prices break above this flag-like structure, the ultimate share price projection target is roughly equal to the distance of the original “pole” formation.
In the chart below, we can see how these projections ultimately unfolded in real-time markets:
NVDA: Eventual Price Rally into June 20th (Income Generator via Trading View)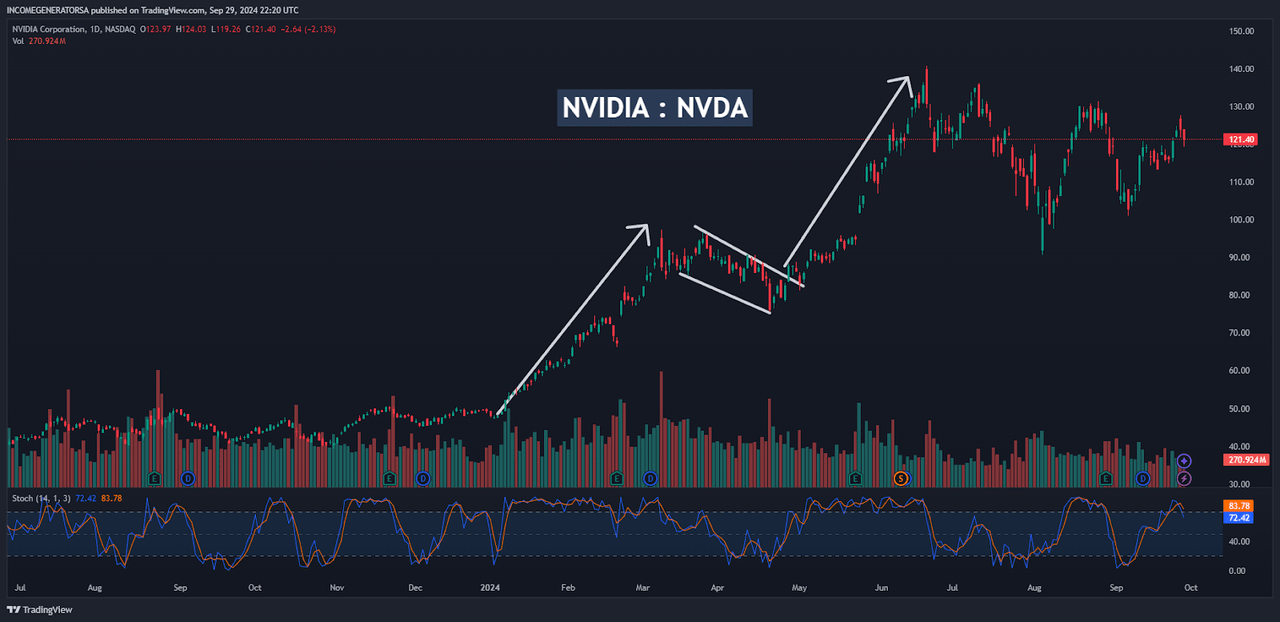
If nothing else, I think that these developments can be instructive in terms of the ways chart analysis strategies attempt to characterize and model investment behavior in the financial markets. Of course, these are not crystal-ball projections. However, we can see that the initial structural formations occurred over a 68-day period (January 3rd to March 11th) and resulted in a bullish trend wave equal to $50.08 in upward share price movement. As a result, this chart analysis method projected a final price target of $138.41 (April 26th high of $88.33 + $50.08), which was achieved on June 20th, 2024 (the same day the stock reached its all-time high) and missed the ultimate peak by a total of $2.35.
NVIDIA: Q2 Fiscal 2025 Earnings Figures (NVIDIA Earnings Presentation)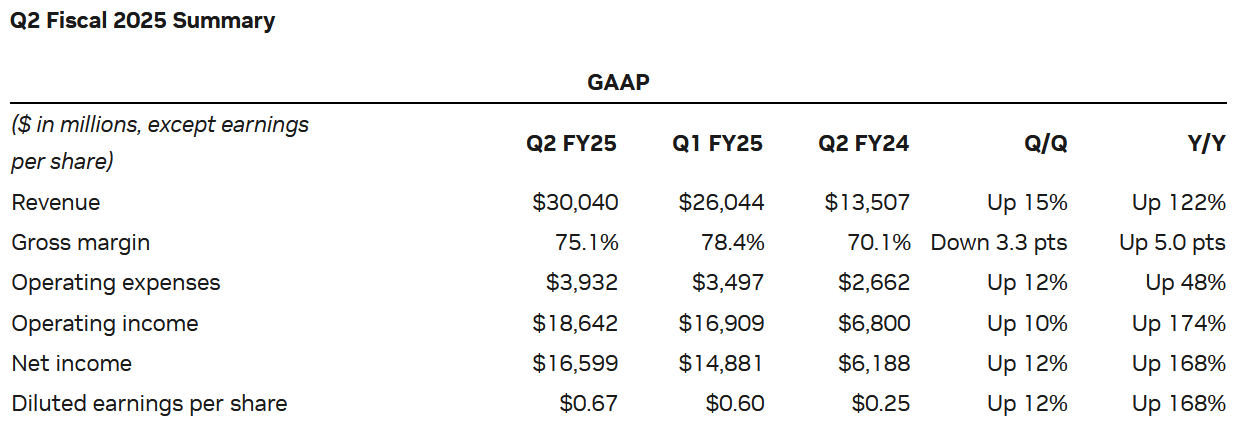
After the stock reached these elevated levels, share price action has been characterized by a marked increase in two-way volatility that has certainly complicated issues for bullish investors. Even more confusingly, downside price action continued even after the world’s most prominent GPU maker reported highly impressive quarterly earnings figures that surpassed analyst expectations by a wide margin.
For the fiscal second-quarter period, Nvidia recorded over $30 billion in revenue at growth rates of 122% on an annualized basis. Mind-bogglingly, this means that the company has now generated revenue growth of greater than 100% for four consecutive quarters. Moreover, the company reported guidance figures calling for $32.5 billion in revenues for the fiscal third-quarter (+/- 2%), which would indicate annualized growth rates of roughly 80% for the period.
NVIDIA: Q2 Fiscal 2025 Earnings Figures (NVIDIA Earnings Presentation)
Even more impressive were the company’s adjusted earnings figures, which came in at $0.68 per share (surpassing analyst estimates calling for $0.64 per share) and this shows an incredible annualized growth rate of 168% for the quarter. Overall, adjusted net income came in at $16.95 billion and Nvidia also authorized $50 billion in new share buybacks (even while the company still had $7.5 billion remaining from the previous buyback announcement).
In my view, the weakest notable area from the report can be found in the expected full-year margin figures. These were described as likely posting within a range near the “mid-70s,” so it seems at least plausible that the market could interpret this figure as a potential disappointment when compared to the previous consensus estimates of 76.4%. Overall, however, it remains difficult to explain the market reasoning behind the significant sell-off that has been seen in NVDA share prices over the last two to three months:
NVDA: Sequential Downtrend Price Movements (Income Generator via Trading View)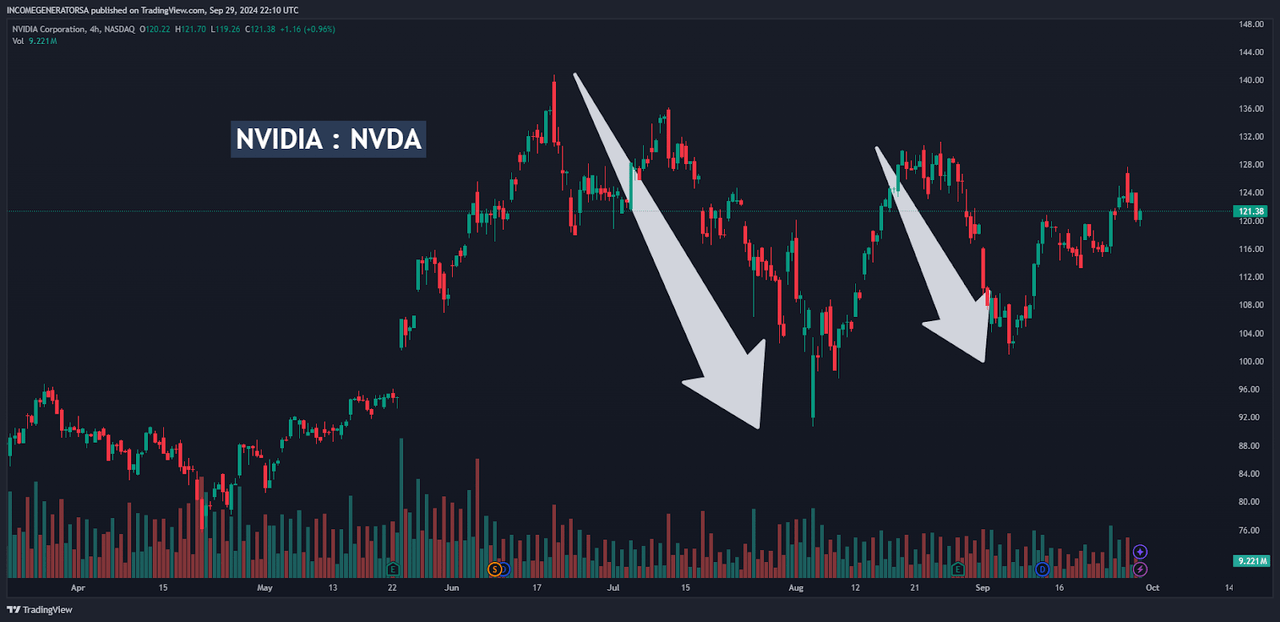
Clearly, Nvidia’s impressive quarterly results have not been rewarded by the market with higher share price valuations, and we have actually seen near-term lows develop below the $90.70 mark. During this period of time, massive share price declines unfolded in two separate bearish trend waves (first from the mid-June to early August trading period, then again from the end of August until the middle of September). Additionally, a significant downtrend line has started to develop during this entire trading period — and we are only recently seeing some potential evidence that this formation is starting to break to the topside:
NVDA: Key Trend Line Break (Income Generator via Trading View)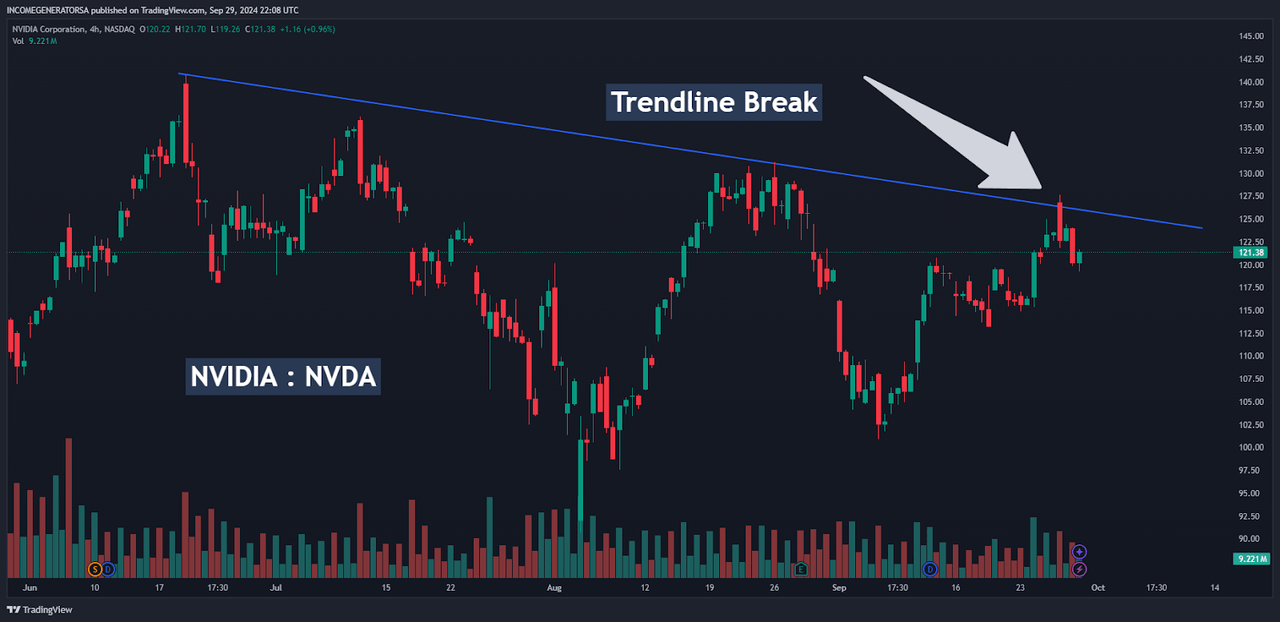
Of course, we have already started to see minor pullbacks from that recent upward technical event. However, if we can see a weekly share price close above this bearish formation level, we can begin to focus on the stock’s August 26th highs at $131.26 as the next viable bullish target:
NVDA: Key Support and Resistance Levels (Income Generator via Trading View)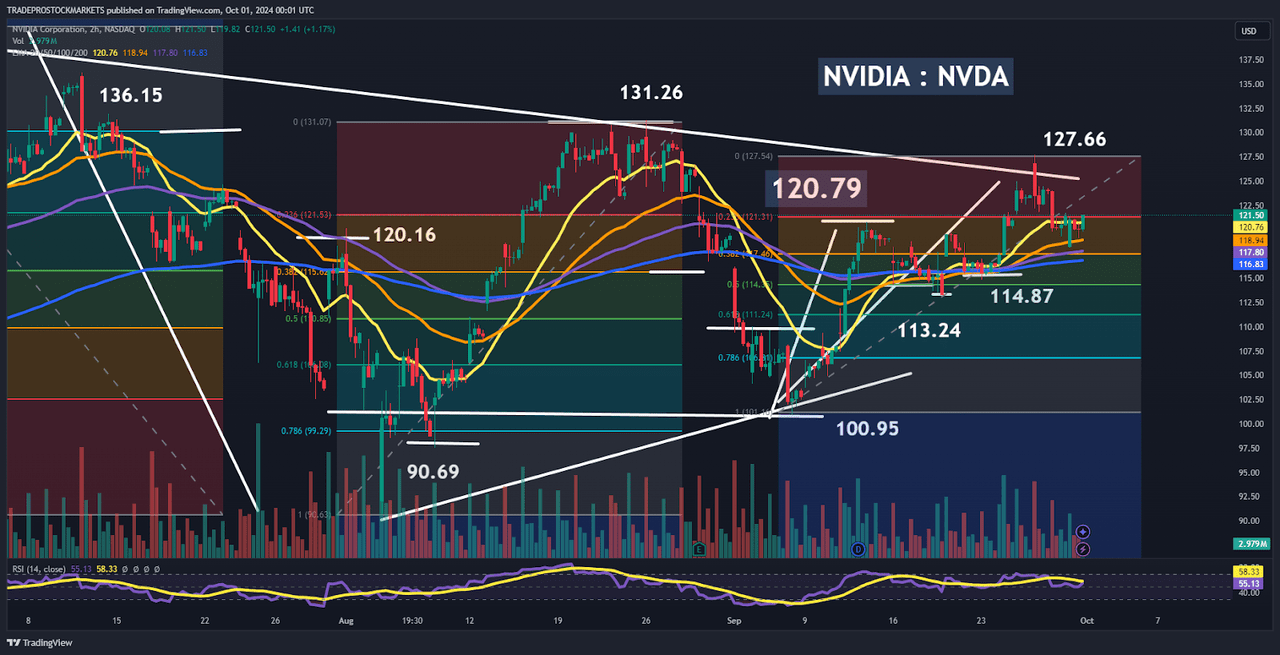
To the downside, key areas of support can now be found at $114.87 and $113.24 (initially). Then, if these areas are ultimately broken, the next regions of support would likely focus the market’s attention on NVDA’s major intermediate-term lows (currently located at $100.95 and $90.69). At this stage, the main questions surround the possibility that the stock’s recent trend line break at $127.66 may turn out to be a false bullish breakout to the topside.
When assessing the validity or accuracy of these types of bullish chart analysis signals, I will typically watch for price behavior that develops close to near-term support levels. In this case, I would avoid characterizing NVDA’s recent trend line break at $127.66 as a “false breakout” unless we see a clear break (and daily close) below the $114.87 lows from September 23rd. Downward from there, we can see minor historical support at the $113.24 lows from September 18th and the 61.8% Fibonacci retracement of the rally from $100.95 to $127.66 (which is located near $111.30).
NVDA: Daily Price Chart (Income Generator via Trading View)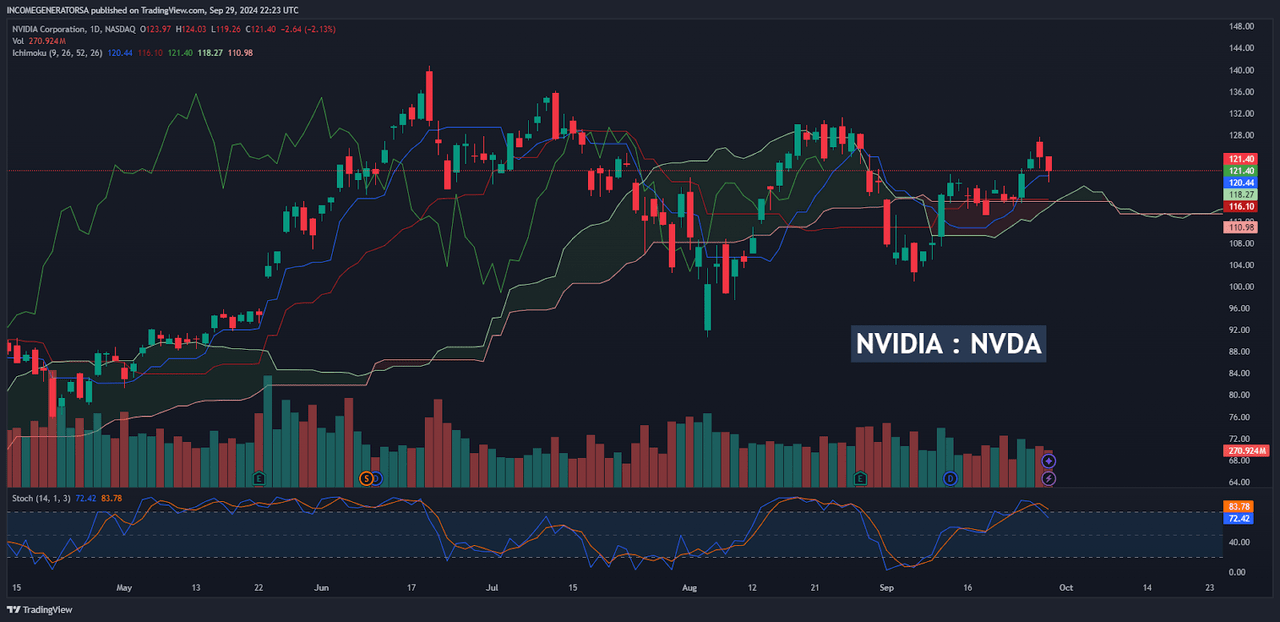
Finally, I would just like to emphasize that I am not developing a bearish bias on this stock. I am downgrading the “strong buy” rating to a “buy” rating because I think all of this recent downward price action (even in the face of highly impressive earnings performances) has made it apparent that price rallies similar to those seen during the first half of this year might be impossible to replicate.
Overall, an invalidation of the stock’s prior downtrend line from the June 20th all-time highs will show that the recent sequence of lower highs has come to an end. A clear upside break of the August 26th highs at $131.26 will then re-target the all-time highs, and I have a very hard time believing that market enthusiasm resulting from a new approach toward these levels would be very easy to stop (either through profit-taking from longs or from whatever market minority is actually prepared to start short-selling this ticker).
For these reasons, I do believe that a break of $131.26 will quickly force a re-test of the ultimate resistance level found at $140.76 and that this barrier is unlikely to remain intact much longer. For me to alter this outlook in a more substantial manner, I would need to see share prices break below the $111.30 Fibonacci support level mentioned previously. This would likely lead to a more extended period of sideways consolidation before the stock would be able to make another run toward the all-time highs.
Analyst’s Disclosure: I/we have a beneficial long position in the shares of NVDA either through stock ownership, options, or other derivatives. I wrote this article myself, and it expresses my own opinions. I am not receiving compensation for it (other than from Seeking Alpha). I have no business relationship with any company whose stock is mentioned in this article.
Seeking Alpha’s Disclosure: Past performance is no guarantee of future results. No recommendation or advice is being given as to whether any investment is suitable for a particular investor. Any views or opinions expressed above may not reflect those of Seeking Alpha as a whole. Seeking Alpha is not a licensed securities dealer, broker or US investment adviser or investment bank. Our analysts are third party authors that include both professional investors and individual investors who may not be licensed or certified by any institute or regulatory body.
