Summary:
- In recent years, Energy Transfer’s management has aligned the company’s operational and financial performance comparably to industry peers.
- Debt leverage, EBITDA growth, and the cash distribution yield is on par or superior to competitors. Energy Transfer isn’t taking business risks beyond those the entire peer group faces.
- Despite comparable fundamentals and strategies, Energy Transfer trades at a significantly lower EV/EBITDA multiple than peers, suggesting undervaluation and the probability for future multiple expansion.
- Energy Transfer common units represent a unique value proposition hiding in plain sight.
Adam Gault
Generally, I’m hesitant to be constructive on cyclical energy stocks trading around a five-year high. However, after breaking it down, I suspect Energy Transfer Partners (NYSE:ET) may be an exception to the rule.
Let’s investigate.
An Energy Transfer Investment Thesis
Over the past several years, Energy Transfer has transitioned its management style and financial results. On both counts, investors are enjoying steady performance. Now I’m not at all suggesting ET senior leadership changed their spots completely, but co-CEOs Tom Long and Mackie McCrea appear to have tamed the beast a bit.
When recent data is compared with peers, Energy Transfer stacks up quite well. Investors find:
-
sound debt leverage and a stable, investment grade credit rating
-
solid EBITDA growth
-
a superior cash distribution yield
-
a middle-of-the-fairway forward narrative
If this is true, then ET units should command valuation multiples commensurate with peers.
Nonetheless, we find Energy Transfer ranks towards the bottom of the EV-to-EBITDA crowd, several turns below the following industry peers:
-
Enterprise Products Partners (EPD)
-
Kinder Morgan Inc (KMI)
-
ONEOK Inc (OKE)
-
Williams Companies (WMB)
-
MPLX LP (MPLX)
At the core, my current investment thesis rests upon the foundation that if Energy Transfer walks and talks like its peers, then the common units, at some point in the future, should trade at a comparable valuation multiple to those same peers.
What’s standing in the way? I contend it’s investor sentiment. Yes, sentiment can take a long time to play out.
However, concurrent with the aforementioned, I also believe that over time, with very few exceptions, stock prices follow earnings and cash flow.
Let’s do some homework.
Debt Leverage / Credit Rating
A weak balance sheet used to be a problem for Energy Transfer. Several years ago, major credit rating agencies gave ET management a “get this fixed or else” memo. Subsequently, management did get the memo and straighten out the balance sheet.
It’s now aligned with peers.
The data sets below seek to make a broad cut. The objective is to demonstrate Energy Transfer compares favorably with larger peers.
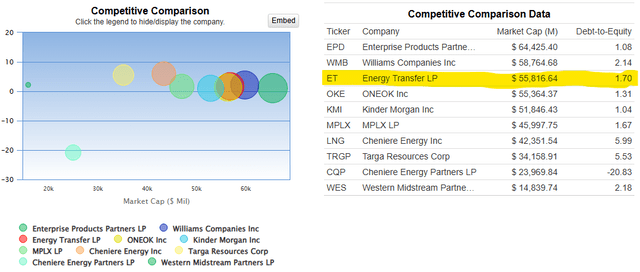
Here’s a chart highlighting debt-to-equity for a number of midstream players:
ET compares favorably with MPLX and Williams Companies. Enterprise Products, ONEOK, and Kinder Morgan enjoy lower ratios.
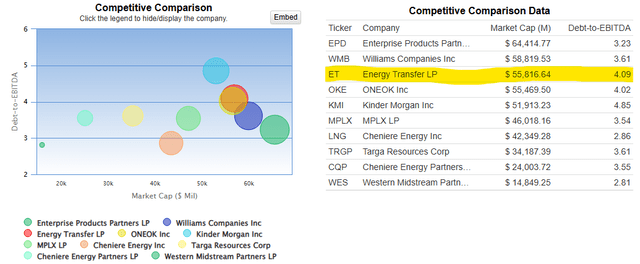
Here’s another chart highlighting debt-to-EBITDA:
In the pipeline space, debt-to-EBITDA is the general benchmark. Enterprise, Williams, and MPLX lead the pack with somewhat lower ratios. Energy Transfer, Kinder Morgan, and ONEOK are second tier.
Next, please see the table below. It shows the current S&P 500 credit rating for Energy Transfer and large peers:
|
Company |
S&P 500 Credit Rating |
|
Energy Transfer Partners |
BBB |
|
Enterprise Partners |
A- |
|
Kinder Morgan Inc |
BBB |
|
Williams Cos |
BBB |
|
ONEOK LP |
BBB |
|
MPLX |
BBB |
All companies have investment-grade BBB ratings except Enterprise Products Partners.
EBITDA Growth
Typically, midstream / pipeline companies consider the financial “coin of the realm” to be distributable cash flow and adjusted EBITDA.
In the table below, I selected adjusted EBITDA as the proxy by which to compare Energy Transfer versus peers. I recommend taking a moment to look through the figures and eyeball them for yourself.
Energy Transfer and Peers: 3-year EBITDA ($B) and 2024 YoY Growth
|
2022 EBITDA |
2023 EBITDA |
2024 EBITDA* |
2024 v 2023 |
|
|
Energy Transfer |
13.1 |
13.7 |
15.4 |
+12% |
|
Enterprise Partners |
9.3 |
9.3 |
9.7 |
+5% |
|
Kinder Morgan Inc |
7.5 |
7.6 |
8.2 |
+8% |
|
Williams Cos |
6.4 |
6.8 |
7.0 |
+3% |
|
ONEOK LP |
3.6 |
5.2 |
6.1 |
+17% |
|
MPLX |
5.8 |
6.3 |
6.8 |
+8% |
*2024 EBITDA provided via recent management guidance or consensus Street estimates. Historical data obtained from company earnings releases and quarterly SEC reports.
Sans ONEOK, Energy Transfer leads peers with expectations of a year-over-year 12 percent adjusted EBITDA bump. Notably, in September 2023, ONEOK completed a merger with Magellan Midstream Partners. This resulted in a modest 2023 vs 2022 EBITDA uplift, and materially higher year-over-year expectations for 2024.
High Cash Distribution Yield
In the third quarter 2020, Energy Transfer management halved annualized cash distributions. Unfortunately, despite the decision coming in the midst of pandemic fears, the reduction traumatized some investors.
After the cut, management promised to rebuild the distribution. Indeed, by the end of 2022, the distribution doubled and was equivalent to the pre-pandemic $1.22 payout.
Beginning in 2023, Energy Transfer management increased the annualized distribution by a penny each quarter.
The current cash distribution yield for Energy Transfer is larger than industry peers.
|
Company |
Current Cash Distribution Yield |
|
Energy Transfer Partners |
7.85% |
|
Enterprise Partners |
7.09% |
|
Kinder Morgan Inc |
4.93% |
|
Williams Cos |
3.94% |
|
ONEOK LP |
4.18% |
|
MPLX |
7.58% |
Constructive Forward Narrative
The company’s recent operational and financial results, coupled with renewed management focus, indicate Energy Transfer may be considered more of an industry stalwart.
The current business focus includes the following attributes:
-
opportunistic bolt-on acquisitions
-
higher-return organic growth projects, emphasizing LPG and NGLs
-
lower overall capex spend and a corresponding run for higher EBITDA growth and free cash flow
-
cash distribution annualized increases of 3 percent to 5 percent
-
modest unit repurchases beginning in 2024
There are no obvious business risks in the current business model that separate Energy Transfer from large peers. I believe the old “KW factor” that so traumatized past ET investors isn’t really much of factor anymore.
Please let me be clear: Kelcy Warren still has a great deal of influence on the company. His personal fortune is invested in Energy Transfer. Mr. Warren remains a strong-willed owner and investor. Nevertheless, I would be surprised to see today’s Energy Transfer management team take on difficult financial, operational, or business development risks. Nor do I believe the current management team is likely to misjudge the political / PR environment in which they operate.
Summary
We have compared Energy Transfer versus a relevant peer group. Here’s the bottom line:
-
Energy Transfer’s debt leverage as measured by debt-to-equity and raw debt-to-EBITDA appears middle-of-the-pack. Meanwhile, the current investment grade credit rating is on par with all peers’ sans EPD. Enterprise Products Partners stands two grades higher than the rest.
-
Growth as measured by adjusted EBITDA indicates Energy Transfer is at the top of its class (with the exception of ONEOK LP). However, OKE recently completed a merger with Magellan Midstream Partners, thereby increasing year-over-year results significantly. In addition, beginning in 2023, ONEOK updated its adjusted EBITDA calculation to include adjusted EBITDA from unconsolidated affiliates. To be fair, in July 2024, Energy Transfer completed an acquisition of WTG Midstream. However, the magnitude and EBITDA impact of this acquisition is smaller than the ONEOK / Magellan transaction.
-
When compared with large peers, Energy Transfer units offer investors the highest current cash dividend yield.
-
Energy Transfer’s operations and business strategies appears well-positioned and comparable to large peers. High risk, controversial propositions are not part of the current management equation. There are no obvious enterprise risks facing Energy Transfer that other similarly situated companies do not face, too.
Multiple Expansion?
Now we cut to the chase.
Given the aforementioned understanding of Energy Transfer’s fundamentals versus peers, it calls to question unit valuation:
Why should Energy Transfer common units trade at a materially lower valuation multiple than industry peers?
In the past, I could come up with various reasons that could begin to explain neutral to negative investor sentiment. It’s getting harder to do now. The degree of separation between Energy Transfer business and peers doesn’t appear so wide anymore. One may argue plausibly Energy Transfer’s unique span, scope, and diversified energy / transportation businesses may make it safer than some others.
Yes, there’s still a differential between Energy Transfer’s return-on-invested-capital versus the peer group. I covered this in detail in my most recent ET article. You can read about it here. However,
-
Energy Transfer’s management now obtains returns exceeding the cost of capital
-
RoIC is improving steadily
-
The gap between ET returns and peers does appear enough to warrant the wide differentiation in valuation multiples
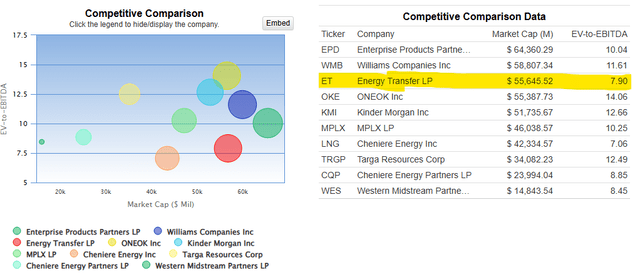
Please review the following chart:
Please notice I selected a valuation comparison using EV / EBITDA.
Yes, there are a number of ways to evaluate valuation for a security. Midstream / pipeline companies are no exception. Nevertheless, over the years, I’ve run through various valuation methodologies for Energy Transfer. I’ve currently landed upon EV / EBITDA being one of the most reliable.
Why?
Using EV / EBITDA includes rounded financial inputs: EV includes market capitalization, debt, and cash. Enterprise Value is based upon what a company is worth if purchased by a third party. EV includes market capitalization, which may be driven by fundamentals, sentiment, or a combination thereof. It also includes net debt and preferred stock, thereby rounding out the equation. EBITDA, while not my favorite financial metric, is a rough proxy for “cash earnings.”
Back to focusing upon valuation multiples:
On a TTM basis, ET has an EV / EBITDA multiple of about 8x. The large peers command a valuation multiple that averages ~11.5x. Three-and-a-half turns seems too large. I find little to differentiate Energy Transfer from large peers to justify that kind of a valuation gap.
What if ET enjoyed an EV / EBITDA multiple comparable to peers?
First, parameters are in order. Input data was taken from the 2Q 2024 earnings release and related 10-Q. Several adjustments were in order:
-
non-recourse third-party debt was subtracted
-
input EBITDA was the midpoint of management’s current full-year 2024 guidance, specifically $15.4 billion
-
common units outstanding were increased by 51 million to reflect the WTG Midstream acquisition completed on July 15, 2024
The table below offers a range of unit valuations.
|
Energy Transfer Partners |
Corresponding ET Unit Valuation |
|
EV / EBITDA = 8x |
$18 |
|
EV / EBITDA = 9x |
$22 |
|
EV / EBITDA = 10x |
$27 |
|
EV / EBITDA = 11x |
$31 |
(Table generated by the author)
Currently, ET units are bid at $16.30.
Am I saying Energy Transfer units are now worth $22 to $31?
No.
What I am saying is Energy Transfer common units appear undervalued versus large peers by several valuation turns: a considerable margin.
If ET maintains a comparable balance sheet, meets or beats others’ EBITDA growth, pays increasing cash distributions, and management plays growth capex down the middle of the fairway, then it seems probable, at some point, Energy Transfer should see valuation multiple expansion. In the meantime, I have no objection to tending a 7.85 percent cash distribution yield.
Currently, I believe an 8x EV / EBITDA multiple on estimated 2024 adjusted EBITDA is a reasonable Fair Value Estimate benchmark. That suggests ET units may have a FVE ~$18.
What do you think? I look forward to reading and replying to all relevant comments below.
Please do your own careful due diligence before making any investment decision. This article is not a recommendation to buy or sell any equity units. Good luck with all your 2024 investments.
Editor’s Note: This article was submitted as part of Seeking Alpha’s Best Value Idea investment competition, which runs through October 14. With cash prizes, this competition — open to all analysts — is one you don’t want to miss. If you are interested in becoming an analyst and taking part in the competition, click here to find out more and submit your article today!
Analyst’s Disclosure: I/we have a beneficial long position in the shares of ET either through stock ownership, options, or other derivatives. I wrote this article myself, and it expresses my own opinions. I am not receiving compensation for it (other than from Seeking Alpha). I have no business relationship with any company whose stock is mentioned in this article.
Seeking Alpha’s Disclosure: Past performance is no guarantee of future results. No recommendation or advice is being given as to whether any investment is suitable for a particular investor. Any views or opinions expressed above may not reflect those of Seeking Alpha as a whole. Seeking Alpha is not a licensed securities dealer, broker or US investment adviser or investment bank. Our analysts are third party authors that include both professional investors and individual investors who may not be licensed or certified by any institute or regulatory body.


