Summary:
- Carnival reported record revenues, adjusted EBITDA, and operating income in Q3 and expects 2025 to be another record-breaking year.
- Carnival is directing 98% of its free cash flow towards debt repayment as it repaid $3.225 billion in debt YTD.
- I expect Carnival to repay $9.6 billion from Q4 2024 until the end of 2026, bringing its net debt near $20.5 billion.
- My price target for CCL stock is $44 by 2026, implying 144% upside from its current valuation.
SeregaSibTravel
Last March, I initiated my coverage of Carnival Corporation & plc (NYSE:CCL) (NYSE:CUK) (OTCPK:CUKPF) with a buy rating due to its potential to generate record profits this year on the back of strong demand for cruises.
Seeking Alpha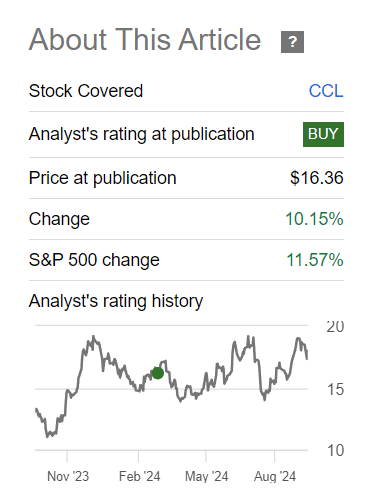
While my estimates have missed the mark, Carnival’s recently announced Q3 earnings have shown that the demand seen by the cruise industry isn’t pent-up demand from the pandemic years, but sustainable demand.
As is, the company reported record revenues, adjusted EBITDA, net yield, and Q3 customer bookings. In fact, the company expects its FY 2025 to be even better than FY 2024 due to higher demand for its cruises at higher price points, which could be a sign that Carnival may be on track to further grow its adjusted EBITDA and profits next year.
In my opinion, these factors could lead to a re-rating of Carnival’s shares given its focus on utilizing its free cash flow to deleverage its balance sheet, which has been the main drag on the company’s valuation despite its strong financial performance. In light of this, I’m reiterating my buy rating for Carnival with a price target of $44 by 2026, implying 144% upside from current levels.
Carnival Q3 Earnings Overview
In Q3, Carnival carried 3.9 million passengers, up 8.3% YoY from 3.6 million, at a higher ticket price compared to last year as ticket revenues were $5.24 billion during the quarter compared to $4.55 billion. This implies an average ticket price of $1343 in Q3 2024 vs. $1263 in the prior year. At the same time, onboard revenues were 15.12% higher than the prior year at $2.66 billion compared to $2.3 billion, implying that onboard spending per passenger increased from $641 to $681. Accordingly, the company’s total revenues grew 15.2% YoY from $6.85 billion to a quarterly record of $7.9 billion.
|
Q3 24 |
Q3 23 |
Difference |
|
|
Passengers |
3,900,000 |
3,600,000 |
8.33% |
|
Ticket Rev |
$5,239,000,000 |
$4,546,000,000 |
15.24% |
|
Ticket/Passenger |
$1,343 |
$1,263 |
6.38% |
|
Onboard Rev |
$2,657,000,000 |
$2,308,000,000 |
15.12% |
|
Spending/Passenger |
$681 |
$641 |
6.27% |
Carnival’s record revenues were accompanied by better cost management as the company reported a record operating income of $2.18 billion compared to $1.6 billion a year ago at an operating margin of 27.6% compared to 23.7%. The company also reported record adjusted EBITDA of $2.8 billion compared to $2.2 billion at a margin of 35.7% compared to 32.4%. In light of this, Carnival’s net income came at $1.7 billion compared to $1.07 billion a year ago at a net margin of 22% vs. 15.7%.
The main reason for Carnival’s improving profitability metrics is better management of cruise costs. In Q3, cruise costs increased 9.7% YoY from $3.92 billion to $4.3 billion. However, due to the impressive topline growth, cruise costs represented 54.5% of total revenues during the quarter compared to 57.2% in the prior year.
|
Q3 24 |
Q3 23 |
Difference |
|
|
Total Rev |
$7,896,000,000 |
$6,854,000,000 |
15.20% |
|
Commission |
$958,000,000 |
$823,000,000 |
16.4% |
|
% of Rev |
12.1% |
12.0% |
1.0% |
|
Onboard |
$866,000,000 |
$752,000,000 |
15.2% |
|
% of Rev |
11.0% |
11.0% |
0.0% |
|
Payroll |
$575,000,000 |
$585,000,000 |
-1.7% |
|
% of Rev |
7.3% |
8.5% |
-14.7% |
|
Fuel |
$515,000,000 |
$468,000,000 |
10.0% |
|
% of Rev |
6.5% |
6.8% |
-4.5% |
|
Food |
$393,000,000 |
$364,000,000 |
8.0% |
|
% of Rev |
5.0% |
5.3% |
-6.3% |
|
Other |
$995,000,000 |
$928,000,000 |
7.2% |
|
% of Rev |
12.6% |
13.5% |
-6.9% |
|
Cruise Costs |
$4,302,000,000 |
$3,920,000,000 |
9.7% |
|
% of Rev |
54.5% |
57.2% |
-4.7% |
|
SGA |
$763,000,000 |
$713,000,000 |
7.0% |
|
% of Rev |
9.7% |
10.4% |
-7.1% |
|
Depreciation |
$651,000,000 |
$596,000,000 |
9.2% |
|
% of Rev |
8.2% |
8.7% |
-5.2% |
|
Operating Income |
$2,180,000,000 |
$1,625,000,000 |
34.2% |
|
Operating Margin |
27.6% |
23.7% |
16.5% |
|
Net Income |
$1,735,000,000 |
$1,074,000,000 |
61.5% |
|
Net Margin |
22.0% |
15.7% |
40.2% |
In light of these strong results, Carnival raised its full-year guidance for the third time this year and now expects net yields to be up 10.4% compared to last year, adjusted cruise costs excluding fuel per ALBD to be up 3.5% YoY, adjusted EBITDA of $6 billion, and adjusted ROIC of 10.5%, a 5% improvement from 2023.
What’s even better for Carnival’s future prospects is that Carnival expects historical highs in 2025 in terms of occupancy and price. Despite raising prices, half of the company’s 2025 is already booked and has also achieved record booking volumes for 2026. In my opinion, this is a sign that the high demand witnessed by the cruise industry in the last 2 years wasn’t pent-up demand, but sustainable demand. As is, Carnival’s new-to-cruise increased 17% YoY in Q3, following a 10% YoY increase in Q2, which is a testament to the company’s marketing efforts.
Balance Sheet Deleveraging
The core of my bullish thesis is Carnival’s ability to deleverage its balance sheet by utilizing its free cash flow to repay its debt. During the first 3 quarters of 2024, Carnival had a free cash flow EBITDA flow-through of 67.3%, allowing it to generate $3.29 billion in free cash flow. Given that the company’s main priority is reducing its leverage, it directed 98% of its free cash flow towards debt repayment as it repaid $3.225 billion of its debt as follows.
|
9 Months Ending August 31st |
|
|
Adjusted EBITDA |
$4,890,000,000 |
|
Adjusted FCF |
$3,291,000,000 |
|
FCF EBITDA Flow Through |
67.3% |
|
Debt Repayments |
$3,225,000,000 |
|
Debt Repayments as a % of FCF |
98.0% |
Through these debt repayments, Carnival’s credit rating was upgraded by S&P to BB with a stable outlook and Moody’s to B1 with a positive outlook. In addition, Fitch initiated its coverage of the company in Q3 with a BB rating with a positive outlook. This is a promising sign to the company potentially becoming investment grade in the coming years as it continues utilizing its free cash flow to repay debt which would be a major boon for refinancing future debt at favorable terms. In this way, Carnival’s EPS could see a substantial boost due to lower interest payments.
According to the aforementioned figures, I expect Carnival to repay an additional $769 million of debt in Q4 2024 to bring its total debt repayments this year to $3.99 billion. I reached this figure by forecasting Carnival’s Q4 adjusted EBITDA and ALBDs. In my last coverage, I forecasted Carnival’s ALBDs to be 95.4 million based on management’s guidance of a 4.5% YoY increase. However, ALBDs increased by 5.29% during the 9 months ending August 31st. Accordingly, I expect Carnival’s Q4 ALBDs to be 24.4 million to bring the year’s total ALBDs to 96.1 million.
|
Year |
9 Months Ending August 31st |
Q4 |
Total |
|
2023 |
68,100,000 |
23,200,000 |
91,300,000 |
|
2024 |
71,700,000 |
24,426,432 |
96,126,432 |
|
Difference |
5.3% |
5.3% |
5.3% |
Considering management’s forecast of generating $63 in adjusted EBITDA per ALBD this year, I expect Carnival to generate $1.17 billion in adjusted EBITDA in Q4. This would translate to free cash flow of $784.7 million at the current free cash flow EBITDA flow-through rate of 67.3%. Therefore, Carnival could repay $769 million in debt in Q4 based on its debt repayment rate of 98% of free cash flow.
With Carnival expecting to generate $69 in adjusted EBITDA per ALBD in 2026 as part of its SEA Change program, its adjusted EBITDA has the potential to increase by 14% compared to my forecast for 2024, due to the potential of ALBDs to increase in the next 2 years. I expect ALBDs to increase as Carnival expects to add 3 new ships to its fleet until 2028, with one scheduled for 2025, one scheduled for 2026, and one scheduled for 2027 or 2028.
Assuming ALBDs increase at a rate of 2% annually, my forecast for Carnival’s ALBDs in the next 2 years is as follows.
|
Year |
ALBD |
Change |
|
2024 |
96,126,432 |
|
|
2025 |
98,048,960 |
2.00% |
|
2026 |
100,009,940 |
2.00% |
Accordingly, if Carnival is able to generate $66 in adjusted EBITDA per ALBD in 2025 before reaching its 2026 target, I expect the company to generate the following adjusted EBITDA and free cash flow in the next 2 years, based on its current free cash flow EBITDA flow-through.
|
Year |
2024 |
2025 |
2026 |
|
ALBD |
96,126,432 |
98,048,960 |
100,009,940 |
|
EBITDA/ALBD |
$63 |
$66 |
$69 |
|
Projected EBITDA |
$6,055,965,198 |
$6,471,231,383 |
$6,900,685,830 |
|
FCF as a % of Adj. EBITDA |
67% |
67% |
67% |
|
FCF |
$4,075,701,732 |
$4,355,178,422 |
$4,644,203,899 |
Given Carnival’s debt repayment rate of 98% of free cash flow, I expect the company’s debt repayments and cash balance in the next 2 years to be as follows.
|
Year |
2024 |
2025 |
2026 |
|
FCF |
$4,075,701,732 |
$4,355,178,422 |
$4,644,203,899 |
|
FCF Portion for Debt Repayments |
98% |
98% |
98% |
|
Debt Repayments |
$3,993,964,778 |
$4,267,836,648 |
$4,551,065,808 |
|
Cash |
$1,537,736,954 |
$1,623,327,114 |
$1,716,465,205 |
Based on my projections, Carnival could repay $9.6 billion in debt between Q4 2024 and the end of 2026, bringing its debt load down to $22.3 billion after adding $3 billion in drawn export credits. As such, Carnival could have a net debt position of $20.5 billion, which translates to a net debt/adjusted EBITDA ratio of 2.98, relative to my 2026 adjusted EBITDA forecast. This would mark a significant improvement in leverage as management expects this ratio to be near 4.5 this year.
|
Current Debt |
$28,856,000,000 |
|
Potential Repayments |
$9,587,867,234 |
|
Remaining Debt |
$19,268,132,766 |
|
Add: Drawn Export Credits |
$3,000,000,000 |
|
Debt Balance 2026 |
$22,268,132,766 |
|
Cash |
$1,716,465,205 |
|
Net Debt |
$20,551,667,560 |
|
Adjusted EBITDA |
$6,900,685,830 |
|
Net Debt/Adj. EBITDA |
2.98 |
CCL Stock Valuation
According to my 2026 projections for Carnival’s adjusted EBITDA, cash, and debt balances, the stock is trading at a 6.48 EV/adjusted EBITDA multiple.
|
Market Cap |
$24,180,085,823 |
|
Cash |
$1,716,465,205 |
|
Debt |
$22,268,132,766 |
|
EV |
$44,731,753,384 |
|
Adj. EBITDA |
$6,900,685,830 |
|
EV/Adj. EBITDA |
6.48 |
In comparison, Carnival’s peers Royal Caribbean Cruises (RCL), Norwegian Cruise Line (NCLH), and Viking Holdings (VIK) are trading at EV/EBITDA multiples of 11.92, 9.47, and 14.91, respectively.
With that in mind, I have assigned a lower weight to Viking when trying to reach my target EV/adjusted EBITDA multiple due to its significantly lower debt load of only $5 billion. Accordingly, my target EV/adjusted EBITDA multiple for Carnival is 11.54.
|
Company |
EV/EBITDA |
Weight |
|
RCL |
11.92 |
40% |
|
NCLH |
9.47 |
40% |
|
VIK |
14.91 |
20% |
|
Average |
11.54 |
100% |
By applying an 11.54 EV/adjusted EBITDA multiple, my price target for Carnival is $44 by 2026, representing 144% upside from its current valuation.
|
Proj. EBITDA |
$6,900,685,830 |
|
EV/Adj. EBITDA |
6.48 |
|
Target Multiple |
11.54 |
|
Implied EV |
$79,620,113,102 |
|
Net Debt |
$20,551,667,560 |
|
Equity Value |
$59,068,445,542 |
|
OS |
1,341,847,160 |
|
Price Target |
$44.02 |
|
Share Price |
$18.02 |
|
Upside |
144% |
Technical Analysis
TrendSpider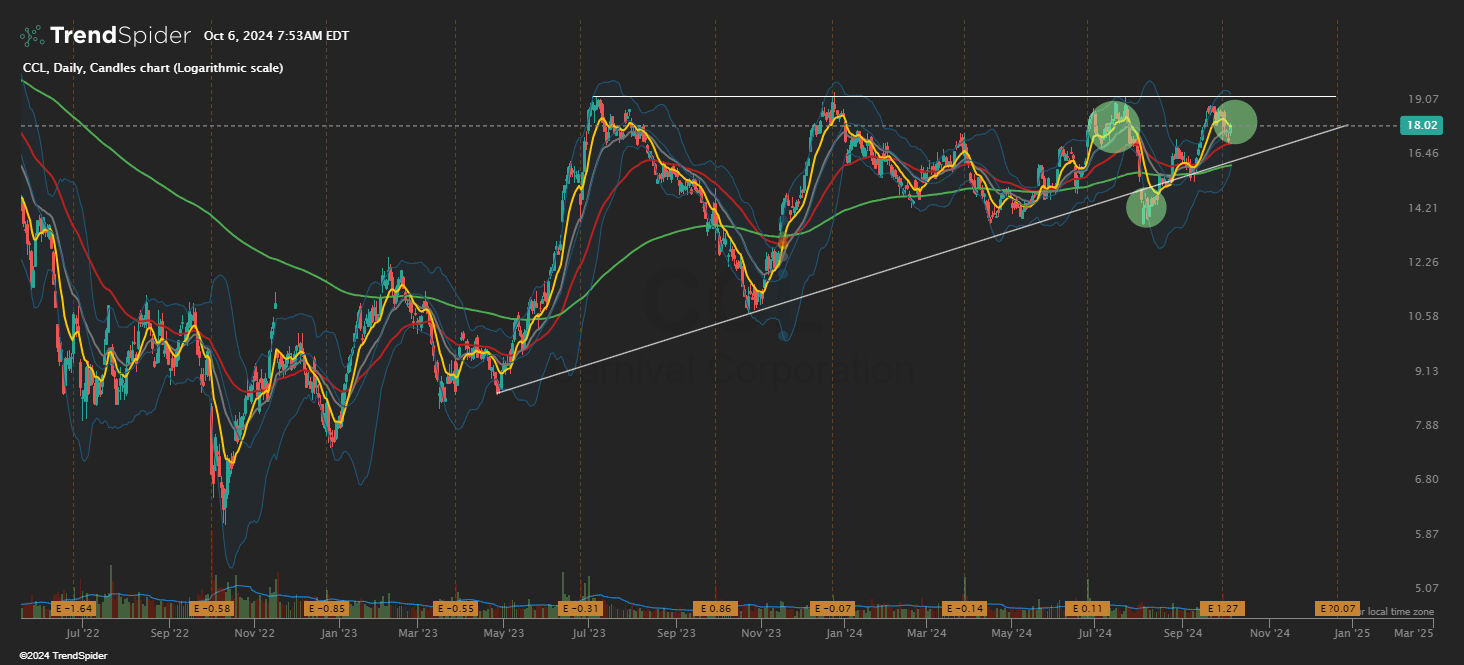
Looking at the TrendSpider chart above, Carnival has been in an ascending triangle pattern since July 2023 on the daily chart, a pattern it has failed to break through multiple times. That said, the stock appears to be forming an inverse head and shoulders which is a bullish reversal pattern. Accordingly, I recommend waiting for a successful breakout of the ascending triangle pattern before entering a long position in the stock.
Risks
The main risk to my thesis is that Carnival is more exposed to economic downturns compared to its peers since it mainly targets the mass market, who are more likely to be impacted by worsening economic conditions. Therefore, if a recession occurs in the next 2 years, Carnival may miss on its adjusted EBITDA targets which would negatively impact its ability to repay its debt and improve its leverage.
Conclusion
In summary, I’m bullish on Carnival due to its strong financial performance as shown by its Q3 results. The company sees 2025 to be even better than 2024 and 2026 could be even better due to the record booking volume this far in the future. Given this strong demand for Carnival cruises, the company could continue generating record adjusted EBITDA and free cash flow, allowing it to further deleverage its balance sheet as I expect it to repay nearly $9.6 billion from Q4 2024 until 2026. In this way, Carnival could post a net debt to adjusted EBITDA ratio of 2.98, which could improve its credit rating and help it refinance future debt walls at favorable terms, potentially boosting its earnings. In light of this, I’m reiterating my buy rating for Carnival with a price target of $44 by 2026, representing 144% upside from current levels.
Editor’s Note: This article was submitted as part of Seeking Alpha’s Best Value Idea investment competition, which runs through October 14. With cash prizes, this competition — open to all analysts — is one you don’t want to miss. If you are interested in becoming an analyst and taking part in the competition, click here to find out more and submit your article today!
Editor’s Note: This article discusses one or more securities that do not trade on a major U.S. exchange. Please be aware of the risks associated with these stocks.
Analyst’s Disclosure: I/we have no stock, option or similar derivative position in any of the companies mentioned, and no plans to initiate any such positions within the next 72 hours. I wrote this article myself, and it expresses my own opinions. I am not receiving compensation for it (other than from Seeking Alpha). I have no business relationship with any company whose stock is mentioned in this article.
Seeking Alpha’s Disclosure: Past performance is no guarantee of future results. No recommendation or advice is being given as to whether any investment is suitable for a particular investor. Any views or opinions expressed above may not reflect those of Seeking Alpha as a whole. Seeking Alpha is not a licensed securities dealer, broker or US investment adviser or investment bank. Our analysts are third party authors that include both professional investors and individual investors who may not be licensed or certified by any institute or regulatory body.