Summary:
- Qualcomm’s recent 35% stock decline is unjustified given strong operational performance, creating an excellent buying opportunity with a “strong buy” rating.
- Qualcomm beat fiscal 2024 earnings and revenue estimates, showing significant growth in the automotive segment and positive guidance for the next quarter.
- Key support levels at $151.39-$152.70 suggest potential for new buying activity; initial resistance is expected around $176.80 and $182.64.
- Qualcomm’s forward P/E ratio is significantly lower than competitors like AMD, Intel, and TSM, enhancing its attractiveness for income-minded tech investors.
hapabapa
When I last covered Qualcomm (NASDAQ:QCOM) in late May 2024, the stock was ramping up sharply within a strong bull trend and was in the process of rallying toward its all-time high of $230.63 on June 18th. On the positive side, these upward price moves resulted in a continuation rally of another nearly 6.17% before reversing. On the negative side, share prices started to reverse lower at this point, and we actually started to see some fairly dramatic declines of nearly 35% over the next six weeks. However, these recent bearish price declines do not fully align with the strong operational performances that we are currently seeing at Qualcomm and I believe that these excessive near-term moves to the downside have created a much stronger buying opportunity for investors that are looking to increase exposure to the technology sector and generate a bit of dividend income at the same time. As a result, I am increasing my rating outlook to “strong buy” for this beaten-down stock that might be ready to start reversing higher.
Qualcomm: Share Price Reversal (Income Generator via Trading View)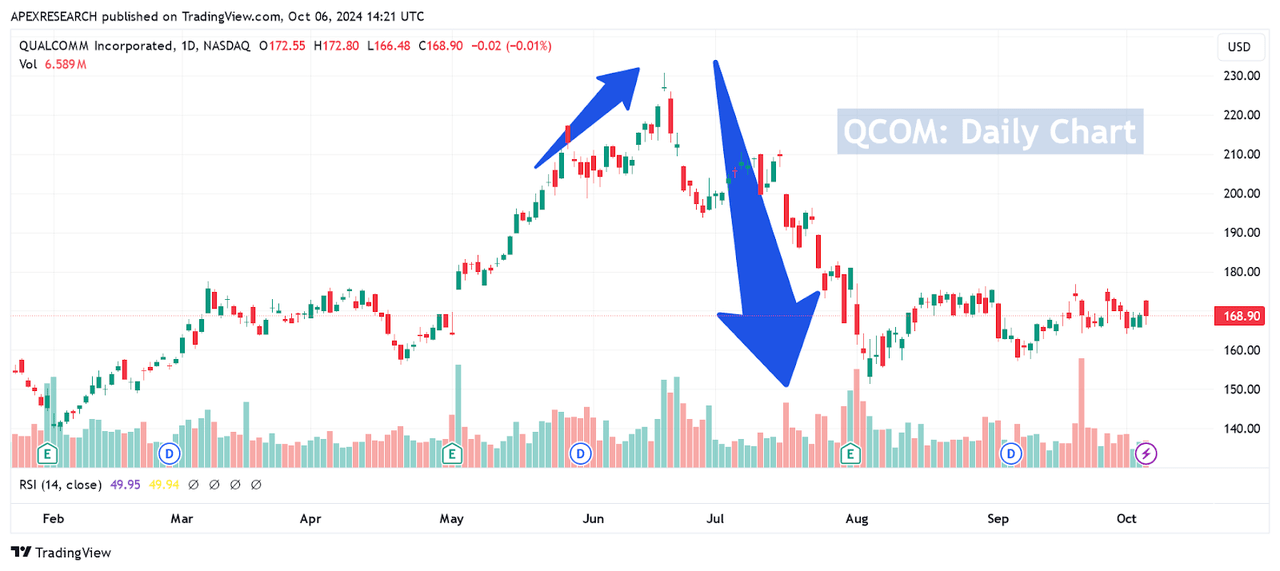
For the third quarter period in fiscal 2024, Qualcomm reported earnings and revenue figures that surpassed consensus estimates. Specifically, the company recorded per-share adjusted earnings of $2.33 (beating consensus estimates of $2.25) and adjusted revenues of $9.39 billion (beating consensus estimates of $9.22 billion). Net income figures posted at $2.13 billion, indicating annualized growth rates of over 18.3%, and key highlights from the report included guidance figures implying potential sales of $9.5-10.3 billion for the fourth quarter.
Financial Results and Guidance (Qualcomm Earnings Presentation)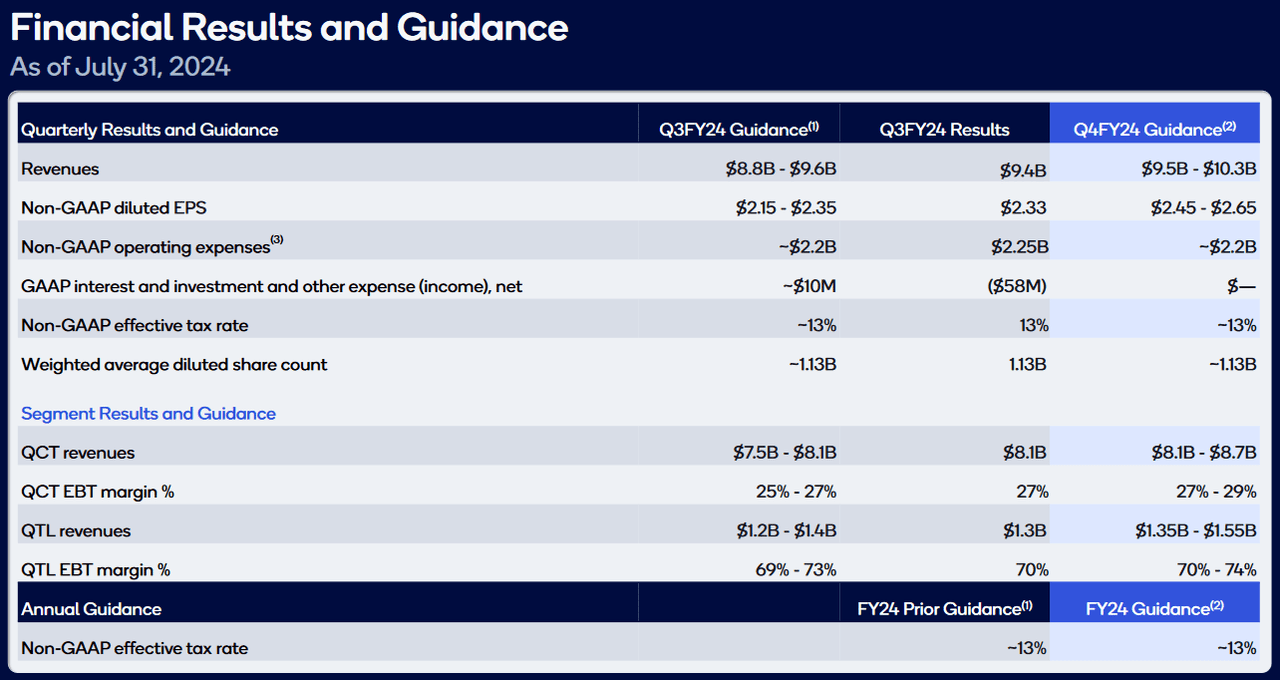
As is generally the case, most of the attention centered around Qualcomm’s handset segment, which saw annualized revenue growth of 12% (at $5.9 billion). Though these figures did not beat consensus estimates, they do suggest that a broader turnaround is currently in place with respect to the prior sluggishness that has been seen in recent mobile phone sales cycles. More surprisingly, Qualcomm achieved massive annualized growth rates of 87% in its automotive segment (with revenue figures posting at $811 million). Currently, this segment only accounts for a relatively minor contribution to the company’s annual sales figures, but these recent rates of growth suggest that this might be one industrial area where Qualcomm can generate more impressive rates of expansion going forward. On the negative side, Qualcomm’s Internet of Things (IoT) segment actually experienced annualized declines of -8% (with $1.4 billion in revenues) but expectations for this segment were relatively weak, so the overall impact on share prices has been muted.
Q3FY24 Revenue Streams (Qualcomm Earnings Presentation)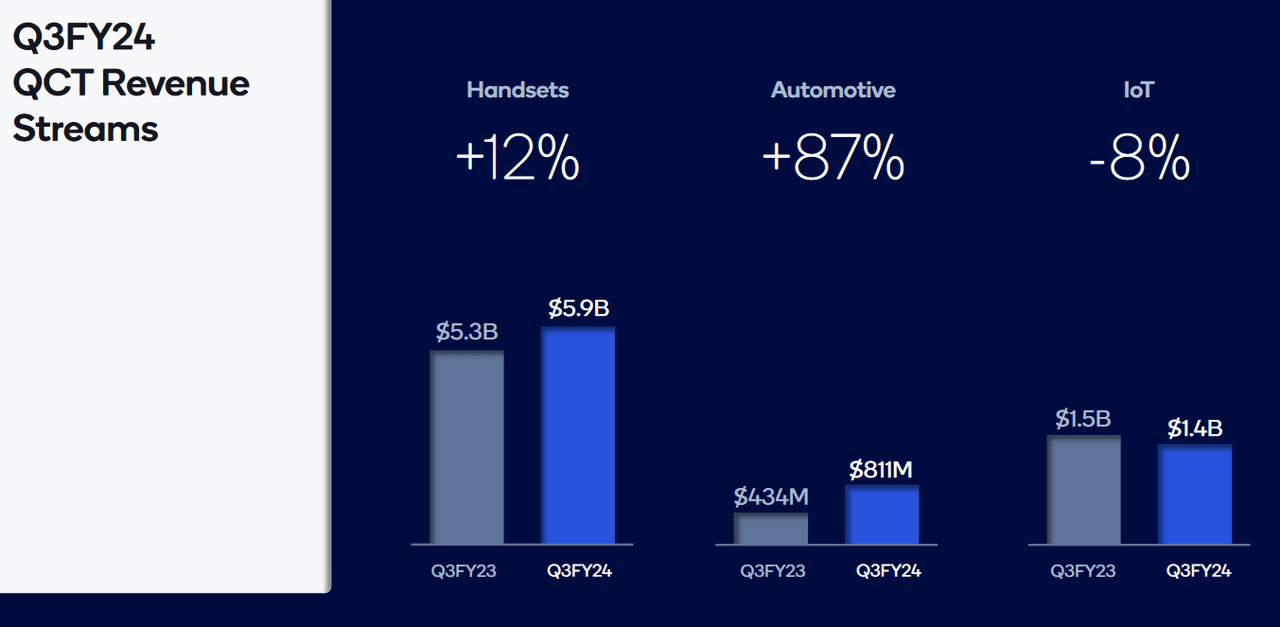
On balance, I think that these results should be viewed positively, given the sizable beats in both earnings and revenue, strength in guidance figures for the current quarter, and potential for strong forward growth in Qualcomm’s automotive segment going forward. As a result, the recent declines that have been seen in QCOM share prices appear to be incredibly unjustified at the moment. Specifically, the near-term top that formed on June 18th, 2024 has experienced share price declines of as much as -34.36% over the last four months. During these substantial price movements lower, strong support zones have now formed at $151.39 (marking the August 5th lows) and this is now the main that I am currently watching to the downside:
QCOM: Bullish Trend Measurements (Income Generator via Trading View)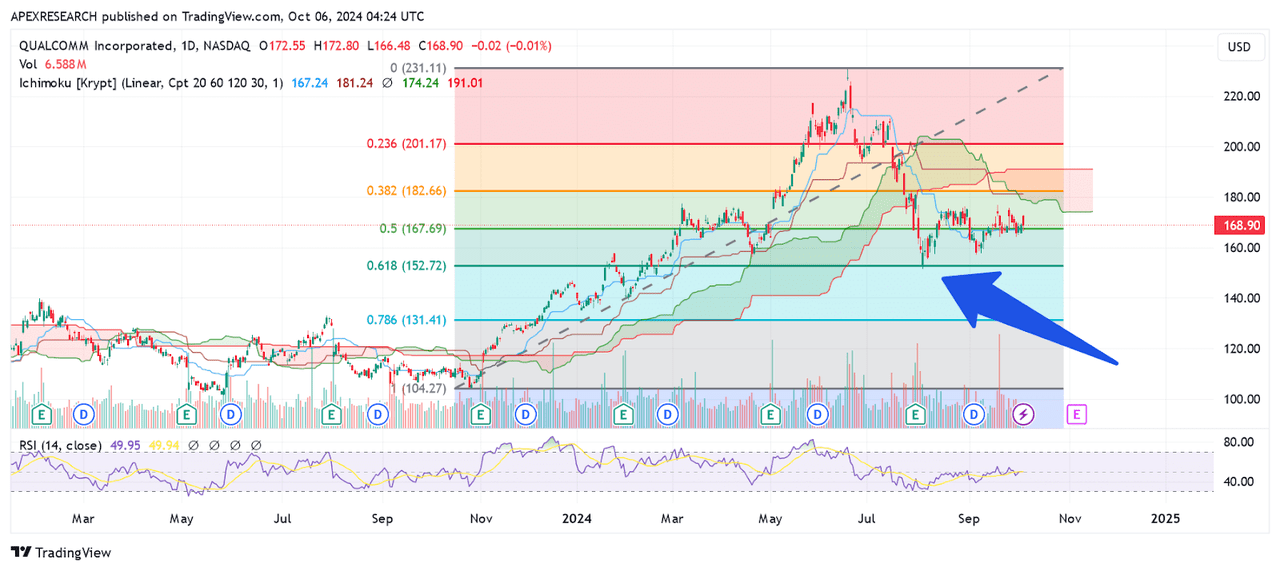
In addition to being a region of historical support, the 61.8% Fibonacci retracement level of the ascending price move from $104.33 (price low from October 26th, 2023) to the all-time highs at $230.63 is located near $152.70. Since this is less than $1.50 from the August 5th lows, this $151.39-152.70 area can be viewed as a zone of support that appears likely to generate new buying activity by the market once tested. Overall, this is the main price zone that I would need to see breached in order to shift my bullish outlook and begin to expect further trend waves in the bearish direction. Assuming this price level holds, this outlook would assume a downside risk of roughly 10.36% before share prices would be expected to find substantive buying activity. In the other direction, initial resistance appears likely to develop on an approach toward the September 19th highs at $176.80. However, a breach of this area would then require reverse Fibonacci measurements using the $230.63 all-time highs extended to the August 5th lows ($151.39).
QCOM: Bearish Trend Measurements (Income Generator via Trading View)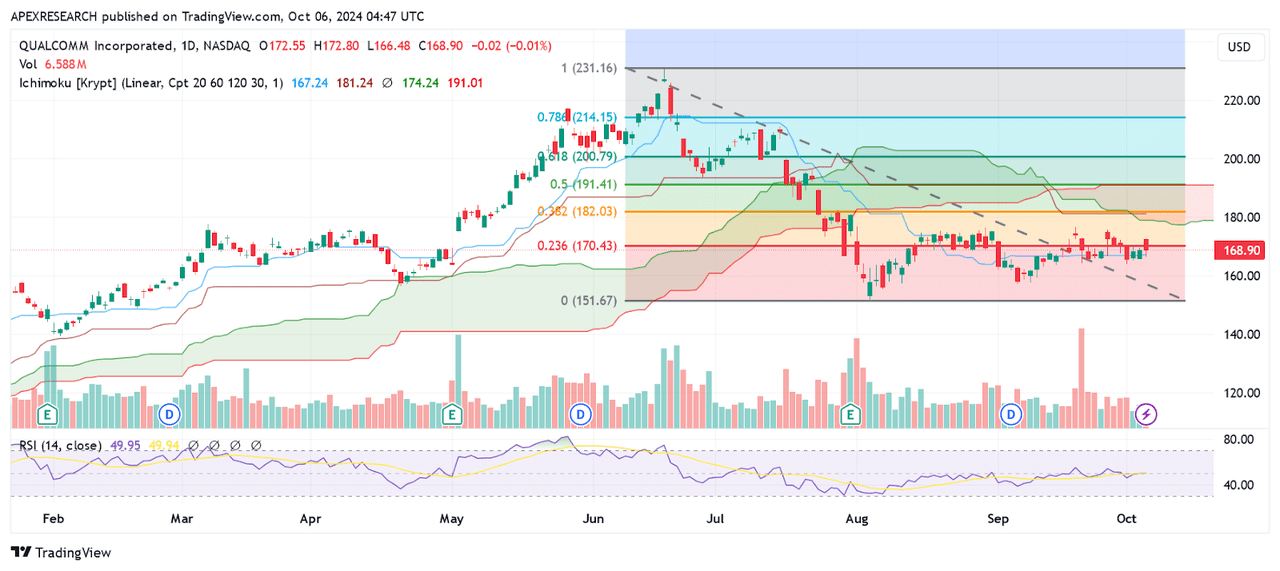
Using this reverse measurement, QCOM’s 38.2% Fibonacci retracement is located slightly above $182 and this price level closely aligns with the July 29th high of $182.64. For these reasons, I think that the stock is likely to encounter some bearish selling pressures in this area. However, if we do see an upside break above the $182.64 region, the next resistance target to the topside would then be found at the 61.8% Fibonacci retracement of the aforementioned downward price move (which is located near $200.80) and this indicates potential for upside of nearly 18.89% relative to last week’s closing prices.
Of course, this potential for gains in market alpha would not be sufficient from a risk-reward perspective because this does not meet my minimum trading requirement of $3 in possible gains for every $1 in possible losses. For these reasons, profit target levels would need to be raised to at least the stock’s prior all-time high of $230.63. When managing the trade in this manner, we can then raise the risk-reward ratio for the position to just over 3.52:1 (61.73 in potential gains versus 17.51 in potential losses) and this would meet my favorability requirements for entering into a long QCOM trade. As a result, I believe that the recent declines have now created highly attractive buying opportunities for investors and that Qualcomm should be considered a “strong buy” along with its highly stable 1.95% dividend yield as an added incentive.
Comparative Forward PE Metrics (YCharts)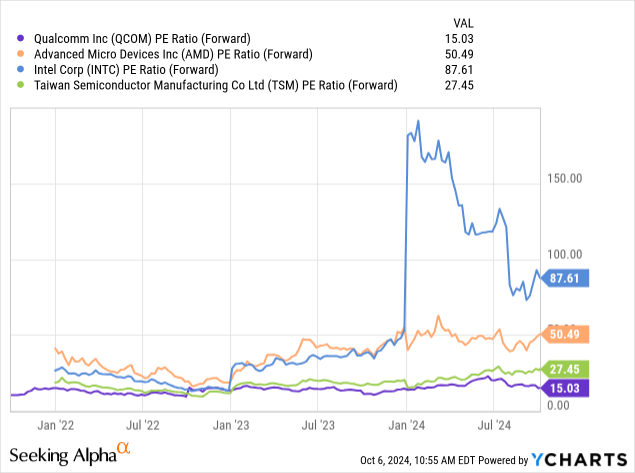
When comparing QCOM viability as a long trade against key rivals within the industry, it is also important to note that recent declines in share prices have also improved the stock’s valuation prospects from a forward price-earnings perspective. Specifically, influential competitors like Advanced Micro Devices (AMD), Intel Corporation (INTC), and Taiwan Semiconductor Manufacturing (TSM) all trade with higher forward price-earnings ratios. In some cases, such as Intel and AMD, these differences in the forward price-earnings metric are actually quite stark. However, even Taiwan Semiconductor’s forward price-earnings figure of 27.45 is nearly double the figure that can be seen in Qualcomm (at just 15.03).
For many, these valuation differences alone might be enough of a reason to start drawing investor attention away from some of Qualcomm’s competitors within the semiconductor sector. But, ultimately, what this tells me is that the recent declines in QCOM share prices have become quite excessive and warrant the prospect of a true turnaround in reversing higher. For all of these reasons, I believe that QCOM deserves consideration for income-minded investors that are looking for additional exposure to the technology sector. Quite often, dividend income can be difficult to locate in this part of the market, but I believe that this stock’s dividend yield is starting to look much more attractive now that share prices are trading at these new discounts. I am raising my rating outlook to “strong buy” for this stock, and I will continue to maintain my underlying long position.
Analyst’s Disclosure: I/we have a beneficial long position in the shares of QCOM either through stock ownership, options, or other derivatives. I wrote this article myself, and it expresses my own opinions. I am not receiving compensation for it (other than from Seeking Alpha). I have no business relationship with any company whose stock is mentioned in this article.
Seeking Alpha’s Disclosure: Past performance is no guarantee of future results. No recommendation or advice is being given as to whether any investment is suitable for a particular investor. Any views or opinions expressed above may not reflect those of Seeking Alpha as a whole. Seeking Alpha is not a licensed securities dealer, broker or US investment adviser or investment bank. Our analysts are third party authors that include both professional investors and individual investors who may not be licensed or certified by any institute or regulatory body.
