Summary:
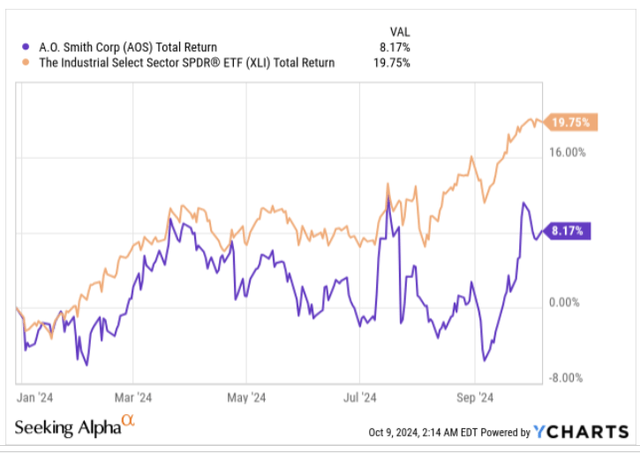
- A. O. Smith has underperformed other industrial stocks this year, generating only returns of 8%.
- A. O. Smith’s Q3-24 results are expected to be weak, with revenue growth slowing to 2% from the 7% levels seen in Q2.
- Although the situation isn’t alarming, we do have some concerns about the company’s dwindling cash position and highlight why its net cash stance could shift to a net debt stance.
- Despite being a Dividend Aristocrat, AOS’ forward yield is below par, and it does not offer a great deal of earnings growth for the P/E multiply it commands.
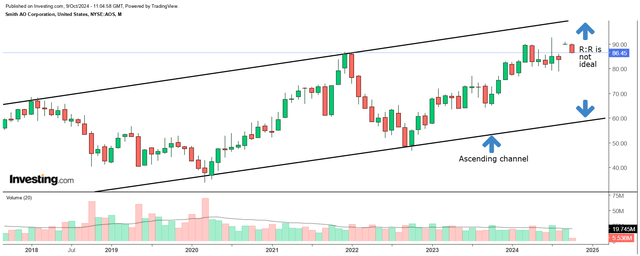
- The risk-reward on the long-term chart does not look too appealing.
aquaArts studio
Introduction
A. O. Smith (NYSE:AOS), a global producer of residential and commercial water heaters and boilers, hasn’t quite been able to generate ample alpha for its stakeholders this year. On a YTD basis, AOS has only notched up returns of 8%, whereas its industrial peers from the S&P 500 have generated 2.4x the former’s returns (on average).
In less than two weeks from now, the AOS stock may well get a shot in the arm (or vice-versa), as it is due to release its Q3 results on the 22nd before the market opens. If you’re looking to take a position before the key event, here are a few important things to note.
What To Expect
Firstly, note that AOS’s track record during earnings season, in relation to consensus numbers, has been pretty decent so far. For context, over the last 3 years, it has always managed to beat or meet bottom-line quarterly estimates, with an average beat of almost 8%. Having said that, it’s worth noting that the magnitude of earnings beat over the last three quarters has been nothing to write home about, with earnings in the most recent quarter coming in bang in line with estimates (Q4-23 and Q1-24 only saw a beat of 1%). In keeping with this trend, investors would do well to keep their feet on the ground and not expect any major fireworks when results come on the 22nd.
Seeking Alpha 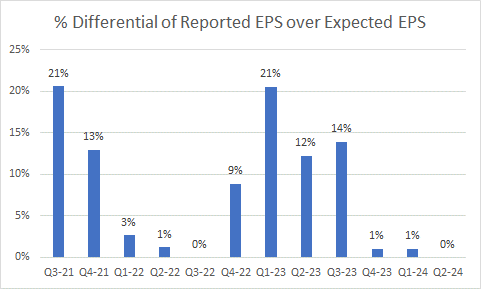
When it comes to the upcoming Q3, investors should note that historically, it has proven to be AOS’s weakest quarter. After generating YoY topline growth of 7% in Q2, the sales runrate in Q3 looks set to dip to the 2% threshold, as consensus is currently budgeting for a Q3 revenue figure of $957.7m (Q2: $1024m). Even otherwise, Q3 will also have to contend with the consequences of pulled-forward demand in H1 before the company incorporated price hikes of 4-8% in their North American segment. It’s worth noting that the first month of Q3 was already seeing some softness in orders, and we can’t imagine volumes would see a meaningful step-up.
At the bottom line, the expectation is for an adjusted EPS of $0.96 (Q2: $1.06), which would represent a step-up in the earnings growth from 5% in Q2 to 7% in Q3.
Coming back to the topline, note that even though the September quarter is unlikely to be the greatest, the market could take heart from a likely pickup in the December quarter towards the 4% levels. If AOS end up delivering 2% topline growth in Q3 as expected, we would essentially be staring at average topline growth of 3% for 9M-24. Yet note that at the end of H1-24, AOS management had guided to FY revenue growth at a higher threshold of 4% (mid-point of the guided range).
One of the X factors in driving better Q4 growth could come from the AOS’s Chinese business (22% of total group sales) where weakness in residential home construction as well as the replacement market have left an adverse mark. AOS had previously been budgeting for a weak H2, and while Q3 is unlikely to see a positive shift, Q4 sales could start trending higher on account of the recent stimulus measures that have already started leaving a favorable mark on home sales.
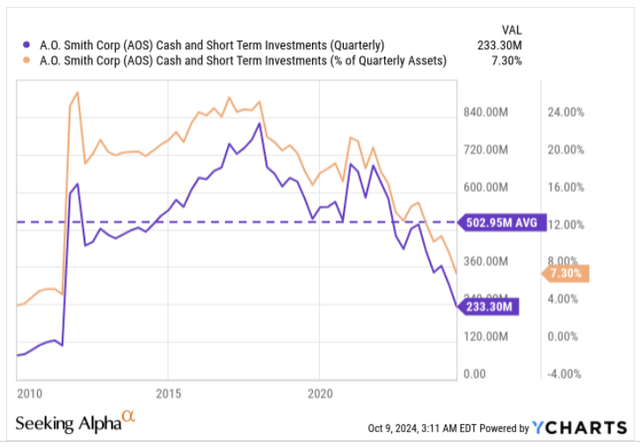
We also have some concerns over AOS’s dwindling liquidity balance. Don’t get us wrong, AOS still continues to maintain a positive net cash position (where cash and short-term investments exceed debt) of $68m, but, this declining trend is likely to have consequences on the shareholder distribution facet of AOS, something that the stock is well noted for (it has a track record of over three growing its dividends annually for over three decades now).
Do consider that 7 years back, the cash and investment (STI) balance was over $800m, accounting for one-fourth of AOS’s total asset base; these days that share has dropped to single-digits, with a cash and STI figure of just $233m. Going forward, we don’t expect these cash balances to see a meaningful buildup any time soon on account of the following reasons.
Note that in H1, operating cash generation was already down by 37% YoY, coming in only at $164m; this was driven by higher working capital spend linked to inventories (mainly tankless water heaters) and accounts receivable, whilst higher incentive payments linked to last year’s sales and earnings too played a part.
Meanwhile, AOS is also ramping up its expansion projects (a gas tankless facility in Juarez, enhanced engineering capabilities in Tennessee, and regulatory-induced commercial water heating manufacturing capacity), and this has seen CAPEX commitments in H1 already go up by 86% YoY. After spending, $45m in H1 towards these initiatives, AOS is expected to step up the pace in H2 with an implied spend of anything between $60m to $70m.
Don’t also forget that they will need to shed out $120m in cash to complete the acquisition of Indian-based Pureit by the end of this year. Management has also suggested that after deploying $153m in H1 towards buying back the AOS stock, they intend to spend a similar cadence in H2. Besides, that AOS also typically spends around $180-$200m p.a. by way of dividends, and after spending around $94m in H1, expect a similar threshold in H2.
So, taking the spike in CAPEX, the Pureit acquisition figure, the H2 repurchase spend, and the H2 dividend outlay, we could be looking at cash drain to the tune of $425m in Q3 and Q4, and this would call for a marked step-up in operating cash flow (OCF) generation for that period.
Fortunately, it looks like we will see a marked improvement (but it may not necessarily be sufficient), as AOS is expected to generate OCF of $440m for the FY. Since the OCF in H1 was $164m, this would represent an H2 OCF of only $276m, still nearly $150m short of the expected cash spend. This will likely prompt AOS to take on even more debt, and it is questionable if the net cash position will be maintained for too long.
Quarterly presentations, author’s calculations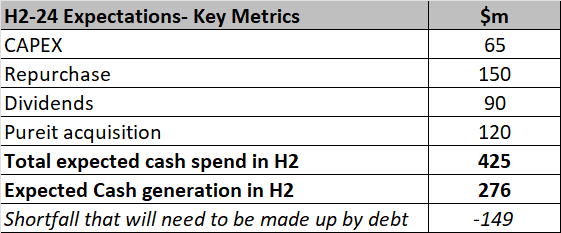
Closing Thoughts – Is AOS Stock A Good Buy Now?
As implied in the previous section, Q3-24 isn’t expected to be the most resilient quarter. We also don’t believe the AOS Stock would represent a compelling investment now on account of the following reasons.
Firstly, as noted earlier, the dividend angle is an important fulcrum of AOS’s credentials as a vehicle of investment, and based on the current forward yield, it does not look like one is getting a great deal at current prices. We’ve already touched upon the changing cash flow texture of AOS, and this appears to be weighing on the quantum of hikes.
Seeking Alpha 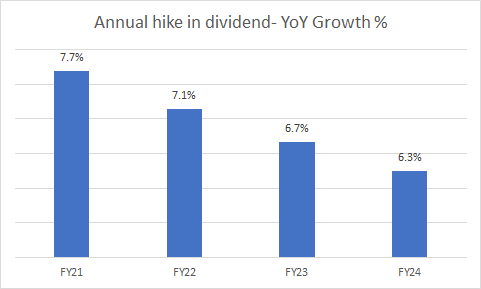
Note that already, AOS’s yield was trailing its 5-year average (1.72%) by 24bps, but even after accounting for the most recent hike (6.3%) which took place a couple of days back, the new forward yield of 1.57% still lags the historical average by 15bps.
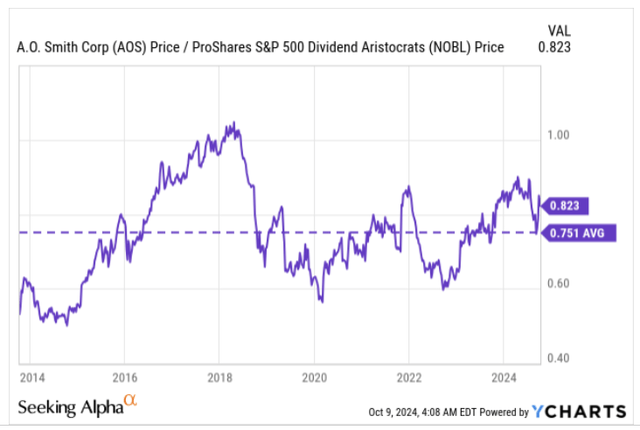
Speaking of dividends, it’s worth noting that AOS belongs to the esteemed S&P500 Dividend Aristocrats Index, but investors who are looking for beaten-down opportunities in this space, won’t have AOS high on their wish list (quite unlike the situations in 2020 and 2022 when the RS ratio had dropped to the 0.6 levels. Note that AOS’s current relative strength ratio is already around 10% higher than its long-term average, dampening the incentive to go long.
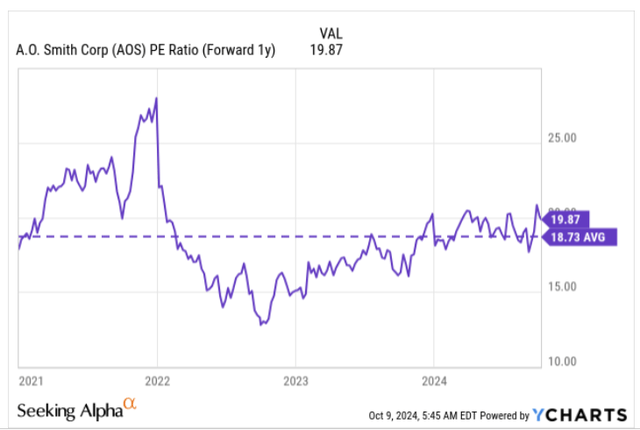
AOS also doesn’t appear to offer great value at current levels. Based on the FY25 EPS, AOS not cheap at a forward multiple of almost 20x; to be more specific, the current P/E represents a 6% premium over its long-term average.
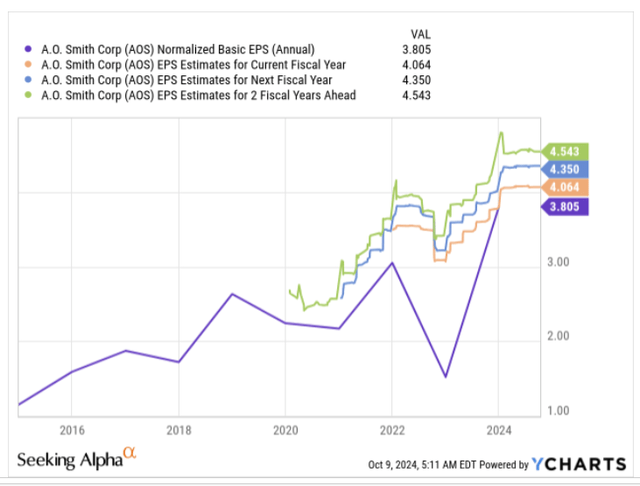
One could make allowances for that P/E multiple if we were getting a similar cadence of medium-term earnings growth, but take a look at the image below (which showcases consensus estimates for the next 3 years), and the main takeaway is that earnings will only grow at a 3-year CAGR of 6% over the next 3 years!
Finally, we’d like to highlight the unfavorable risk-reward on AOS’s long-term chart; the image below, which captures the monthly price imprints of AOS over the last 7 years, shows that the stock has moved higher within the boundaries of an ascending channel. Long positions are likely to be more rewarding when the price is perched closer to the lower boundary of its channel. Not where it is now, which is just a few percentage points away from the upper boundary.
Analyst’s Disclosure: I/we have no stock, option or similar derivative position in any of the companies mentioned, and no plans to initiate any such positions within the next 72 hours. I wrote this article myself, and it expresses my own opinions. I am not receiving compensation for it (other than from Seeking Alpha). I have no business relationship with any company whose stock is mentioned in this article.
Seeking Alpha’s Disclosure: Past performance is no guarantee of future results. No recommendation or advice is being given as to whether any investment is suitable for a particular investor. Any views or opinions expressed above may not reflect those of Seeking Alpha as a whole. Seeking Alpha is not a licensed securities dealer, broker or US investment adviser or investment bank. Our analysts are third party authors that include both professional investors and individual investors who may not be licensed or certified by any institute or regulatory body.
