Summary:
- Tuesday morning, October 15th, per Briefing.com, Charles Schwab, Goldman Sachs, Bank of America, and Citigroup will report their Q3 ’24 results.
- When Schwab reports their Q3 ’24 financial on Tuesday morning, the Street is expecting EPS of $0.75, operating income of $2.1 billion and net revenue of $4.77 billion.
- When Goldman reports their 3rd quarter ’24 financial results on Tuesday morning, consensus is expecting $7.03 in EPS on $11.78 bl in net revenue for expected y-o-y growth of 29% and 0%, respectively.
MCCAIG
The banks, stock markets and exchanges are closed Monday, October 14th, ’24 for the celebration of Columbus Day/Indigenous Peoples’ Day.
Tuesday morning, October 15th, per Briefing.com, Charles Schwab (NYSE:SCHW), Goldman Sachs (NYSE:GS), Bank of America (BAC), and Citigroup (C) will report their Q3 ’24 results. (Preview coming on Bank of America, Citigroup and Morgan Stanley (MS)).
Wednesday morning, October 16th, Morgan Stanley will report their 3rd quarter financial results.
The two financial services stocks that this blog thinks will benefit from a positively sloped yield curve (an “un-inversion” of the yield curve, so to speak) are Charles Schwab and the SPDR Regional Banking ETF (KRE).
KRE is an ETF that holds regional banks, with regional banks today being penalized by the unrealized losses on the Treasury holdings within these banks, thanks to the yield curve inversion, as well as the commercial real estate (CRE) loans that are held by the regional banks.
The City of Chicago has a 20-30% vacancy rate on much of its commercial real estate property (depending on the source you read), with talk of the city converting much of LaSalle Street to luxury residential property from commercial office space. This is all just talk, but a lower fed funds rate and a normalization of the yield curve will help much of this financing, as it did in the early 1990s.
The Silicon Valley Bank collapse spooked regional bank investors, which saw KRE trade down from its $77-78 high in early ’22 to its May ’23 lows near $34-35. This blog has been picking away at KRE gradually the last 18 months.
The current Treasury yield curve today has the 2-year, 5-year and 10-year Treasury yield still underwater (i.e. inverted), even after a fed funds rate at 4.75%, if the FOMC cuts the fed funds rate 25 bps at the November and December ’24 meetings.
But I suspect if readers wait until the Treasury curve returns to its normal slope, KRE will have recovered a lot of the lost ground relative to the early ’22 highs. (That’s an educated guess and not a prediction.)
Charles Schwab
As this blog’s third party custodian, you have to feel for Chuck and the discount brokerage group. From 2008 to late 2016, Schwab saw zero rates and had to cut their money market management fees to zero, which was not an easy giveback from a fee perspective.
And then just 6 years later, Schwab is dealing with an inverted yield curve, which has forced their money market yields into the low 5% range, while their Treasury portfolio was throwing off a lower amount of yield for shareholders.
I don’t have a great handle on the process around “cash-sorting” having tried to get up to speed on the process, but it appears sorting has helped Schwab in the last two quarters around the issue of the curve inversion.
A return to a normally sloped yield curve would likely take some pressure off net interest income and allow for a return to growth in the net interest margin, which is down from 2.24% to 2.19% in late ’22 and early ’23 to 1.90-2.03% in the last 3 quarters.
Given Schwab’s cost discipline over the years, and the merger of TD Ameritrade into Schwab’s operations, Morningstar had a target pre-tax operating margin goal on the custodial giant of low to mid 50%, while the actual pre-tax margin has been in the mid 30% range.
There is no question that the post-Covid volatility and the Treasury yield curve gymnastics (not to mention consolidating the Ameritrade merger) has been a tougher environment in which to operate Schwab’s balance sheet and business model. Hopefully though, Schwab is putting this volatility behind it.
When Schwab reports their Q3 ’24 financial on Tuesday morning, the Street is expecting EPS of $0.75, operating income of $2.1 billion and net revenue of $4.77 billion for y-o-y growth of -3% EPS, +12% operating income growth, and +4% revenue growth.
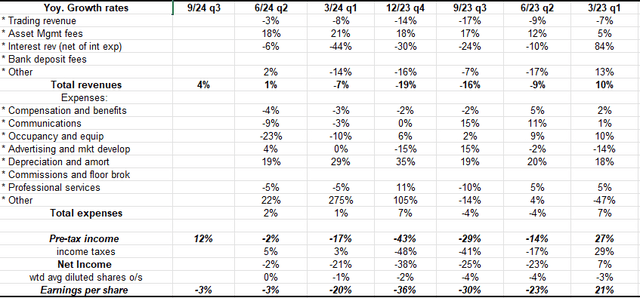
Four of the last 5 quarters for Schwab have seen y-o-y revenue declines, with last quarter – Q2 ’24 – seeing +1% revenue growth. The expected 4% revenue growth for Q3 ’24 will be the best y-o-y revenue growth since Q3 ’23.
Here’s the hole (see above numbers in the common size income statement) Schwab is digging out of after the zero rates in ’21 and then the shock of higher rates into mid ‘2023. Schwab has easier compares in the next few quarters.
The big tell in terms of squeezed margins and a more constricted operating environment is that Schwab has maintained their quarterly dividend for the last 6 quarters at $0.25 per share, so a return to more normal times and a normal balance sheet will probably be signified with a return to a more normal dividend policy thanks to less-constrained capital.
Schwab’s EPS growth fell 20% in 2023, and is on track to decline -3% in calendar ’24 as revenue growth fell 8% last year and is on track to be flat this year, so the custodian will be facing easier comps in late ’24 and through 2025.
Looking at “revenue per employee” metrics, swallowing TD Ameritrade increased headcount from 21,000’ish to the low 30,000s (last quarter, 32,000), so that’s like a bowling ball moving through a snake, but the revenue metrics and hopefully the pre-tax operating margin will start to reflect higher productivity for Chuck and some earnings leverage to kick in.
Schwab conclusion
A lot of positives and earnings drivers could materialize for Schwab in ’25 depending on the election, the yield curve shape, the state of the stock and bond markets, tax (i.e. fiscal policy) and the FOMC’s expected soft landing, but we’ll have to wait and see what materializes.
Schwab is trading at 22x expected 2025 EPS of $3.76 (and that ’25 EPS estimate has been revised lower for 6 straight quarters when it peaked at $5.32 post the June ’23 results), but the estimate is still looking for 23% EPS growth in ’25. If this blog takes the 2023 and 2024 (so far) actual EPS growth rates and averages in 2025 and 2026 expected EPS growth, the “average” is 7%.
Schwab stock peaked at $95 in February ’22, and traded all the way down to $45-46 during the Silicon Valley aftermath in May ’23. Morningstar has a $76 fair value assigned to the stock, but I think SCHW is worth at least $80; thus the stock today is trading at an 18-20% discount to perceived fair value.
(Take all that with a grain of salt. Schwab has seen a plethora of headwinds, the last 2-3 years, so if those headwinds become tailwinds, P/E expansion could kick in and Schwab would trade over $100 without much effort.)
Much rides on the Presidential election, at least from a fiscal policy perspective. As someone who is not a fan of tariffs, the “pro-growth” policies might not be so well received by the bond market(s) if a pro-business Republican Administration would be elected.
A trade over $70 takes SCHW back above the 50 and 200-week moving averages, while a trade back down to $50 is not a plus, and the stock remains range-bound.
Schwab has been a Top 10 holding for the last 15 years and continues to be so. It’s likely capable of $5 per share in EPS, and trading at a 17-20x multiple over time.
Goldman Sachs
When Goldman reports their 3rd quarter ’24 financial results on Tuesday morning, October 16th, consensus is expecting $7.03 in EPS on $11.78 bl in net revenue for expected y-o-y growth of 29% and 0%, respectively.
Goldman is a different animal than was known in the 90s with the loss of a good part of the proprietary trading skill, trouble getting an asset or wealth management arm up and going, and – of late – the quiet IPO and mergers and acquisition businesses. It’s probably going to be an “average” quarter for the former white shoe investment bank.
To give some history, with the pandemic, bitcoin, and SPAC craze in 2020 and early 2021, Goldman managed to generate $60 in 4-quarter-trailing (TTM) EPS. That peak quarter was Sept ’21, and the peak EPS was $61.63.
Today Goldman’s TTM EPS is $32.44, but the stock has traded over the all-time highs of $418-420 in mid to late ’21 thus Goldman has seen P/E expansion in 2024, but the stock is very overbought on the weekly chart and looks to need a deeper correction.
After EPS fell 49% in 2022 and then -24% last year (on a calendar year basis), EPS growth for calendar ’24 is expected to grow 56%, and thus the last three-year average will be -4%.
On a valuation basis, GS is trading over 1.5x book value and 1.7x tangible book, which is the highest valuation relative to those metrics it’s had since 2004-2005. At least historically, Goldman is sporting its richest valuation in years.
The fly in the ointment in terms of timing valuation is that Goldman’s business is transforming into a more consistent, stable EPS and revenue grower, and thus, over time it will naturally get a higher valuation.
In the 1990s, the big brokerage stocks like Goldman, Morgan Stanley, Lehman, and a host of others saw EPS volatility that mimicked the semiconductor sector. Back then, relative to the brokerage stocks (with proprietary trading), technology looked like utilities.
Morgan Stanley (MS) has done a better job of transitioning to the asset and wealth management game than Goldman (in my opinion); thus Morgan has positioned themselves (earlier and faster) for a safer, less volatile revenue stream.
I prefer Morgan Stanley to Goldman here, and reduced the Goldman position to a very small amount in the last few days. Goldman needs a healthy correction.
Summary
This summary covers just Schwab and Goldman, both of which are scheduled to report next Tuesday morning, October 16th, 2024.
None of this is advice or a recommendation, but only an opinion. Past performance is no guarantee of future results. Investing can and does involve the loss of principal, even for short periods of time. All EPS and revenue estimates are sourced from LSEG.
Thanks for reading.
Editor’s Note: The summary bullets for this article were chosen by Seeking Alpha editors.

