Summary:
- Visa continues to demonstrate impressive growth, with significant increases in revenue, transaction volume, and net income, despite its already massive size.
- Despite Visa’s strong performance and market leadership, I maintain a neutral stance due to its high valuation relative to the broader market.
- Analysts are optimistic about Visa’s upcoming earnings, but I believe the stock will perform in line with the market over the long term.
- Visa’s valuation metrics are high, but not enough to warrant a sell rating; it remains a hold due to its consistent growth and market position.

hatchapong
If you were to make a list of the giants of the payment processing industry, one company that would be undeniably at the top is Visa (NYSE:V). The firm, as of this writing, boasts a market capitalization of $523.1 billion. And despite this massive size, management has demonstrated attractive growth, both on the top and bottom lines. That growth has continued into the current fiscal year and has propelled shares up in recent months. Three months ago, in July of 2024, I wrote an article that took a neutral stance on the company. Even though I acknowledged how high-quality the operations were and the consistent growth the company had achieved, I couldn’t get past the valuation. Even so, shares are up 5.5% since then, while the S&P 500 is up only 2.6%.
During this short window of time, it is clear that I have been incorrect. However, if you look back further to the first this article in which I rated the company a ‘hold’, I have been incorrect in the opposite direction. You see, when I rate a company a ‘hold’, it’s my statement that shares are unlikely to materially outperform or underperform the broader market for the foreseeable future. And since my first ‘hold’ rating on the stock in November of 2023, shares are up only 9.6% while the S&P 500 is up 27.1%. This is in spite of the fact that the company continues to make interesting innovations and achieve remarkable growth for its size.
Part of investing requires that you be flexible and focused on the long haul. Even though my most recent call and my oldest call on the payment processor have been proven wrong up to this point, I do maintain that over the long haul my assessment will probably be accurate. This doesn’t mean the picture can’t change. In fact, after the market closes on October 29th, management is expected to announce financial results covering the final quarter of the 2024 fiscal year. If results come in far greater than analysts anticipate, it wouldn’t be surprising to see the stock move up quite a bit. But with the expectation of rapid growth on a year-over-year basis already, there is definitely a chance that the company could fall short. Either way, I’m keeping my neutral stance on the business for now. But those who have a vested interest in it would be wise to pay careful attention near the end of this month when new results are released.
A great company
Author – SEC EDGAR Data
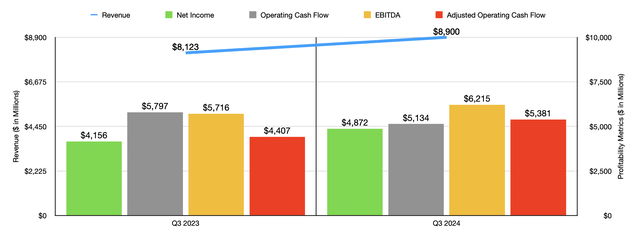
I have never had a problem when it comes to the quality of the operation that is Visa. The company truly is a remarkable firm with a fantastic track record. As an example of this, we need only look at the most recent results, which cover the third quarter of the 2024 fiscal year. During this time, sales for the business came in at $8.90 billion. That’s 9.6% above the $8.12 billion the company reported one year earlier. An increase in the number of cards in circulation from 4.2 billion to 4.5 billion made possible a rise in both transactions and transaction volume.
Author – SEC EDGAR Data
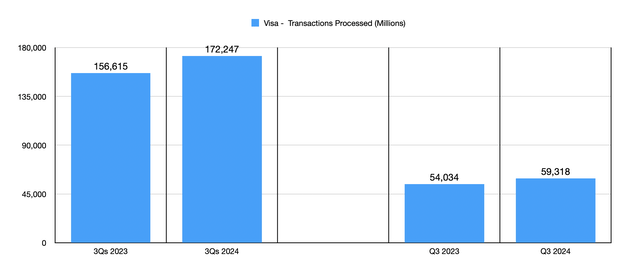
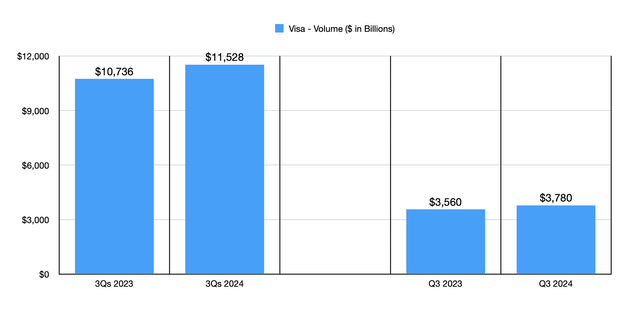
During the quarter, the company processed 59.32 billion transactions. That is a mind-boggling number to me. However, it is a testament to the size and scope of the company. This represents an increase of 9.8% compared to the 54.03 billion transactions that the company reported the same time last year. Naturally, this would lead to an increase in transaction volume. Payments volume for the company in the most recent quarter stood at an astounding $3.78 trillion. To put this in perspective, if Visa was a standalone country, and if the volume of its transactions were its GDP, it would be the 6th largest nation on the planet from an economic perspective. This would place it just above the UK and right behind India. Despite this massive size, the company achieved strong growth year over year. In fact, the volume of transactions processed during that quarter ended up being 6.2% above the $3.56 trillion processed one year earlier.
Author – SEC EDGAR Data
Such significant top-line growth has made possible strong bottom-line growth as well. Net income for the company grew from $4.16 billion to $4.87 billion. Not every profitability metric came in stronger year over year. Operating cash flow, for instance, dropped from $5.80 billion to $5.13 billion. If we adjust for changes in working capital and for client incentives, we would actually get an increase from $4.41 billion to $5.38 billion. And finally, EBITDA for the business grew from $5.72 billion to $6.22 billion.
Author – SEC EDGAR Data
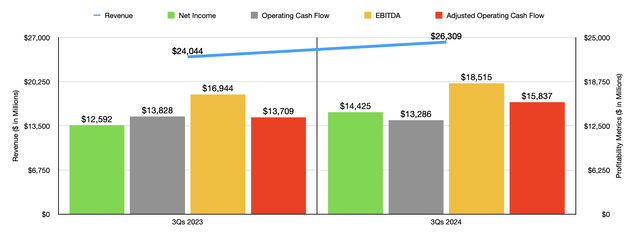
These strong results were not some blip on the radar. They actually represent part of a larger trend. For the first nine months of the 2024 fiscal year, revenue for the company was $26.31 billion. That compares favorably to the $24.04 billion the company reported at the same time in 2023. The firm benefited from a rise in the number of transactions from 156.62 billion to 172.25 billion. This pushed volume up from $10.74 trillion to $11.53 trillion. This is greater than the size of every economy on the planet, with the exception of the US and China. In fact, to get a number slightly larger than this, you would have to add up the economies of Germany, Japan, and France.
Profitability for the company also jumped. Net income grew from $12.59 billion to $14.43 billion. We did see operating cash flow fall, but only slightly, from $13.83 billion to $13.29 billion. On an adjusted basis, it actually surged from $13.71 billion to $15.84 billion. And finally, we have EBITDA. According to the estimates, it totaled $18.52 billion during the first nine months of 2024. That compares favorably against the $16.94 billion reported one year earlier.
We don’t really know how the company will perform for the final quarter of the year. Management said that revenue should grow at a low double-digit rate. If we assume that this will imply a 10% growth rate, then it would translate to revenue of about $9.47 billion. That’s up from the $8.61 billion reported last year. Analysts, meanwhile, expect sales very close to that of $9.48 billion. On the bottom line, the picture is more complicated. Management did say that earnings per share should be at the high end of the low double-digit range. But that doesn’t give us much to work with. Analysts do expect a reading of $2.57 per share in profits. That compares to $2.27 per share reported the same time one year ago. Should this come to fruition, this would translate to an increase in net profits from $4.68 billion to $5.73 billion.

Author – SEC EDGAR Data
This assumes that share count remains unchanged. During the third quarter, on its own, the company did allocate $4.77 billion toward buying back 17 million shares of stock. And for the first nine months of this year, they allocated $11.16 billion toward buying back 42 million shares. Unfortunately, we don’t know what to expect when it comes to the other profitability metrics. But in the table above, you can see what these were for the final quarter of the 2023 fiscal year. If revenue and profits are going to increase, these other metrics should increase as well.
Author – SEC EDGAR Data
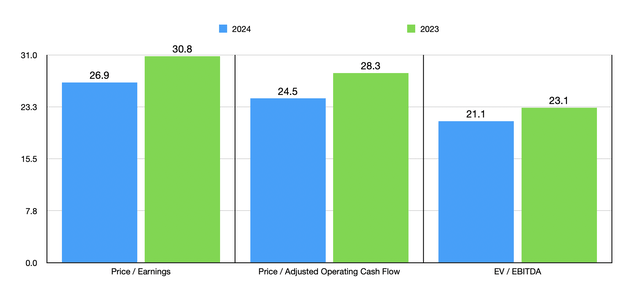
When it comes to valuing the company, perhaps the most appropriate approach would be to annualize the results that we have seen so far for the year. Doing this would give us net profits of $19.46 billion, adjusted operating cash flow of $21.35 billion, and EBITDA of $24.99 billion. Using these estimates, we can see in the chart above just how the stock is currently valued. This includes a set of valuations using the 2023 figures. To be honest with you, these are multiples that I consider to be quite high. This is the case even with such a high-quality firm with attractive growth. But they aren’t so high that I would push for a ‘sell’ rating just yet.
Author – SEC EDGAR Data
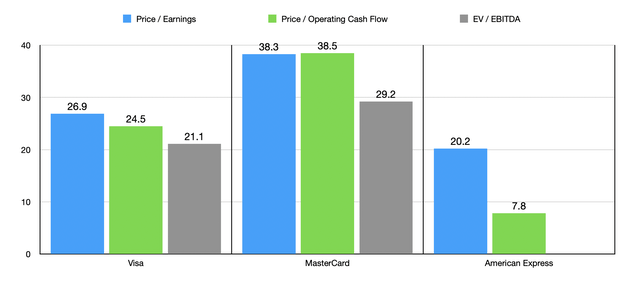
In the chart above, I then decided to compare Visa to two other major players. These are none other than Mastercard (MA) and American Express (AXP). You might notice that there is no entry for the EV to EBITDA multiple for American Express. But that’s because of the company’s corporate structure. On a price to earnings basis, Visa is in the middle of the group. The same is true on a price to operating cash flow basis. Meanwhile, on an EV to EBITDA basis, our candidate did end up coming in cheaper than rival Mastercard.
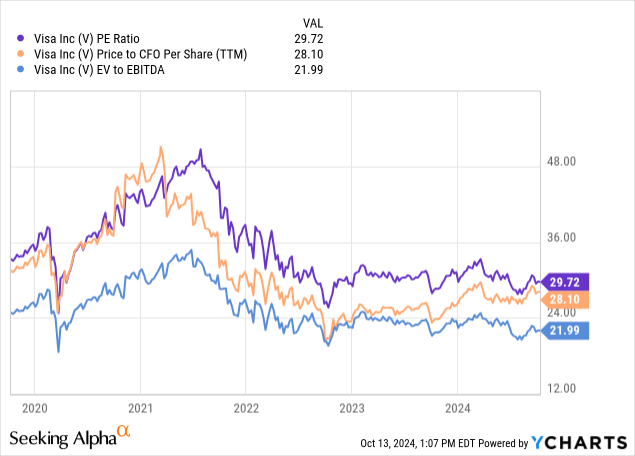
Those who are more bullish about Visa might point out that the company’s trading multiples are within the historic range. In fact, depending on how you cherry-pick the data, they may even argue that it’s trading near the low end of the range, as illustrated in the chart above. I would agree that the business is not trading outside of what it has for the past few years. The one exception to this is during the time of the COVID-19 pandemic. But during that time, conditions in the economy were so crazy that you would expect to see fundamentals become disjointed from pricing. You can make this case with pretty much any company in pretty much any industry.
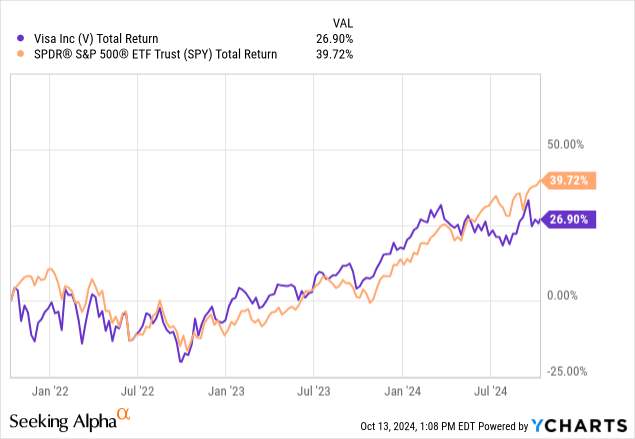
You can see the historical trading multiples of the company over the last five years in the aforementioned chart. These numbers are slightly different than what I have in my tables and charts because this chart utilizes trailing 12-month data. But even so, the differences are not materially significant. In the chart above and in the chart below, I then decided to compare the historical performance of Visa to the S&P 500. For the S&P 500, I’m using the SPDR S&P 500 ETF Trust (SPY). The chart above looks at performance over the last three years. And the chart below looks at performance over the last five years. Over the three-year window, it’s clear that Visa has underperformed the market to some extent. And over the five-year window, you can see that the performance disparity is drastic.
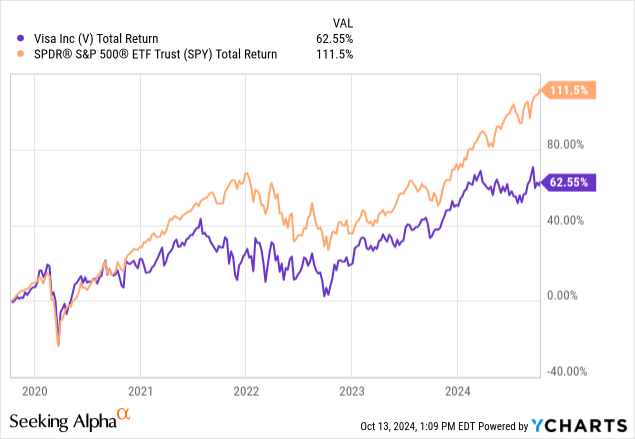
This is not to say that Visa has been a bad prospect. However, it does not fit my definition of a ‘buy’ candidate. You see, when I rate a company a ‘buy’, it is my statement that I believe that shares should outperform the broader market for the foreseeable future. My rationale here is that if I can’t outperform the market with individual stock picks, I am better off just putting the money into an index fund or ETF. And clearly, during these two windows of time, Visa falls short.
Author – SEC EDGAR Data
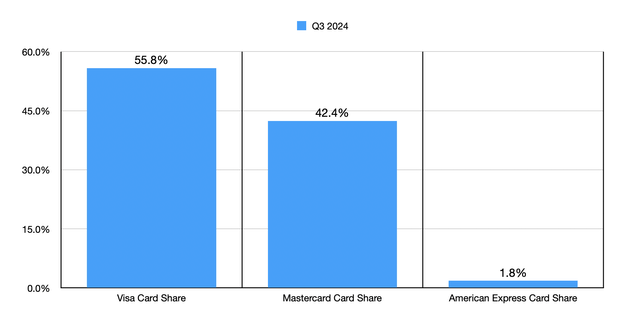
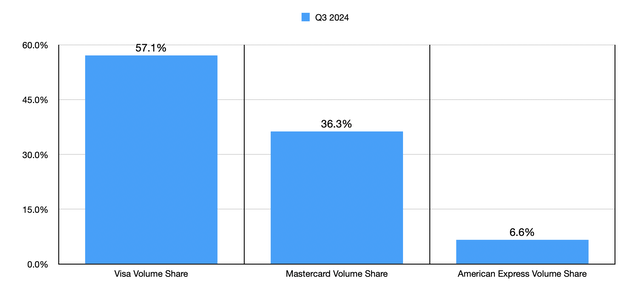
I would also like to point out that, while Visa does appear to be more in the middle of the group from a valuation perspective, the company does have a market leading position compared to the competition. If you were to look at the share of cards outstanding between the three companies, Visa would be the most significant with a market share of 55.8%. By comparison, Mastercard stands at 42.4%, while American Express has a share of only 1.8%. A similar analysis can be done when looking at payment volume. All combined, in the most recent quarter, the companies boasted $6.62 trillion worth of payments. The $3.78 trillion processed by Visa implies a 57.1% share between the three companies. Mastercard, meanwhile, has only a 36.3% share, while American Express is a distant third at 6.6%. Some might argue that this means that Visa is undervalued relative to Mastercard. But I would take a different approach. Frankly, I would just state that Mastercard is quite a bit overvalued.
Author – SEC EDGAR Data
Takeaway
Heading into earnings, things are going to get interesting. Analysts appear to be optimistic, and I can understand why that would be. Irrespective of how the company does when its data does come out, it has demonstrated time and time again that it is a great operator that continues to expand. But this doesn’t necessarily mean that the company makes sense to buy into. In the long run, I suspect that shares will perform more or less along the lines of the broader market. And because of this, I’ve decided to keep the company rated a ‘hold’ for now.
Analyst’s Disclosure: I/we have no stock, option or similar derivative position in any of the companies mentioned, and no plans to initiate any such positions within the next 72 hours. I wrote this article myself, and it expresses my own opinions. I am not receiving compensation for it (other than from Seeking Alpha). I have no business relationship with any company whose stock is mentioned in this article.
Seeking Alpha’s Disclosure: Past performance is no guarantee of future results. No recommendation or advice is being given as to whether any investment is suitable for a particular investor. Any views or opinions expressed above may not reflect those of Seeking Alpha as a whole. Seeking Alpha is not a licensed securities dealer, broker or US investment adviser or investment bank. Our analysts are third party authors that include both professional investors and individual investors who may not be licensed or certified by any institute or regulatory body.
Crude Value Insights offers you an investing service and community focused on oil and natural gas. We focus on cash flow and the companies that generate it, leading to value and growth prospects with real potential.
Subscribers get to use a 50+ stock model account, in-depth cash flow analyses of E&P firms, and live chat discussion of the sector.
Sign up today for your two-week free trial and get a new lease on oil & gas!
