Summary:
- I previously rated Amazon.com, Inc. as a Strong Buy in December 2023 with a price target of $180, which the stock has now reached.
- Amazon operates in six major segments: 1st Party, 3rd Party, Physical, Subscriptions, Advertising, and Cloud, each contributing uniquely to its revenue.
- A Bear- and Bull-Case Discounted Cash Flow Analysis was used to evaluate Amazon, considering growth rates and EBIT-margins for each segment.
- Given this valuation method, the company could currently be undervalued by up to 117%.
Julie Clopper
In this article, we are revisiting Amazon.com, Inc. (NASDAQ:AMZN) from my latest article on AMZN in December 2023, where I rated the company as a Strong Buy with a price target of $180. From this, the stock returned a solid 25% to today’s price, meaning that we are currently pretty much at my then defined price target.
My Amazon Stock Coverage (seekingalpha.com)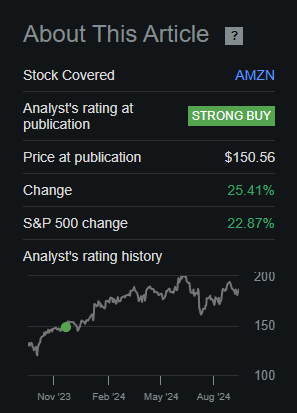
To get a realistic valuation, we briefly analyze every business segment of AMZN, define suitable growth rates and EBIT margins for each segment and finally evaluate the whole company using a Bear- and Bull-Case Discounted Cash Flow Analysis. For more details on the different segments of Amazon and their current operations, please refer to the above-mentioned article.
Starting Point
Since Amazon isn’t declaring the profitability of each of its business segments, we have to get a bit creative here to get a financial starting point for our following analysis. Amazon is declaring the profitability of the AWS (Cloud) segment separately from the rest, meaning we can at least use this as the first anchoring point. Since subscriptions, 1st and 3rd party are connected through offerings like free shipping with Amazon Prime, I tried to at least find a suitable profitability metric for the advertisement segment of Amazon. The two main competitors in the advertising space, Google (GOOG) (GOOGL) and Meta (META), are currently having EBIT margins in the range of 25% to 40%. For our starting point, I assumed an EBIT margin of 25% in Amazon’s advertisement segment.
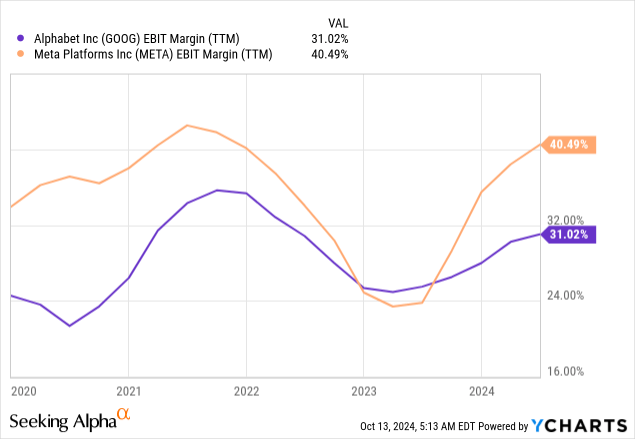
To then get close to the stated EBIT of each year, I then broke down the remaining EBIT on the remaining business sectors for each financial year. Because some segments overlap, it is exceedingly difficult to forecast exact measurements in this case. These measurements, however, simply represent the beginning of each segment.
Assumptions Starting Point (own assumptions)
eCommerce (1st and 3rd Party)
The eCommerce market is expected to grow at a CAGR of ~9.5% over the various markets until 2029.
eCommerce Growth per Region 2024 to 2029 (statista.com)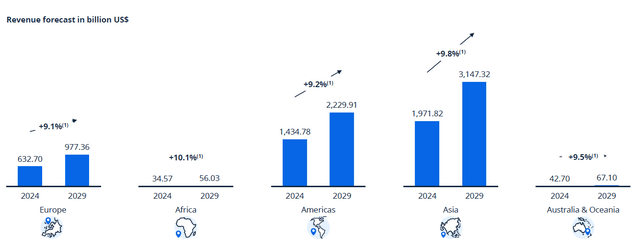
If we factor in the increasing priority of 3rd party at Amazon, we can assume the following growth rates for the eCommerce business segments.
Amazon 1st vs. 3rd party sales (statista.com)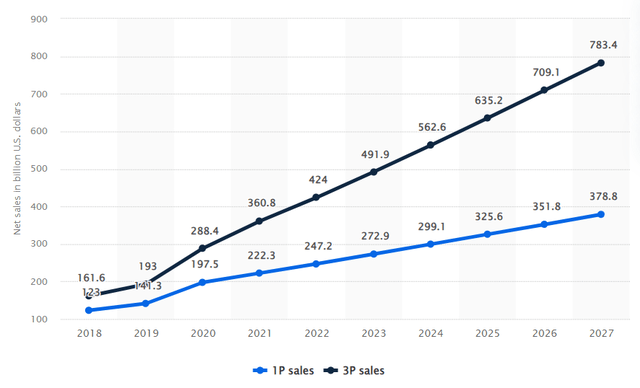
Amazon share of 3rd party sales of the years (statista.com)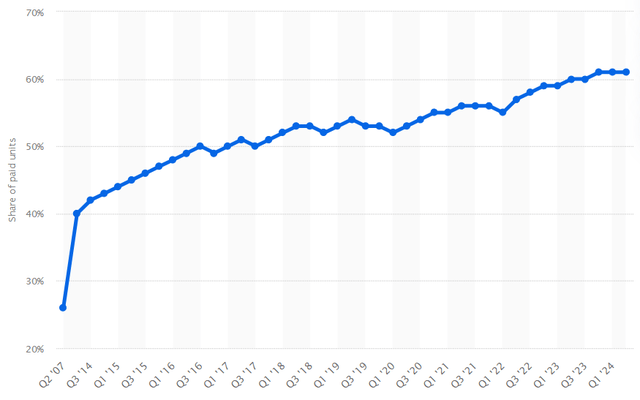
1st Party
Bear: 3% p.a.
Bull: 5% p.a.
3rd Party
Bear: 10% p.a.
Bull: 15% p.a.
These seem rather conservative, factoring in the latest growth rates in the 3rd party segment of 13.9% in 2022 and 19% in 2023.
The average net margin for the online retail is right around 7%.
Average net margin per business segment 2022 (statista.com)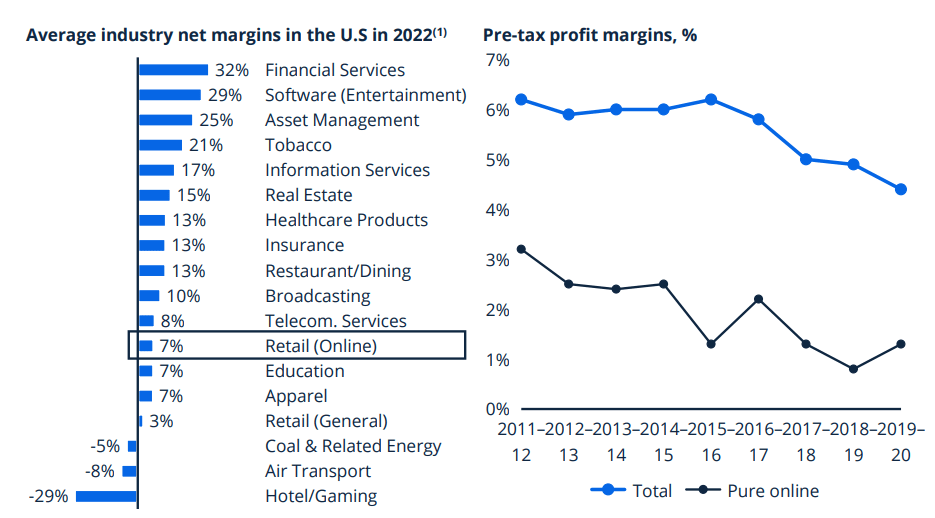
I think given this metric, we can assume the following margin development for the 1st party from the above defined starting point.
| EBIT Margin 1st | 2023 | 2024 | 2025 | 2026 | 2027 | 2028 | 2029 | 2030 | 2031 |
| Bear | -6% | -3% | 0% | 2% | 4% | 5% | 5% | 5% | 5% |
| Bull | -6% | 0% | 2.5% | 5% | 7.5% | 7.5% | 7.5% | 7.5% | 7.5% |
Taking a look at the 3rd party margins, it becomes apparent why Amazon is increasingly focusing in this segment. The margins of the two main competitors, eBay (EBAY) and Etsy (ETSY), are currently sitting right around 10% to 38%. While the average of eBay over the last few years was more right around 25%.
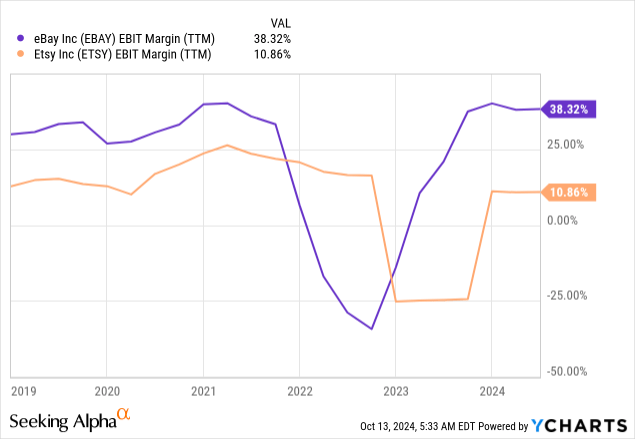
I think that it is reasonable to assume that Amazon will – eventually – achieve similar margins to eBay, which gives us the following assumptions:
| EBIT Margin 3rd | 2023 | 2024 | 2025 | 2026 | 2027 | 2028 | 2029 | 2030 | 2031 |
| Bear | 4.5% | 10% | 15% | 15% | 15% | 15% | 15% | 15% | 15% |
| Bull | 4.5% | 15% | 25% | 25% | 25% | 25% | 25% | 25% | 25% |
Physical Stores
This segment is a slow growth and low margin business for Amazon, taking a look at recent growth rates of this segment and the EBIT-margin of one major competitor, Kroger (KR).
Amazon Physical Stores Growth(Amazon Quarterly Earnings Q1/23 to Q2/24)
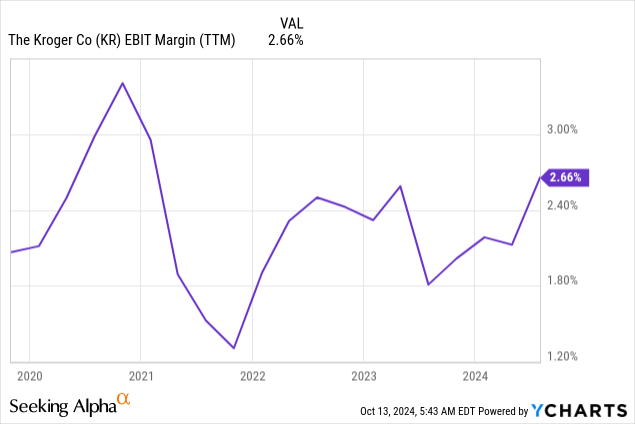
Keeping this in mind, the following assumptions seem fitting:
Bear: 3% p.a.
Bull: 10% p.a.
Considering the “cashierless” technology of Amazon in this segment, the profitability should improve, giving us the following EBIT assumptions:
Bear: 5%
Bull: 10%
Without wasting more time with this rather unimportant segment, we jump right into the more promising segment subscriptions.
Subscriptions
The revenue growth rate in this segment is currently at around 11%, a slight decline from historical numbers of ~30%.
Amazon Subscriptions Growth (Amazon Quarterly Earnings Q1/23 to Q2/24)
| [million USD] | 2018 | 2019 | 2020 | 2021 | 2022 | 2023 |
| Revenue | 14,168 | 19,210 | 25,207 | 31,768 | 35,218 | 40,761 |
| YOY Growth | 46% | 36% | 31% | 26% | 11% | 15% |
If we take a look at the whole streaming market, experts are currently projecting a CAGR of 18.7% for the whole market until 2031. Therefore, the following growth rates seem viable:
Bear: 7.5% p.a.
Bull: 15% p.a.
If we now take a look at the margins of the comparable business Netflix (NFLX), the following assumptions for profitability should be suitable:
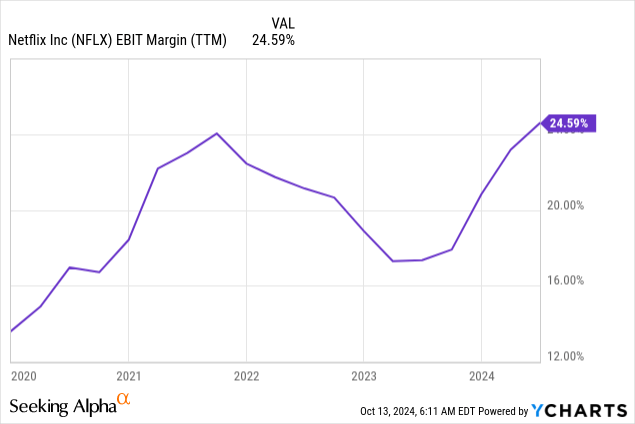
Bear: 15%
Bull: 25%.
Advertising
The advertising segment for me is one of the most exciting and compelling business segments of Amazon. If we take a look at the financial metrics, it becomes apparent why I think so.
The digital advertising spending worldwide is expected to grow at a CAGR of 15.5% until 2030.
This is already pretty impressive, if we however factor in that Amazon is currently – apart from TikTok – the only major competitor that is gaining market share in this very saturated market, the prospects look even better.
Share of major ad-selling companies in digital advertising (statista.com)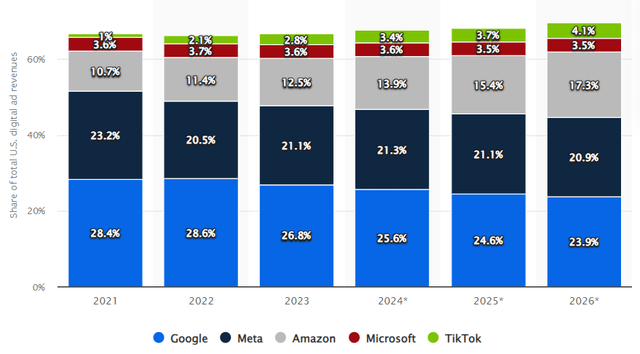
Given this development, these growth metrics seem fitting for the advertising segment.
Bear: 10% p.a.
Bull: 20% p.a.
Like mentioned at our starting point, the EBIT-margins of Meta and Google are currently at around 25% to 40%, with Google being suppressed by their massive Others segment. More on this issue in my latest Google article. Amazon should be able to at least achieve similar margins or might even be able to surpass these, as their ads are way more targeted towards customers that are already willing to buy something. Since they are already on Amazon’s side surfing for products to buy. Because of this, I came up with the following assumptions:
| EBIT Margin Ads | 2023 | 2024 | 2025 | 2026 | 2027 | 2028 | 2029 | 2030 | 2031 |
| Bear | 25% | 30% | 30% | 30% | 30% | 30% | 30% | 30% | 30% |
| Bull | 25% | 30% | 35% | 40% | 45% | 45% | 45% | 45% | 45% |
Cloud – AWS
The global cloud, market is expected to grow at a CAGR of 21.2% from 2024 to 2030. As Amazon is currently maintaining its dominant market share, a growth rate right around the market growth rate looks promising.
Cloud Infrastructure Market Share per Quarter (statista.com)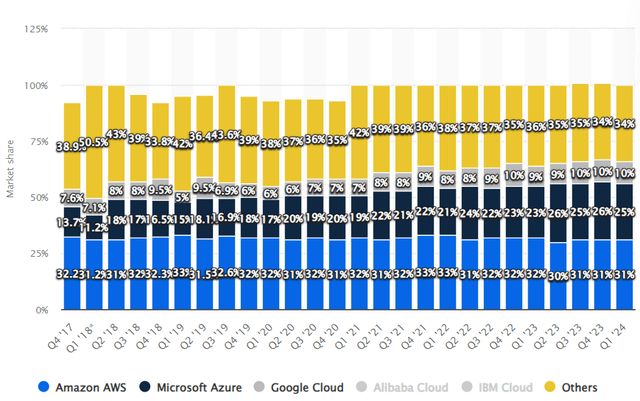
Bear: 15% p.a.
Bull: 20% p.a.
With our Bull Case, I only projected 20% annual growth because it appears unfeasible to rise beyond the market given the already massive market share and the elevated growth rate of 20% for 8 years.
For the profitability, I assumed the following metrics:
| EBIT Margin AWS | 2023 | 2024 | 2025 | 2026 | 2027 | 2028 | 2029 | 2030 | 2031 |
| Bear | 27% | 25% | 25% | 25% | 25% | 25% | 25% | 25% | 25% |
| Bull | 27% | 35% | 35% | 35% | 35% | 35% | 35% | 35% | 35% |
Discounted Cash Flow Analysis
For our Discounted Cash Flow Analysis (“DCF”), we need a few additional assumptions.
- Tax Rate: Here I averaged out the last four years and arrived at an average tax rate of 14.4%.
- Free Cash Flow Conversion: I found an appropriate EBIAT to Free Cash Flow Ratio after computing the EBIAT using the tax rate given above. Since 2021 and 2022 appear to be outliers in this case, I averaged out the EBIAT To FCF from 2017 through 2020 and 2023. This gave me a conversion rate of 101%. For an additional margin of safety, I used 85% in the following DCF.
| 2017 | 2018 | 2019 | 2020 | 2021 | 2022 | 2023 | |
| EBIAT | 3,277 | 11,104 | 12,069 | 20,197 | 21,744 | 10,729 | 31,545 |
| EBIAT to FCF | 154% | 75% | 114% | 54% | -142% | -208% | 117% |
| FCF | 8,307 | 19,400 | 25,800 | 31,020 | -9,069 | -11,569 | 36,800 |
- WACC: Here I used 9%, which is also higher than Amazon’s current WACC meaning additional margin of safety.
- Perpetuity Growth Rate: Here I used 3%, which is pretty conservative for this company if you ask me.
Bear-Case
Main Assumptions Amazon Bear-Case (aboutamazon.com; seekingalpha.com; own assumptions) DCF Amazon Bear I (aboutamazon.com; seekingalpha.com; own assumptions) DCF Amazon Bear II (aboutamazon.com; seekingalpha.com; own assumptions)

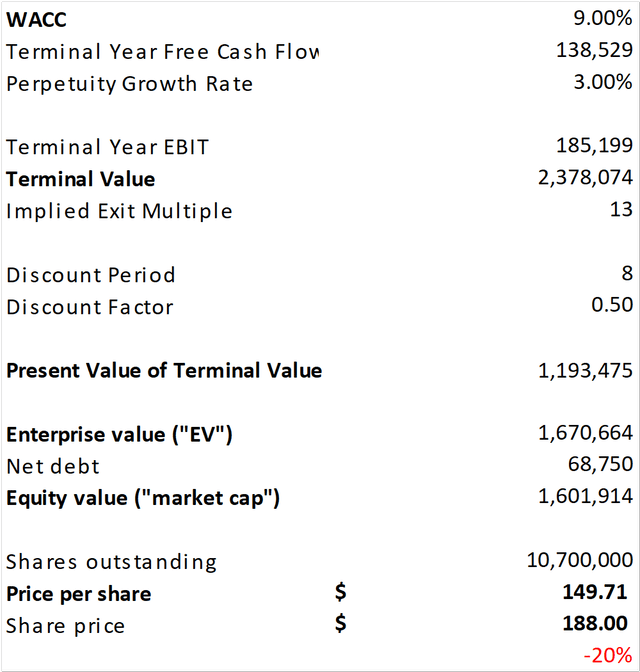
With our Bear-Case DCF, we get a target share price of ~$150, indicating that the company could currently be overvalued by 20%. However, keep in mind that this factors in decelerating growth rates below-market rates and lower profitability compared to competitors.
Bull-Case
Main Assumptions Bull-Case (aboutamazon.com; seekingalpha.com; own assumptions) DCF Amazon Bull I (aboutamazon.com; seekingalpha.com; own assumptions) DCF Amazon Bull II (aboutamazon.com; seekingalpha.com; own assumptions)

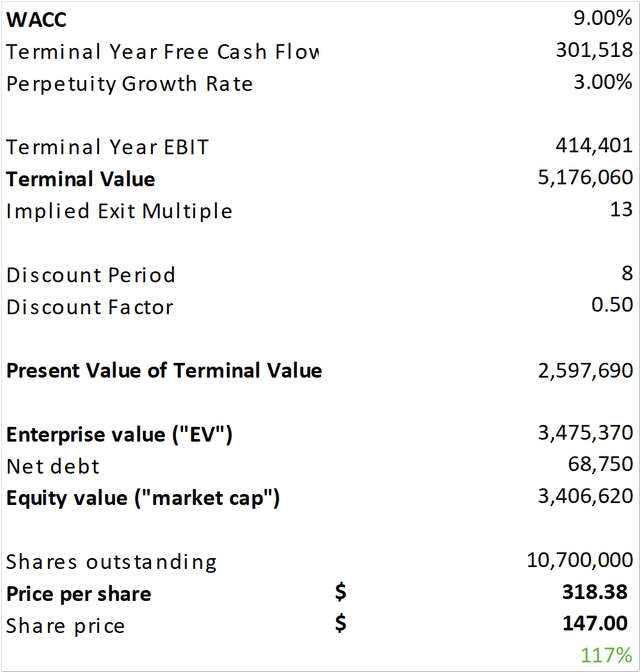
The Bull-Case indicated a fair value share price of ~$318, which would translate in an undervaluation of a whopping 117%! On the other hand, they include profit margins that are larger than those of their main rivals and growth rates that surpass the market.
Conclusion
If we take a look at the last year of our Bull-Case scenarios, we can clearly see on what segments Amazon should focus on in the upcoming years.
2031 Bull-Case Prediction (DCF)
The biggest EBIT contributors are the Cloud, Advertising and 3rd Party segment. This is why in the upcoming earnings call (earnings to be released on October 25th), I will lay special emphasis on the relevant metrics in these few segments. I also would prefer if Amazon starts to stop “experiments” like the physical stores and focus on their core growth catalysts.
With our Bear- and Bull-Case analysis, we get a miss-pricing in the range of -20% to 117%. As always, the truth is probably laying somewhere in between these two scenarios, since some risks, like another lawsuit, can’t really be considered in such an DCF-analysis.
I nevertheless think that the current valuation is still a very good entry point into Amazon, considering that the assumptions we made are very realistic and could very well exactly play out as expected. That is why I currently rate the Stock a Strong Buy, with a medium term price target of $220.
If you have read this far, please consider following me for more deep-dives! Thank you so much for reading!
Editor’s Note: This article was submitted as part of Seeking Alpha’s Best Value Idea investment competition, which runs through October 14. With cash prizes, this competition — open to all analysts — is one you don’t want to miss. If you are interested in becoming an analyst and taking part in the competition, click here to find out more and submit your article today!
Editor’s Note: This article discusses one or more securities that do not trade on a major U.S. exchange. Please be aware of the risks associated with these stocks.
Analyst’s Disclosure: I/we have a beneficial long position in the shares of AMZN either through stock ownership, options, or other derivatives. I wrote this article myself, and it expresses my own opinions. I am not receiving compensation for it (other than from Seeking Alpha). I have no business relationship with any company whose stock is mentioned in this article.
Seeking Alpha’s Disclosure: Past performance is no guarantee of future results. No recommendation or advice is being given as to whether any investment is suitable for a particular investor. Any views or opinions expressed above may not reflect those of Seeking Alpha as a whole. Seeking Alpha is not a licensed securities dealer, broker or US investment adviser or investment bank. Our analysts are third party authors that include both professional investors and individual investors who may not be licensed or certified by any institute or regulatory body.
