Summary:
- Nvidia Corporation is not a stock I normally look to for my main dividend portfolio, but the chart picture is such that I did so indirectly, via the covered call YieldMax NVDA Option Income Strategy ETF.
- But the driver to that decision was my analysis of NVDA, from a technical, sentiment and quantitative standpoint, as detailed here.
- My core approach involves “portfolio engineering” to maximize returns and minimize significant losses, diverging from traditional buy-and-hold strategies. This is the latest example.
Antonio Bordunovi
I’m primarily a dividend investor, outside my trading accounts where just about anything goes. But I see the potential for this recent Nasdaq-infused stock market surge to carry a bit further. An observation I’ve made from studying and experiencing stock market history for decades is this: the last stages of a market cycle tend to be the most intense.
For instance, everyone remembers 2008. But few remember that some of the worst damage was during Q1 of 2009. I was managing my first mutual fund, with an inception date of 8/14/2008. The next 7 months, the S&P 500 (SP500) fell. Well, “fell” is not the right word. It crashed by 55%. And then, like after a hurricane, the weather became very nice again.
But it works the same way at the end of up cycles, too. And while I think that this is closer to the end than the start of a big stock market move, the potential for stocks like Nvidia Corporation (NASDAQ:NVDA) to go “parabolic” in price is there.
This article is primarily my case for fitting NVDA into my personal portfolio. Spoiler alert: I did so recently through purchase of a covered call ETF. But those products have everything to do with the underlying holdings.
So I’ll continue from here by highlighting what I see from a technician and quant’s standpoint. Two reasons I will not offer a deep-dive fundamental take here. First, as my regular readers know, that’s not my approach, and never has been. There are many other analysts at Seeking Alpha who cover the ongoing operational aspects of NVDA.
But I’m a dividend investor. Sure, I can trade around with NVDA stock, leveraged NVDA ETFs or call options (though those are very pricey these days, given the stock’s big time volatility). And I could buy the stock and write covered call options on it. But I’m looking for a way to buy NVDA like a dividend stock.
NVDA has that late-stage-in-cycle look
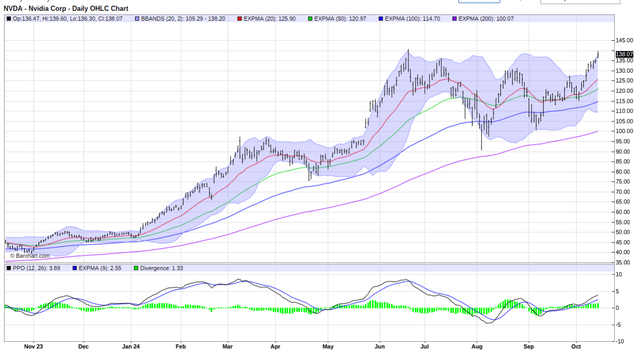
This chart of daily prices (above) has a strong chance at breaking through to new highs. This is a testament to the market’s sheer will to own this dynamic company’s stock. Or, more to the point, to trade it.
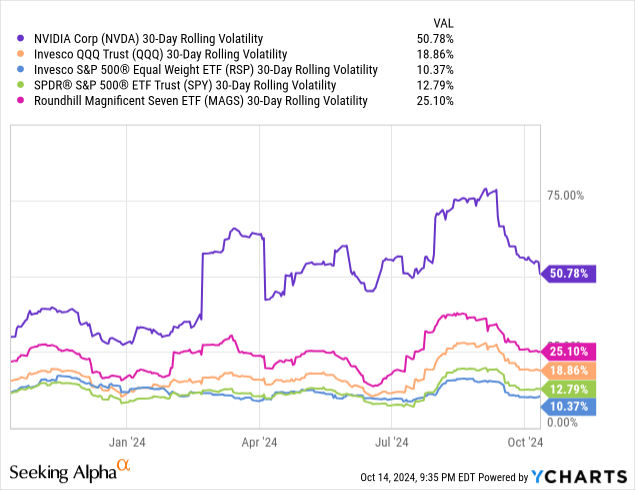
Here’s a picture of that. This is essentially the S&P VIX Index (VIX) volatility index but applied to not only SPY as is the standard. I’ve also charted it for the equal-weighted S&P 500 ETF (RSP), Invesco QQQ Trust ETF (QQQ), and a Magnificent 7 ETF (MAGS). All of them exhibit half the volatility of NVDA stock, or less.
The figure for NVDA has floated between 30% and 70% for the past 12 months. That is some volatility! And it is a direct result of a series of mini booms and busts in the stock price, 20%-50% at a time. Like a financial roller coaster.
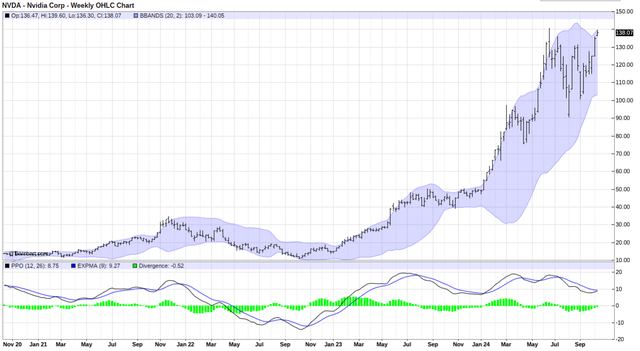
The weekly price chart of NVDA (below) is less exciting. But we all know that this stock can get exciting at any moment. If it does hit not just a new high, but a new trading range more than a few percentage points beyond the recent peak, it will likely turn this weekly chart more positive. But let’s not get ahead of ourselves, even if much of the investor interest NVDA is a couple of years into that process.
NVDA factor grades analysis
The market tries to put a value on a company that has recently been able to sell about all of its product (graphics processing units, or GPUs) that it wants. Artificial Intelligence spending has been strong, and the dominant provider of semiconductors for that revolution is NVDA. Competition will come along over time, but I cannot think of a clearer “first mover advantage” I’ve seen in the past quarter-century. The company’s data center networking business only adds to the attraction. Not at any price, but I “get” the excitement.
And nothing says excitement like an F grade for valuation! But NVDA has been there for a while, as indicated in this table below. That in itself is not a reason to avoid the stock. With that said, this is what I refer to as an “extended” stock. That’s more of a technical analysis term, but I’m using it here to describe my view that the stock is expensive, and way up in price such that it is “priced for perfection.” That’s a double-edged sword, and we’ve seen that play out via multiple quick and sharp price declines. So for someone like me who prioritizes position size, on equal terms with what stocks I actually own, this is one that has a low ceiling in terms of how much of my portfolio I’d commit at this level.
Growth, momentum, and profitability are all stellar, as expected. The latter is the one I focus on as part of my initial screen for dividend stocks. But even when the dividend is not the attraction point, I just prefer to focus on businesses I don’t have to worry about in terms of sustainability. Not of earnings, but of the business itself.
Seeking Alpha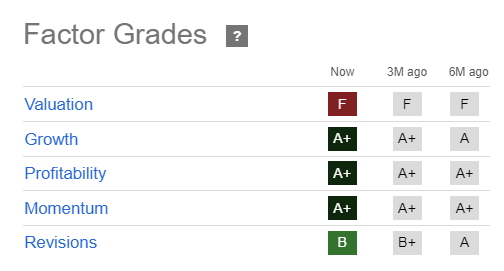
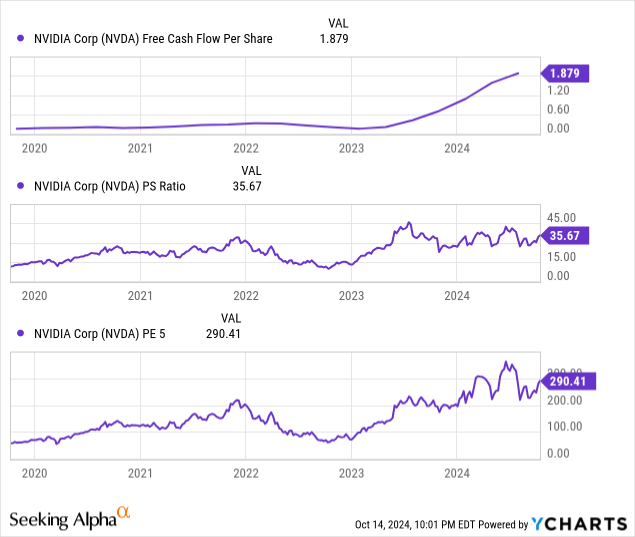
I’ll leave it to other analysts to debate whether NVDA can “grow into its current valuation.” As I said, that’s not my area of expertise or focus. But I will say this after nearly 40 years of stock market analysis, albeit not from the fundamental side of things: I’m not counting on a stock selling at 35x sales or 290 times 5-year smoothed trailing earnings to “grow into” anything.
“Refining” NVDA’s volatility into dividend-like cash flow
I see NVDA as merely a tool to access all of that volatility in a way that I can effectively “refine” like they do in the oil business. But not into petroleum products. Here, I’m talking about refining volatility into dividend-like cash flow.
Finally, here’s how I took my tactically bullish view on NVDA and made it work in my dividend portfolio. I’ve been watching and researching the ETF series from YieldMax. I am skeptical when it comes to product innovation, going back to my days analyzing mutual funds, and then managing a few over the years. But in this case, the shoe fit, so to speak. And I bought a modest position to start, in the YieldMax NVDA Option Income Strategy ETF (NYSEARCA:NVDY). With more than $1 billion in assets under management only 17 months into its young life, NVDY does that buy-write activity and maintains it, which threads the needle for what I’m looking for.
NVDY: understanding that massive yield
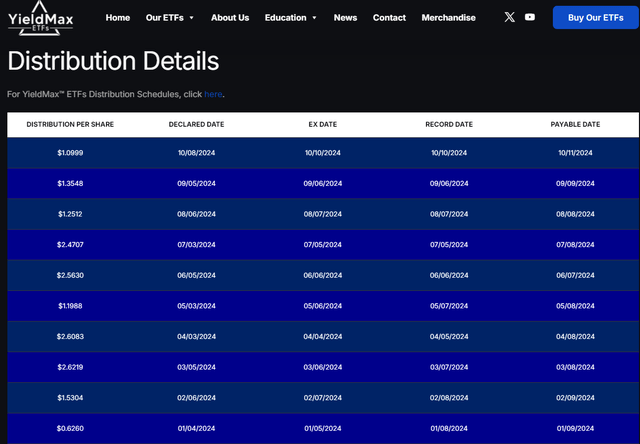
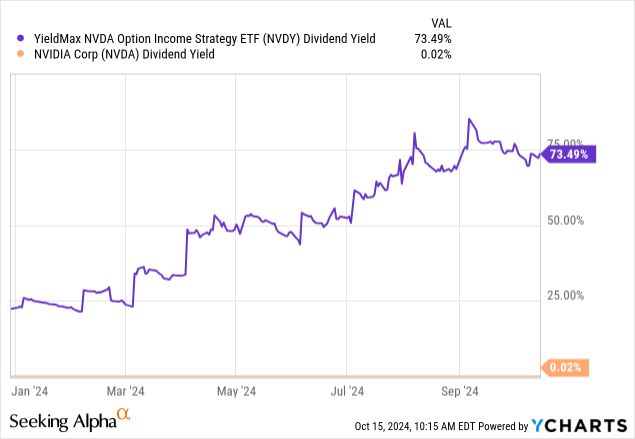
This certainly catches the eye. But it is part reality and part mirage. NVDA pays virtually no dividend, but NVDY purports to be spinning off more than 70%. And during the past 12 months, that’s accurate. But only because of a combination of NVDA’s incredibly high volatility, and the fact that YieldMax was running this ETF more like other covered call ETFs: in a way that allowed for more downside risk in exchange for, as the ETF issuer’s name implies, “max yield.”
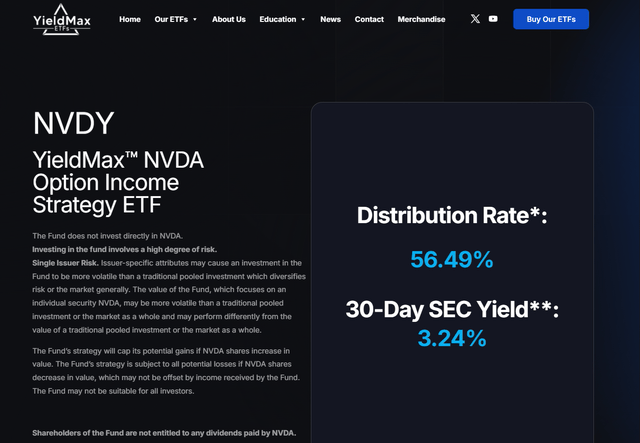
This is from the YieldMax website this morning. It still carries a 56% rate if you simply do what regulators require of fund companies: post the past 12 months’ yield.
However, what is more to the point for me, with this or any ETF and also with stocks, is to determine what the yield might look like going forward. Like I always say about past performance, I can’t have it. I didn’t own NVDY. So rather than get “yield envy” over this, it is better to do what we do with a stock’s “forward yield,” which is where we take the last regular payment and assume it will be the same or similar over the next 12 months.
When I do that with NVDY, I get a $12 a share yield. That’s STILL a 50% yield, so I’m not even counting on that. If I take the 30-day SEC Yield, which is more commonly used for active bond funds, since those rates fluctuate (as those funds own bonds but usually trade them instead of holding to maturity), I still get a reported 3.24%…in 30 days’ time. So now we are down to about 40% annualized yield. I’m not counting on anything apart from dipping my toe in the water and riding the NVDA wave in a way that fits into my broader yield at a reasonable price (YARP) dividend stock portfolio.
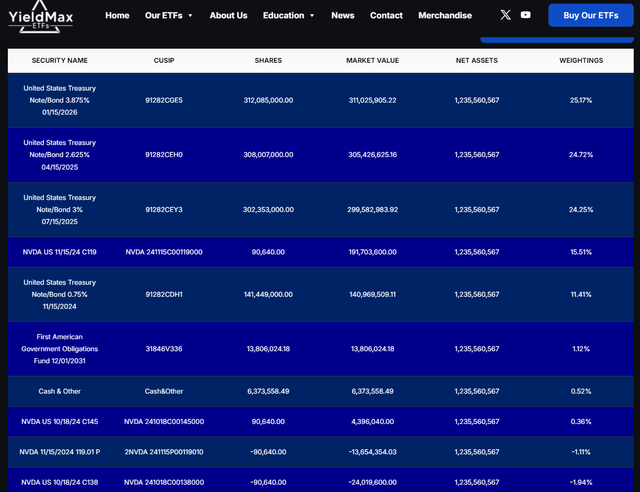
Lastly, on NVDY and the recent adjustment, here is a holdings list. I see lots of T-bills to support the options work, as the ETF does not hold NVDA directly. It uses put and call options to simulate the covered call position.
Here’s a rundown of the options and their purposes:
10/18/24 C145 are the “long” call options bought last month, which simulate the NVDA stock position. They were replaced last week (as Yield Max does 1 week before each monthly expiration) with a $119 call option. Note that these expire on 11/15/24 and make up 15% of NVDY as of now. That’s a risk of 100% loss if NVDA is below $119 in a month.
The 10/18/24 C138 are the “short” calls that brought much of the last month’s income. They will roll off Friday, likely with all 100% of the premium earned.
And the 11/15/24 119.01 P are “short” put options which bring in income now, but force the fund to buy NVDA at that price in the next month, if the stock drops to at or below that price level. So there’s risk there too, along with the income, if NVDA crashes in the next month.
A similar cycle repeats monthly, but there is some flexibility provided to the fund managers as to precisely how they affect the total fund position.
My mission: yield from an uncommon source — NVDA
So to repeat, for emphasis: this article is much less about NVDY because that ETF is just a tool to get access to the juggernaut that is NVDA. And before anyone just assumes that my thesis for owning NVDA in this form is because it produced a 72% yield over the past 12 months, that is purely a mirage going forward.
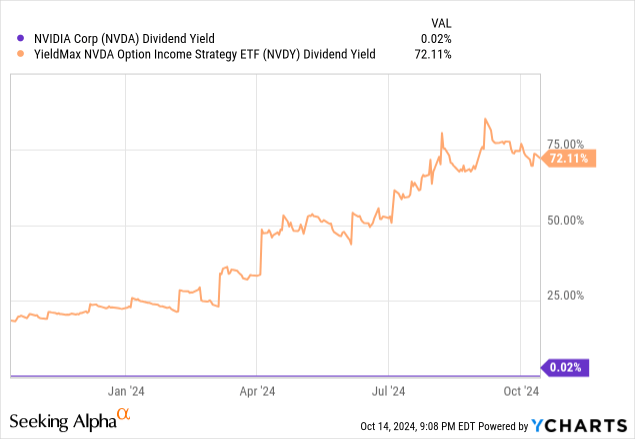
These ETFs came to market in what turned out to be a perfect storm, in a good way. Magnificent 7 stocks like NVDA flew higher, and no different than if there were QQQ covered calls at the end of the dot-com era. When that index went parabolic, the price appreciation, volatility, and yield of the covered call approach all flew higher too. But the ETF issuer in this case made some adjustments to the combination of options used to surround NVDA stock. The bottom line is that it is likely to reduce the yield, but add some cushioning during major market declines.
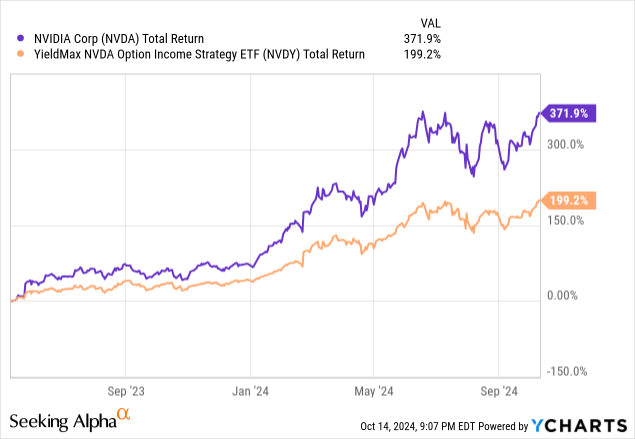
The other reason is that I do not believe for a moment that NVDA is trading based on any reasoned fundamental process. The market sees it as a play thing, which explains the massive option volume and retail interest. I am the last one to dive in and buy something simply because it is popular.
But in the case of NVDA, my interest was in finding a way to spin off yield from a stock that, when I analyze the way I analyze any investment, looks like a potential case of parabolic upward movement. For a little while, anyway.
The next part of the puzzle for me with NVDA is that even with the potential for more upside glory, I have the other side covered. This holding is a complement to the Yield At a Reasonable Price, or YARP, dividend stock portfolio that I have written about here frequently. Alongside the 40 stocks I currently own, I have now 5 different income-driven ETFs, that allow me to supplement the income from those dividend stocks.
But the puzzle is incomplete without the other part of YARP. That is the put and call options pairing (or pairings) I own nearly all the time. The calls are currently on QQQ, so a melt up is just fine by me. My yield stocks might lag, but a small amount of money in those call options allows me to get my “fair share.” And particularly with some form of NVDA-based volatility now in the portfolio, the S&P 500 (SPY) put options I own should help save some downside from this position. It is hard for the broad market index to rise for very long when NVDA is falling steeply. So hedging via the SPY puts takes some worst-case scenarios off the table.
And, while I am not analyzing the dividend here (there barely is one), I do take notice of the fact that earnings don’t happen for another 6 weeks. That allows me some time to earn the NVDY monthly dividend, and see how things are evolving with NVDA stock, the market’s treatment of it, and the broad equity market.
Concluding thoughts
That type of “portfolio engineering” is at the heart of what I do. My goal is to make money as often as possible and avoid big drops. I would be very surprised if NVDA didn’t revisit much lower price levels at some point. But as in the dot com bubble, the latter stages can be the most intense, in the same direction that they have been trending.
For NVDA, while that means risk is high from here forward, it also has parabolic potential. And that drew me to finding a way to have my NVDA cake and eat it too, so to speak.
Analyst’s Disclosure: I/we have a beneficial long position in the shares of NVDA either through stock ownership, options, or other derivatives. I wrote this article myself, and it expresses my own opinions. I am not receiving compensation for it (other than from Seeking Alpha). I have no business relationship with any company whose stock is mentioned in this article.
As noted, I own NVDY (covered call ETF) in my main dividend portfolio. I also trade NVDA via leveraged ETFs and options.
Seeking Alpha’s Disclosure: Past performance is no guarantee of future results. No recommendation or advice is being given as to whether any investment is suitable for a particular investor. Any views or opinions expressed above may not reflect those of Seeking Alpha as a whole. Seeking Alpha is not a licensed securities dealer, broker or US investment adviser or investment bank. Our analysts are third party authors that include both professional investors and individual investors who may not be licensed or certified by any institute or regulatory body.
