Summary:
- Amazon’s stock has experienced recent volatility, breaking resistance to hit record highs, then dropping -24.54% due to disappointing revenue and guidance figures despite strong earnings.
- AWS revenue grew 19%, but lagged behind Alphabet and Microsoft’s cloud growth, raising concerns for investors ahead of the next earnings report.
- Amazon’s forward PE ratio is high at 39.73x, but its forward price-sales ratio of 3.1x makes it attractive compared to peers like Microsoft and Meta.
- Expecting new all-time highs, I am holding my AMZN long position and I have raised my stop-loss level to $168.75 per share.
4kodiak
When I last covered Amazon, Inc. (NASDAQ:AMZN) on May 3rd, 2024 with “Amazon: Major Resistance Break Is Near“, the stock was starting to recover from a downturn of -12.36% that had just occurred over a two-week period. My article thesis was largely based on the growing probability that the stock was on the verge of breaking important resistance levels and generating new all-time highs. Ultimately, this bullish projection did turn out to be highly accurate, but perhaps not in the way that might be generally expected:
AMZN: Record Highs Followed by Sharp Reversal Lower (Income Generator via TradingView)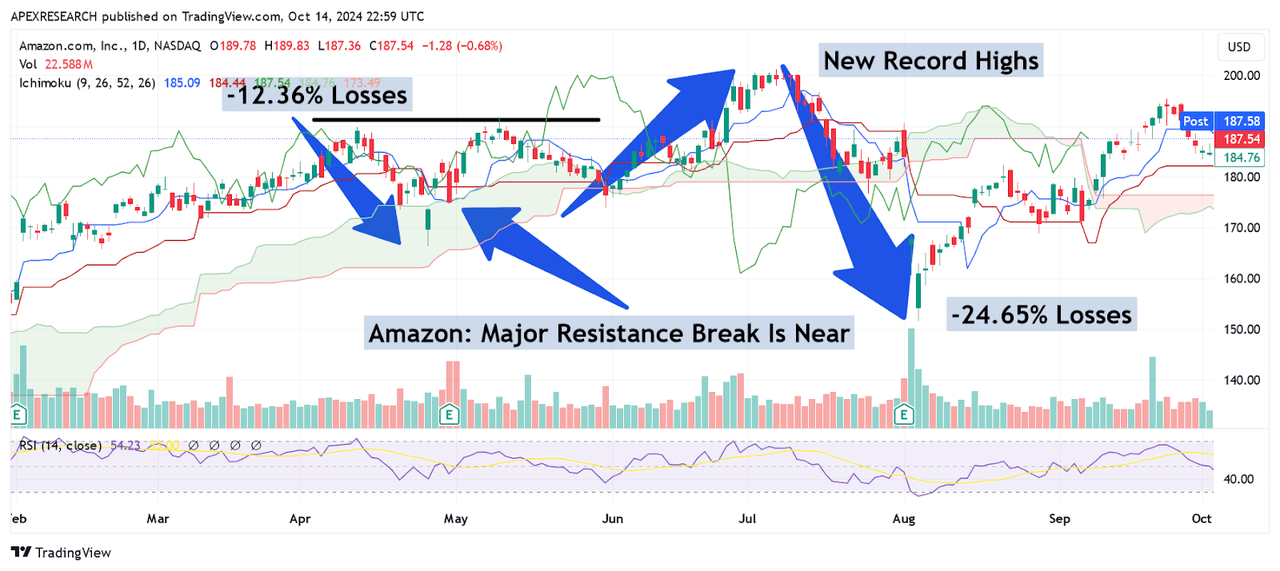
As we can see in the chart above, AMZN stock did break through its key resistance level to post new record highs on July 8th 2024. However, share prices quickly reversed lower and eventually saw declines of -24.54% before stabilizing in early August. Of course, large parts of this negative movement in share prices was based on important weaknesses unveiled in Amazon’s most recent earnings report. During the second quarter period, Amazon reported per-share earnings of $1.26 (which did surpass consensus expectations of $1.03 per share). However, the positive developments largely ended there because the mega-cap e-commerce site also reported quarterly revenues of $147.98 billion (falling short of the consensus estimates calling for $148.56 billion) and provided guidance figures that were also largely disappointing. Specifically, revenue guidance indicate a potential range of $154-158.5 billion (indicating an annualized growth rates of 8-11% and creating a $156.3 billion midpoint), but this also fell far short of the $158.2 billion midpoint figure that marked consensus expectations.
Amazon: Q2 2024 Earnings Figures (Amazon: Q2 2024 Earnings Presentation)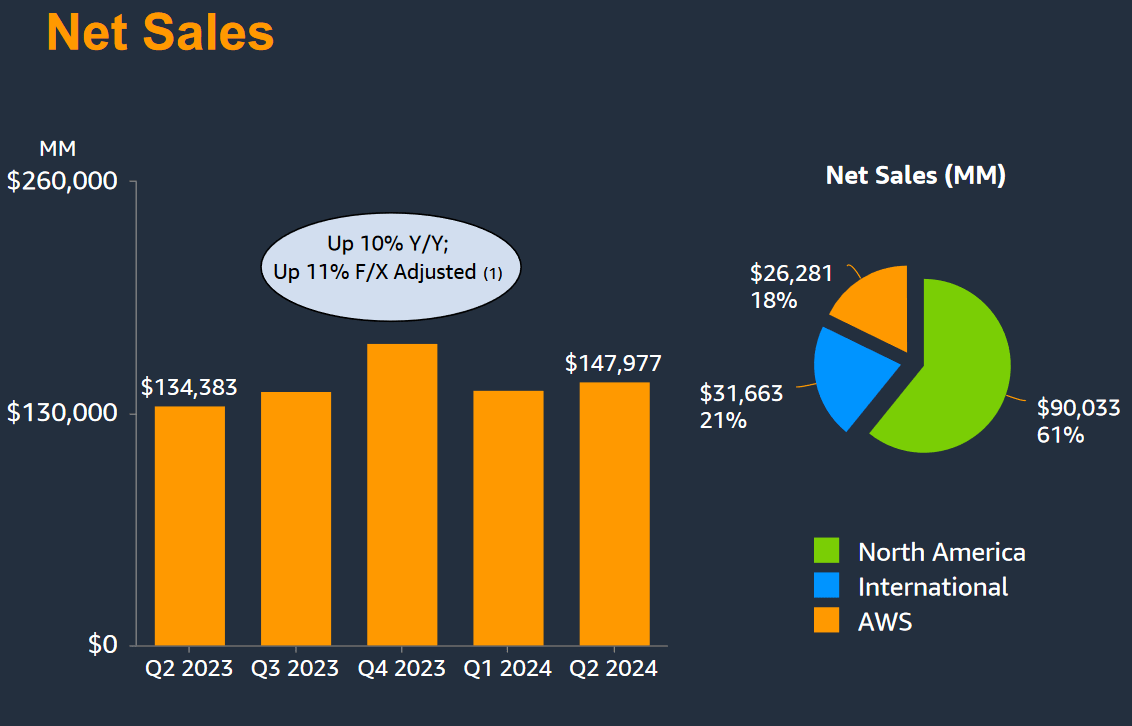
On the positive side, net income figures displayed incredible annualized growth rates of nearly 99.78% (posting at $13.5 billion for the period) and this gives investors solid evidence that Amazon’s prior cost-cutting initiatives have produced tangible results:
Amazon: Q2 2024 Earnings Figures (Amazon: Q2 2024 Earnings Presentation)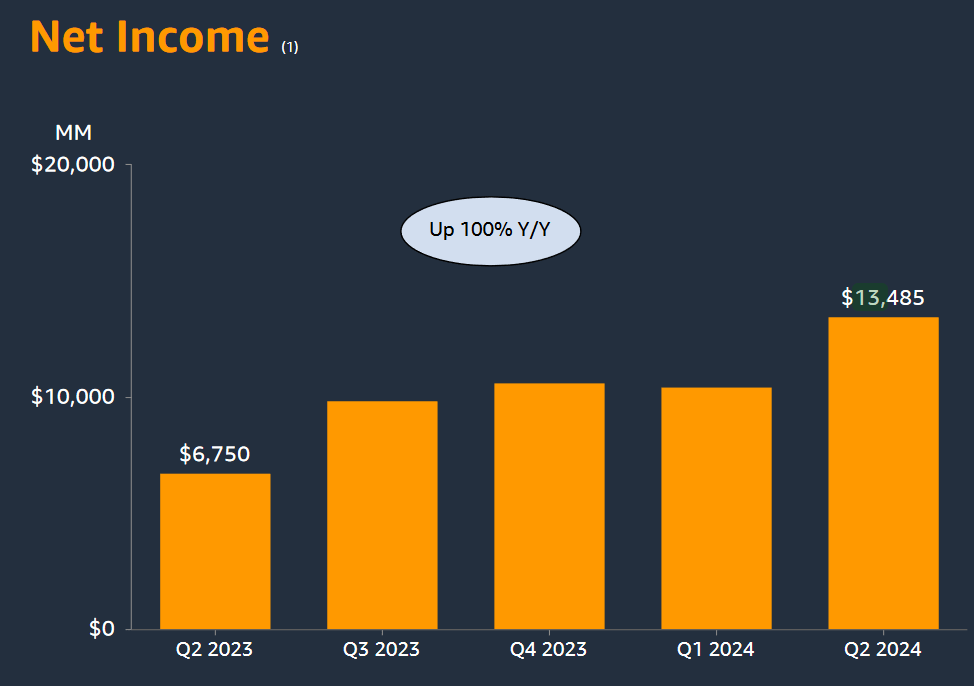
As an analyst that typically covers technology stocks, one of the segments that I will often watch most closely in Amazon’s earnings releases is the AWS (Amazon Web Services) segment. For the period, AWS revenues posted at $26.3 billion (which was a slight beat relative to the consensus estimates of $26 billion). Fortunately, these figures indicate annualized growth rates of 19%. However, what these calculations miss is the fact that both Alphabet, Inc. (GOOG) (GOOGL) and Microsoft Corp. (MSFT) posted cloud-based annualized growth rates of nearly 30% during the same quarterly period this year (see here for Microsoft, and see here for Google). To be fair, it should also be noted that similar reporting segments from Google and Microsoft account for additional performance metrics that go beyond cloud-based infrastructure. But this relative weakness is likely to be one aspect that catches the attention of Amazon investors as we head into the company’s next earnings report on October 25.
Amazon: Q2 2024 Earnings Figures (Amazon: Q2 2024 Earnings Presentation)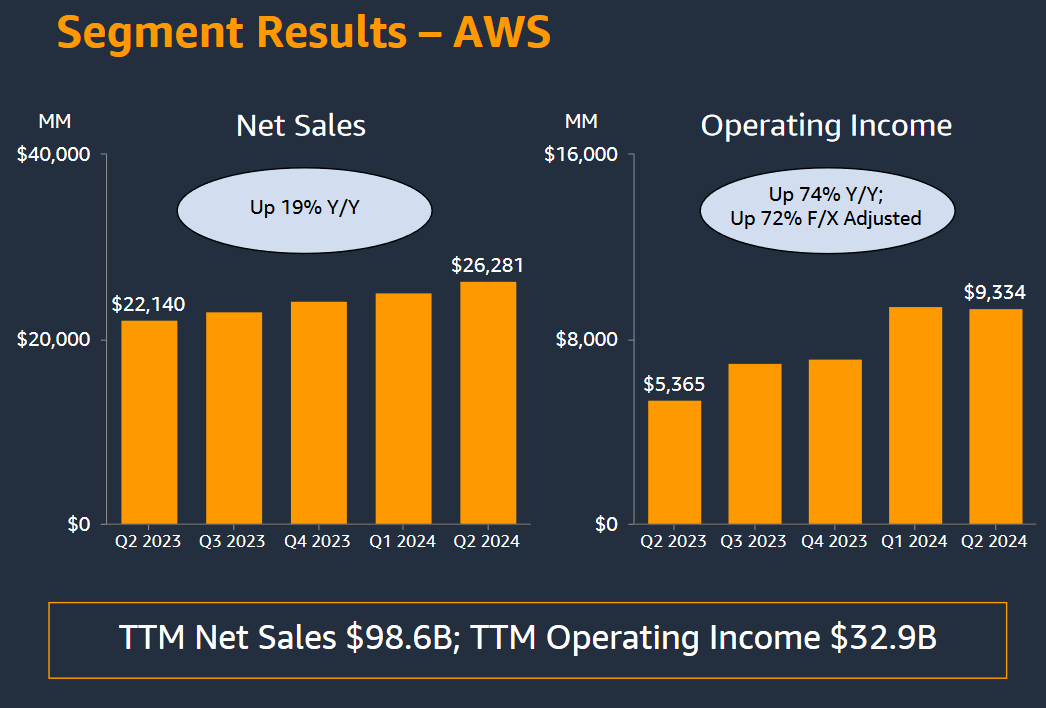
Looking ahead, Amazon’s guidance figures suggest that operating income for the third quarter period will be seen within a relatively wide $11.5-15 billion range). At the midpoint, this would give an operating income figure of $13.25 (which would fall far short of the consensus estimates of $15.3 billion). However, if Amazon does achieve the middle of this guidance range, this would actually indicate annualized growth rates of more than 18.3% for the period. For these reasons, I think the stock has a good chance of moving higher in the event that these initial guidance performances are met.
Amazon: Q2 2024 Earnings Figures (Amazon: Q2 2024 Earnings Presentation)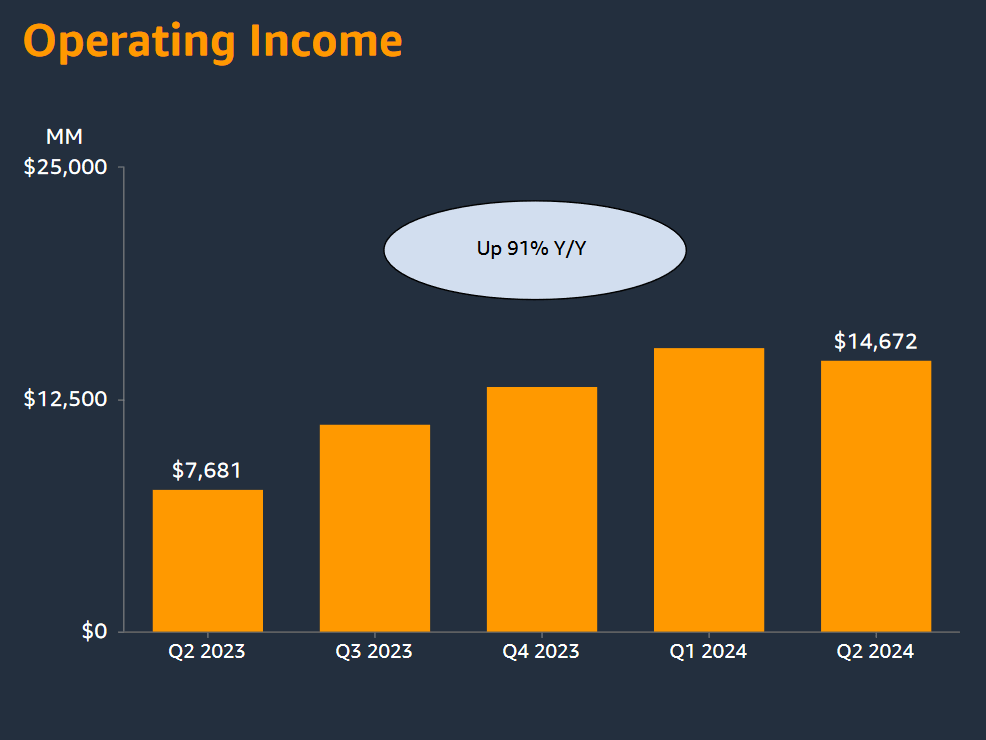
Last, we will take a look at Amazon’s advertising revenue, which came in slightly below the consensus expectations of $13 billion (at $12.8 billion). For this segment, annualized growth rates were fairly substantial (at roughly 20%) and we can now see that this part of the business is really starting to shine with earnings power. Unfortunately, the majority of this revenue figure is derived from sponsored advertising listings connected to items sold on Amazon.com, but we are starting to see additional innovation from the company as it relates to this specific segment, and we are starting to see progress from Amazon in terms overall advertising market share.
For these last figures, Meta Platforms (META) should be added to the list as one of Amazon’s key competitors in the space because Meta’s annualized advertising revenue growth for this period still outperformed at 22%. Interestingly, Alphabet’s annualized revenue growth for this segment was actually weaker (at just 11%), so this suggests that potential AMZN investors should be watching for continued performance strength from this segment because further earnings surprises could ignite a market conversation in which Amazon is more widely considered to be a dominant force in the advertising realm (rather than just a secondary name before more substantial alternatives like Alphabet and Meta Platforms).
AMZN: Comparative Price to Earnings Valuations (YCharts)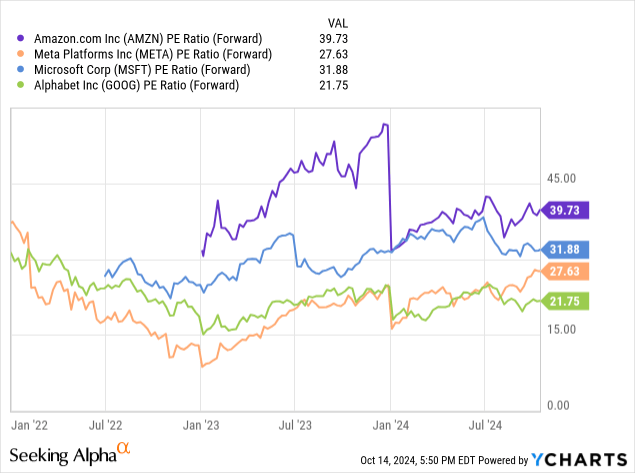
From the perspective of the forward price-earnings valuation, AMZN shares are actually looking a bit expensive at the moment. Specifically, Amazon’s forward PE ratio of 39.73x is much higher than Microsoft (at 31.88x), Meta Platforms (at 27.63x), and Alphabet is currently the cheapest within this MAG-7 subset (with a 21.75x forward valuation). Interestingly, all four of these stocks did see a significant drop-off during the early parts of this year (when using this valuation metric). However, the broad trends have remained largely the same, with AMZN being the most expensive stock within this grouping.
AMZN: Comparative Price to Sales Valuations (YCharts)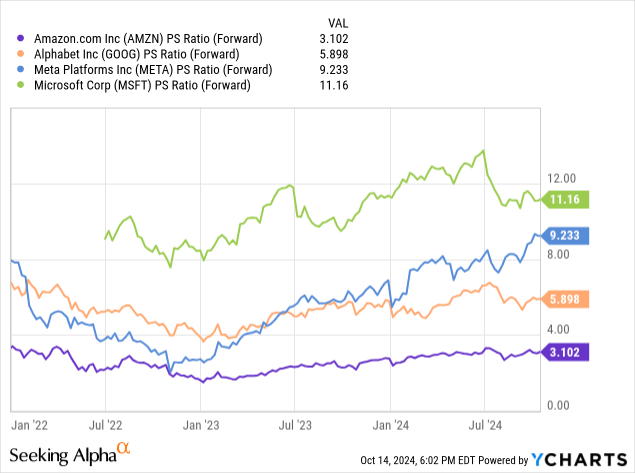
However, when we look at the comparative valuations of each of these companies using the forward price-sales ratio, a completely different picture starts to emerge. In this case, Microsoft is actually the most expensive stock in the group (at 11.16x), followed by Meta Platforms (at 9.23x). Finally, Alphabet is still trading at levels that are slightly more elevated (just below 5.9x) but AMZN is looking like the most attractive option (trading with a forward price-sales valuation of just 3.1x).
Recent rallies in share prices have sent AMZN from the August 5th, 2024 lows of $161.02 to near-term highs of $195.37. For the most part, I think these two price levels should be viewed as being the formation of a dominant trading range, but share prices are currently trading near the upper-end of this critical chart pattern. One factor that should be noted here is that AMZN tends to have a tremendous amount of difficulty holding on to support zones above the $190 level, and most of the recent bullish ventures above this important price region have been relatively short-lived. Of course, we have seen the stock briefly overcome the psychological handle at $200 (with the July 8th, 2024 price highs of $201.20).
AMZN: Key Share Price Levels (Income Generator via TradingView)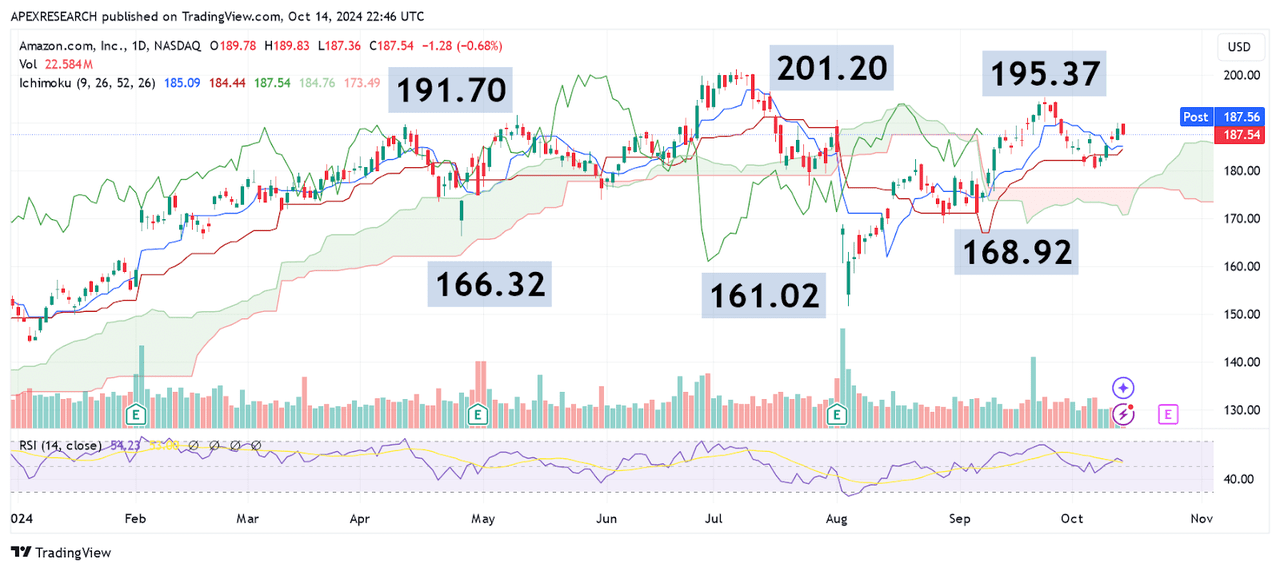
But the stock was only able to trade in this area for about nine days before falling through short-term support levels on July 11th 2024 and this price failure was ultimately led to the declines into the low $160s less than one month later. For me, the real question is whether or not this paradigm has shifted enough to allow the stock to at least maintain a sustained foothold above the $190 level. Strengthening this potentially bullish stance is the fact that share prices have continued to form higher lows since the August 5th trading session, and I plan to maintain this bullish outlook unless I see the stock break through historical support levels located at $168.92 (session lows from August 28th, 2024).
AMZN: Protective Stop-Loss Trade Management (Income Generator via TradingView)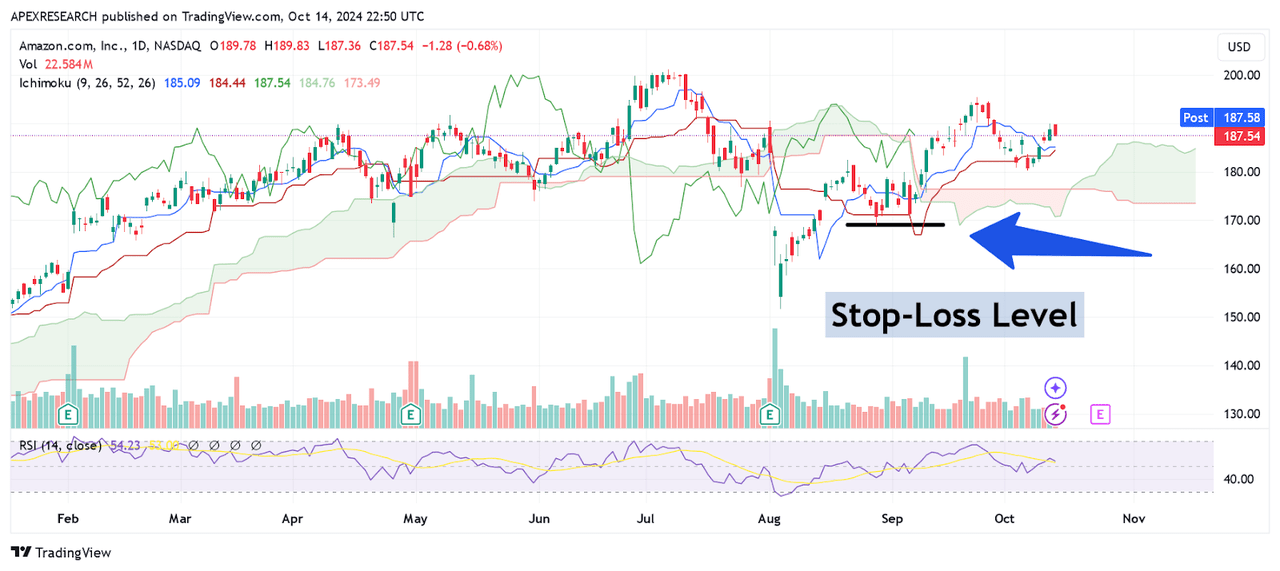
If this bearish event does not occur, I think the most probable outcome for this stock will be another move toward all-time highs (above $201.20) with a new support zone formed above $191.70 (which would be a resistance turned support level based on the stock’s May 9th, 2024 highs). As a result, I have placed my stop-loss for this long position at $168.75 and will likely reviser lower my bullish rating in the event that this negative threshold is surpassed.
Analyst’s Disclosure: I/we have a beneficial long position in the shares of AMZN either through stock ownership, options, or other derivatives. I wrote this article myself, and it expresses my own opinions. I am not receiving compensation for it (other than from Seeking Alpha). I have no business relationship with any company whose stock is mentioned in this article.
Seeking Alpha’s Disclosure: Past performance is no guarantee of future results. No recommendation or advice is being given as to whether any investment is suitable for a particular investor. Any views or opinions expressed above may not reflect those of Seeking Alpha as a whole. Seeking Alpha is not a licensed securities dealer, broker or US investment adviser or investment bank. Our analysts are third party authors that include both professional investors and individual investors who may not be licensed or certified by any institute or regulatory body.
