Summary:
- AAPL has surged 34% since April, outperforming the broader market and showing bullish momentum.
- In Q3 2024, services revenue rose to 28.23% of total sales, up from 25.93% YoY.
- Apple’s installed user base reached 1.56 billion in 2024, growing ~6.85% YoY, driving services revenue growth.
- Q4 2024 revenue is estimated at $94.23 billion, following a Q3 beat by $1.40 billion.
- iPhone sales dropped to 45.81% of total sales in Q3 2024, down from 48.50% in Q3 2023.
AleksandarNakic
Investment Thesis
Apple (NASDAQ:AAPL) has surged 34% since our April “Buy” rating, outperforming the broader market. Since our last coverage in August, AAPL’s performance has been relatively muted, with a slight increase of just 2%. Bullish momentum remains strong, with solid volume and technical support indicating further short-term upside, supporting our cautious buy rating with an underweight position.
Fundamentally, Apple’s expanding services segment and deepening ecosystem, lock-in drive higher-margin, recurring revenues, positioning the company for sustained long-term growth. However, risks remain with the declining share of iPhone revenue, market saturation, and longer upgrade cycles, which could dampen overall top-line growth despite solid performance in other areas.
Apple’s Bullish Surge: VPT Signals Upside to $250 and Beyond
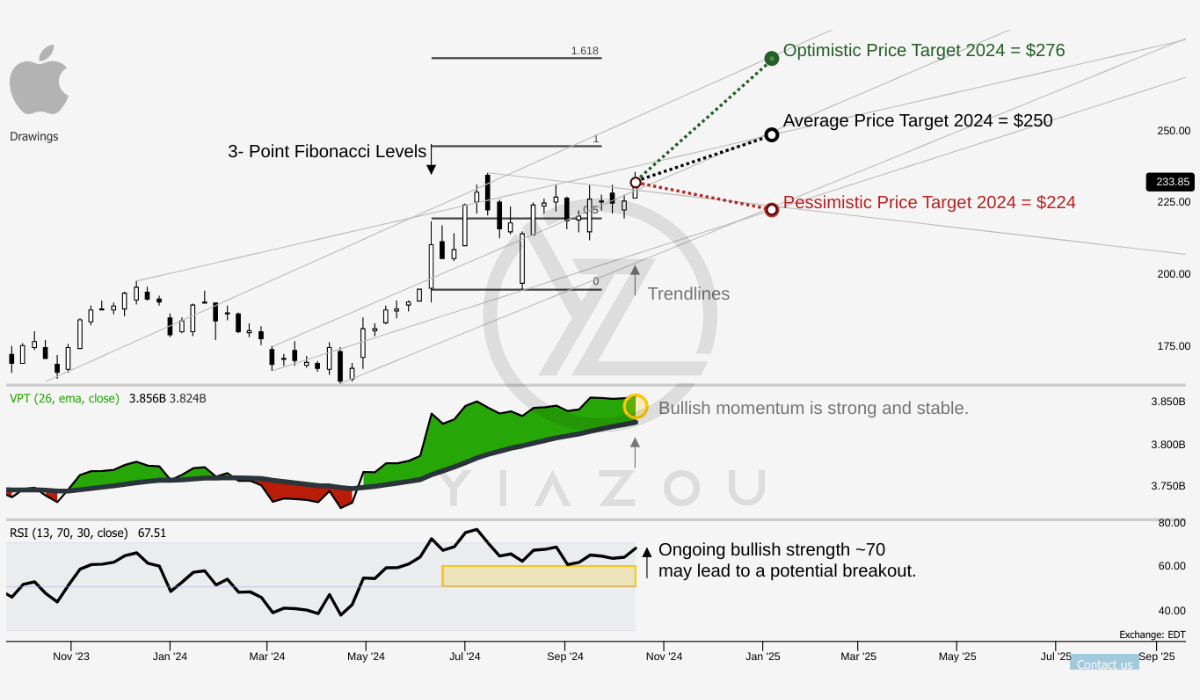
AAPL is experiencing solid bullish momentum regarding the volume price trend (VPT). The VPT at 3.858 billion is over the annual moving average of 3.824 billion, suggesting a prolonged bullish sentiment for AAPL in the street. Considering the RSI, it is taking constant support over 60, suggesting that the stock holds short-term upside potential even near overbought levels.
Following the mid-term trends and 3-point Fibonacci levels, Apple stock may hit an average of $250 by the end of 2024 (at 1.0 Fibonacci level). Optimistically, the stock may reach $276 by the year’s end, which aligns with the 1.618 Fibonacci level. Pessimistically, the stock may end up ~$224 to hit the 0.5 Fibonacci level.
Yiazou (trendspider.com)
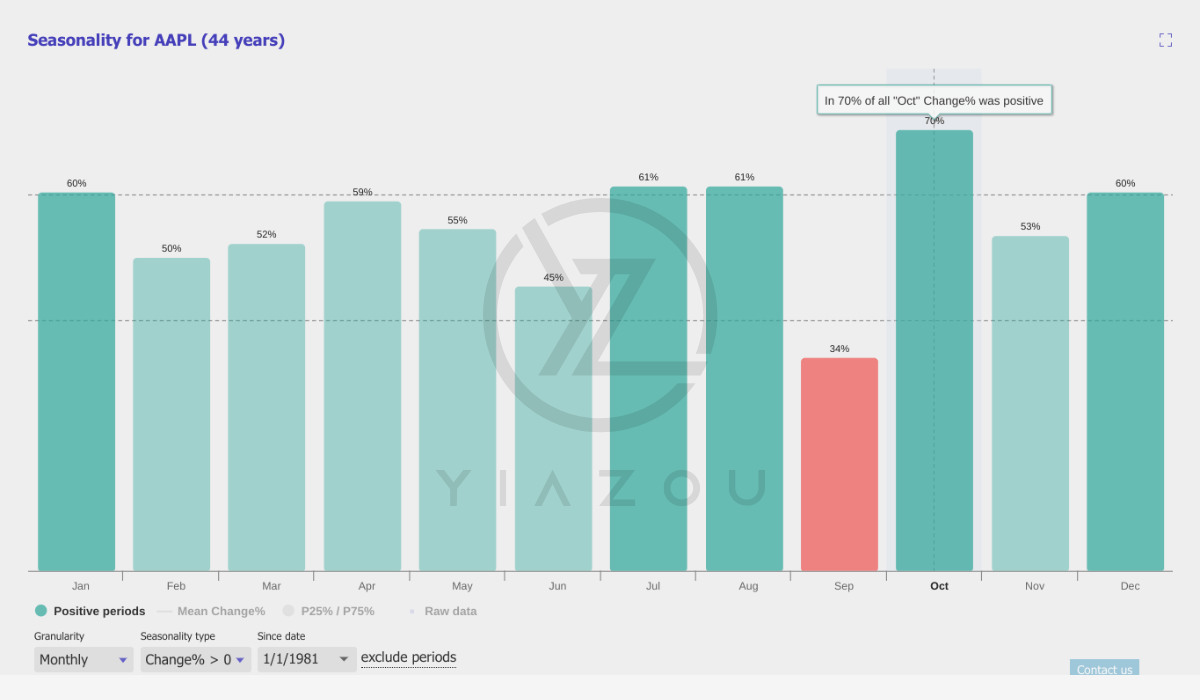
Finally, based on 44 years of monthly seasonality, the stock has a 70% probability of delivering a positive return. This points to a historical upside potential integrated into the stock prices.
Yiazou (trendspider.com)
Solid Services Segment Growth and Prolonged Ecosystem Lock-in
Apple has delivered and holds a fundamental capacity for business growth through its market presence, growing customer base, and high levels of customer satisfaction. As an emerging core fundamental growth element, the services segment of Apple had high growth in Q3 and 9M of fiscal 2024 against the same periods in 2023.
This growth is attributed primarily to increased net sales from advertising, the App Store, and cloud services. Services revenue as a percentage of total net sales has grown, increasing recurring revenue streams as part of Apple’s total revenue composition. Specifically, in Q3 2024, services revenue marked 28.23% of total net sales, up from 25.93% in Q3 2023. For 9M of 2024, services revenue led 24.04% to total net sales, against 21.41% in 9M 2023.

Apple’s 10Q
Moreover, this rising proportion of services revenue is vital because it suggests a shift in Apple’s business model towards higher-margin, recurring revenues. Such growth in the services may maintain its profitability and cash flow stability to balance the fluctuations in hardware sales. Year-over-year (YoY) growth in services revenue for Q3 2024 stands at 14.14% over 13.22% in Q3 2023. This acceleration in growth points to a robust demand for Apple’s ecosystem based on customer engagement across its installed base of devices. Developed and emerging markets support the record-setting services revenue of $24.2 billion in Q3 2024.
Apple’s ecosystem growth may continue with its expanding installed base across all product categories and geographic segments. This ecosystem lock-in effect (customers remain within Apple’s ecosystem due to the interdependence of hardware and services) enhances Apple’s ability to monetize its user base through service revenue growth.
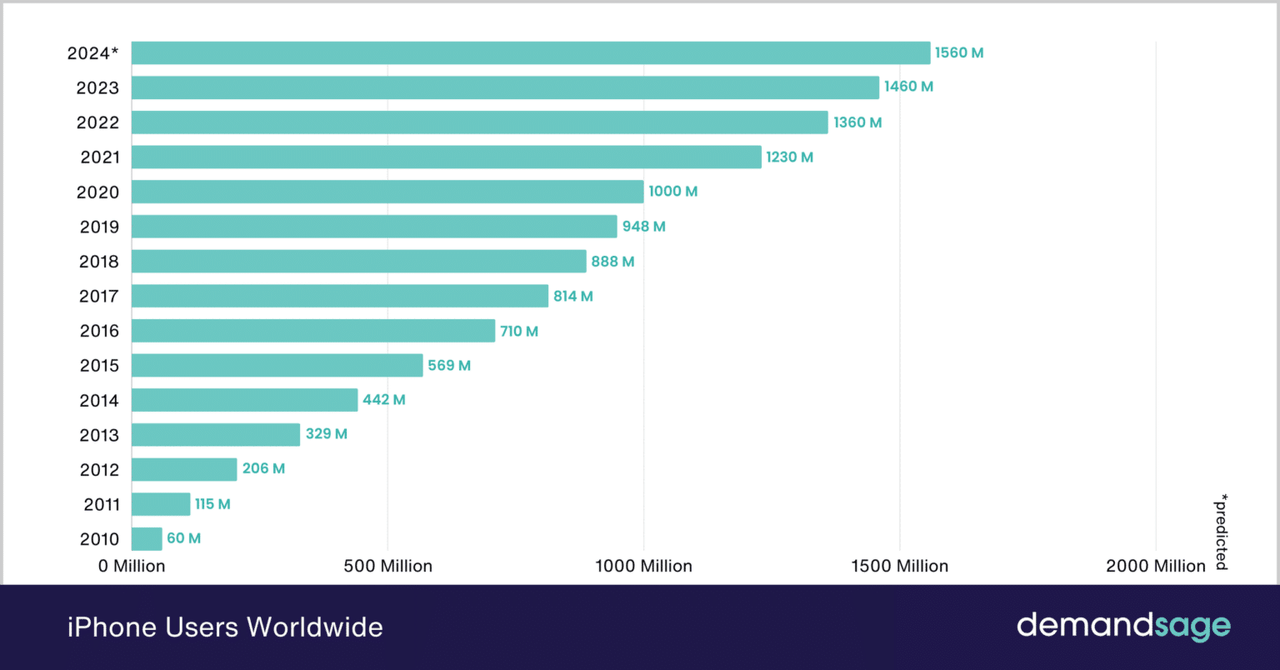
Further, the iPhone still holds a dominance in the global smartphone industry. As of 2024, the iPhone holds a 27.73% market share in the industry, which provides Apple with a massive platform for growth through additional device sales and cross-selling services. Similarly, the number of iPhone users has grown substantially over the years. There are (estimated) 1.56 billion users in 2024 and over 1.46 billion in 2023, marking an increase of ~6.85% YoY. This steady increase points to a stable demand and high customer retention rates, providing a solid base for long-term service revenue growth.
DemandSage
In Q3, the growing iPhone installed base was strengthened by geographic expansion with record sales in countries like the UK, Spain, Poland, Mexico, Indonesia, and the Philippines. This reach highlights Apple’s capability to penetrate both developed and emerging markets. The high levels of customer satisfaction, with 98% for iPhone users in the US, may support Apple’s low churn rate and reinforce customer loyalty. This satisfaction ensures that existing users are more likely to upgrade within the Apple ecosystem, deriving more in recurring sales.
Moreover, Apple’s services segment is growing its profitability with a gross margin of 74% in Q3 against 70.5% in Q3 2023. This improvement in the bottom line and Apple’s ability to scale its services business without a commensurate rise in costs. Over 9M of 2024, the services gross margin stood at 73.8%, over 70.8% in 9M 2023. The improvement in service profitability reflects Apple’s capability to capitalize on its vast user base with high-margin digital services.
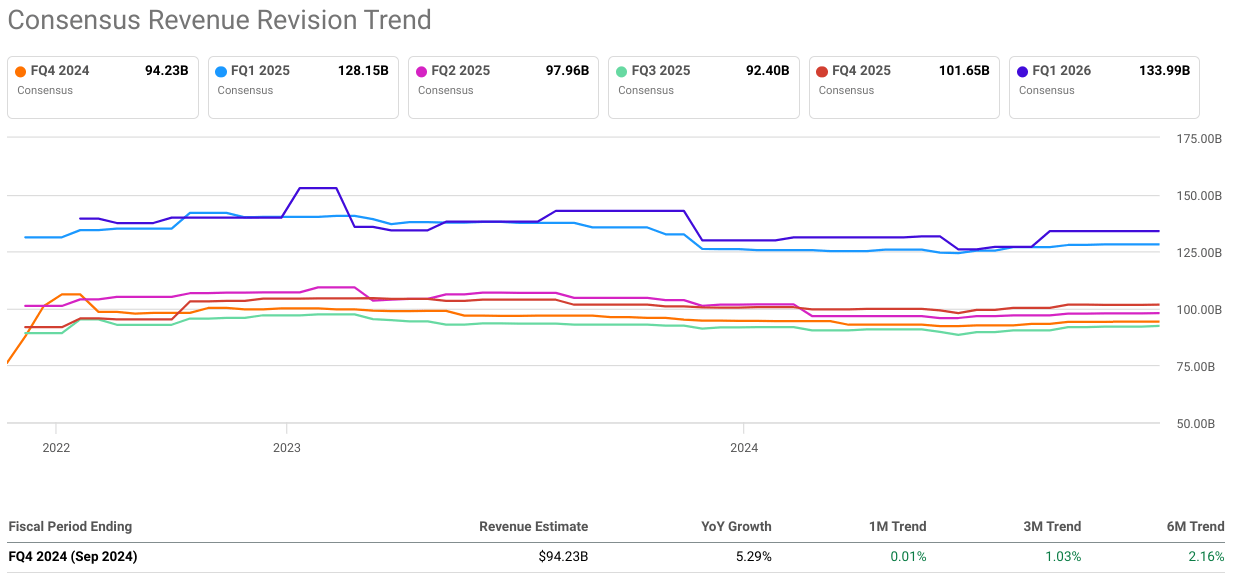
Looking forward, Apple’s strong earnings and revenue performance may persist with the progress of the service segment. In Q3, Apple derived $85.78 billion in total revenue, surpassing market expectations by $1.4 billion. This revenue beat may repeat in the upcoming Q4 2024 report, considering the top-line trend in the service segment. As per consensus estimates, Q4 revenue may hit $94.23 billion (with 21 upward revisions for revenue and three downward revisions over the last three months), signaling continued strong performance as the year progresses.
seekingalpha.com
Dependence on iPhone Sales and Slowing Revenue Contribution
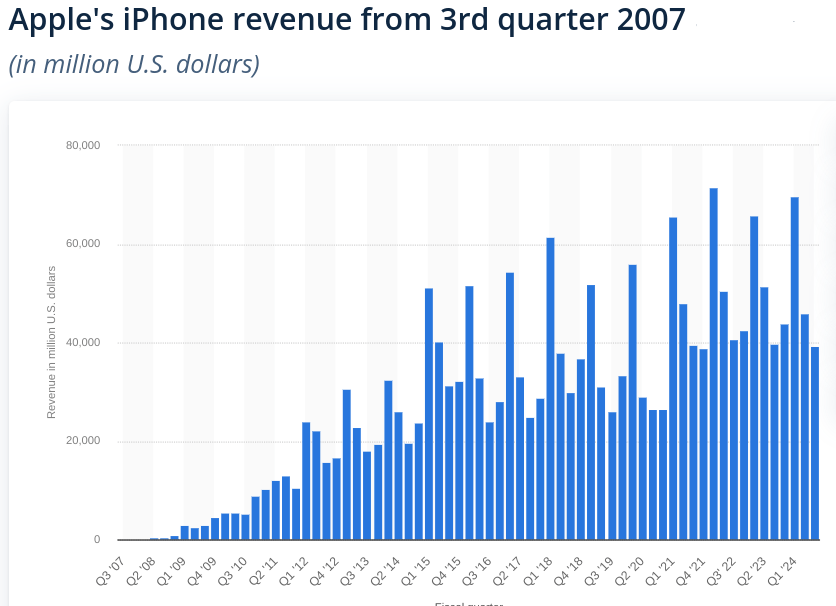
Apple’s heavy reliance on iPhone sales is becoming a downside for its consolidated top-line growth. The share of iPhone revenue as a percentage of total net sales has been declining over the past few years. For Q3 fiscal 2024, iPhone revenue constituted 45.81% of total net sales, down from 48.50% in Q3 2023. For 9M 2024, iPhone sales contributed 52.33% of total net sales, which declined from 53.36% in 9M 2023.
The proportion is concerning. Why? It signals Apple’s major reliance on the iPhone to derive top-line growth. While the company has tried to diversify its product portfolio, the iPhone remains a core product, and its shrinking contribution to total sales indicates a potential ceiling on product-based growth.
Finally, a YoY decline in iPhone revenue of 0.94% for Q3 and 1.16% for 9M highlights the weakening trajectory of this core product. Apple relied on iPhone upgrades and sales cycles to drive revenue. This reduction in its contribution could stifle top-line growth while competitors intensify their efforts in the smartphone market.
statista.com
In short, AAPL may face downside pressure in the upcoming quarter as iPhone revenue is declining as a proportion of total sales with a faltering YoY growth. This drop is emerging from the saturation of smartphone markets, the lengthening of replacement cycles, and increased competition. Overall, the shrinking revenue across multiple quarters, despite the positive bump in 2024, suggests that overall consumer demand for Apple’s products may be slowing down.
Takeaway
Strong volume trends and solid technical support suggest a short-term upside, with potential targets of $250-$276 by year-end. Apple’s services segment continues to grow, driving higher-margin, recurring revenue and bolstering long-term prospects. However, declining iPhone sales and market saturation pose risks to top-line growth, making diversification and sustained service performance crucial.
Analyst’s Disclosure: I/we have no stock, option or similar derivative position in any of the companies mentioned, and no plans to initiate any such positions within the next 72 hours. I wrote this article myself, and it expresses my own opinions. I am not receiving compensation for it (other than from Seeking Alpha). I have no business relationship with any company whose stock is mentioned in this article.
Seeking Alpha’s Disclosure: Past performance is no guarantee of future results. No recommendation or advice is being given as to whether any investment is suitable for a particular investor. Any views or opinions expressed above may not reflect those of Seeking Alpha as a whole. Seeking Alpha is not a licensed securities dealer, broker or US investment adviser or investment bank. Our analysts are third party authors that include both professional investors and individual investors who may not be licensed or certified by any institute or regulatory body.
