
Summary:
- Goldman Sachs outperforms Morgan Stanley in investment banking and asset management segments, driven by higher investment banking fees, revenue growth, and assets under management, despite Morgan Stanley’s better financial ratios.
- However, Morgan Stanley has stronger fundamentals, better profitability (higher ROA and NIM), lower volatility, and stronger capital resilience.
- Morgan Stanley also maintains better asset quality and risk management with a higher credit rating and bond seniority ranking than Goldman Sachs.
- While both companies offer strong fixed-income securities with above-average yield-to-credit rating ratios, Morgan Stanley is favored for fixed-income investors, but Goldman Sachs remains a solid investment due to its strengths in investment banking and asset management.
CHUNYIP WONG
In our previous analysis, we analyzed the stocks of The Goldman Sachs Group, Inc. (NYSE:GS), and Morgan Stanley (NYSE:MS) and concluded that Goldman Sachs outperforms Morgan Stanley in the investment banking segment, driven by its higher investment banking fees, brokerage revenue growth, and larger market share. In the asset management segment, Goldman Sachs surpasses Morgan Stanley with higher revenue growth and larger assets under management. However, when comparing financial ratios, Morgan Stanley demonstrates superior capital ratios and profitability. Taking all factors into account, despite Morgan Stanley’s stronger financial metrics, we believed Goldman Sachs to be the superior company overall due to its dominance in investment banking, asset management and valuation.
In this analysis, we compare these companies’ fixed income securities to determine which company is better for fixed income investors. Both of these companies are highly similar, with their business models mainly encompassing investment banking and asset management, and are the top companies in these markets by market share. Firstly, we compare the two companies in terms of their fundamentals, based on the company’s segment performance and profitability focusing on their stability. Moreover, we compare the companies to determine which company has a stronger financial position based on key financial ratios. Finally, we compare the companies in terms of their fixed income securities ratings and coupon rates.
Fundamental Comparison
In the first section, we compare Morgan Stanley and Goldman Sachs to determine which company has better fundamentals for fixed income investors. Both companies are highly similar, with their businesses mainly focusing on investment banking and asset management.
Company Data, Khaveen Investments Company Data, Khaveen Investments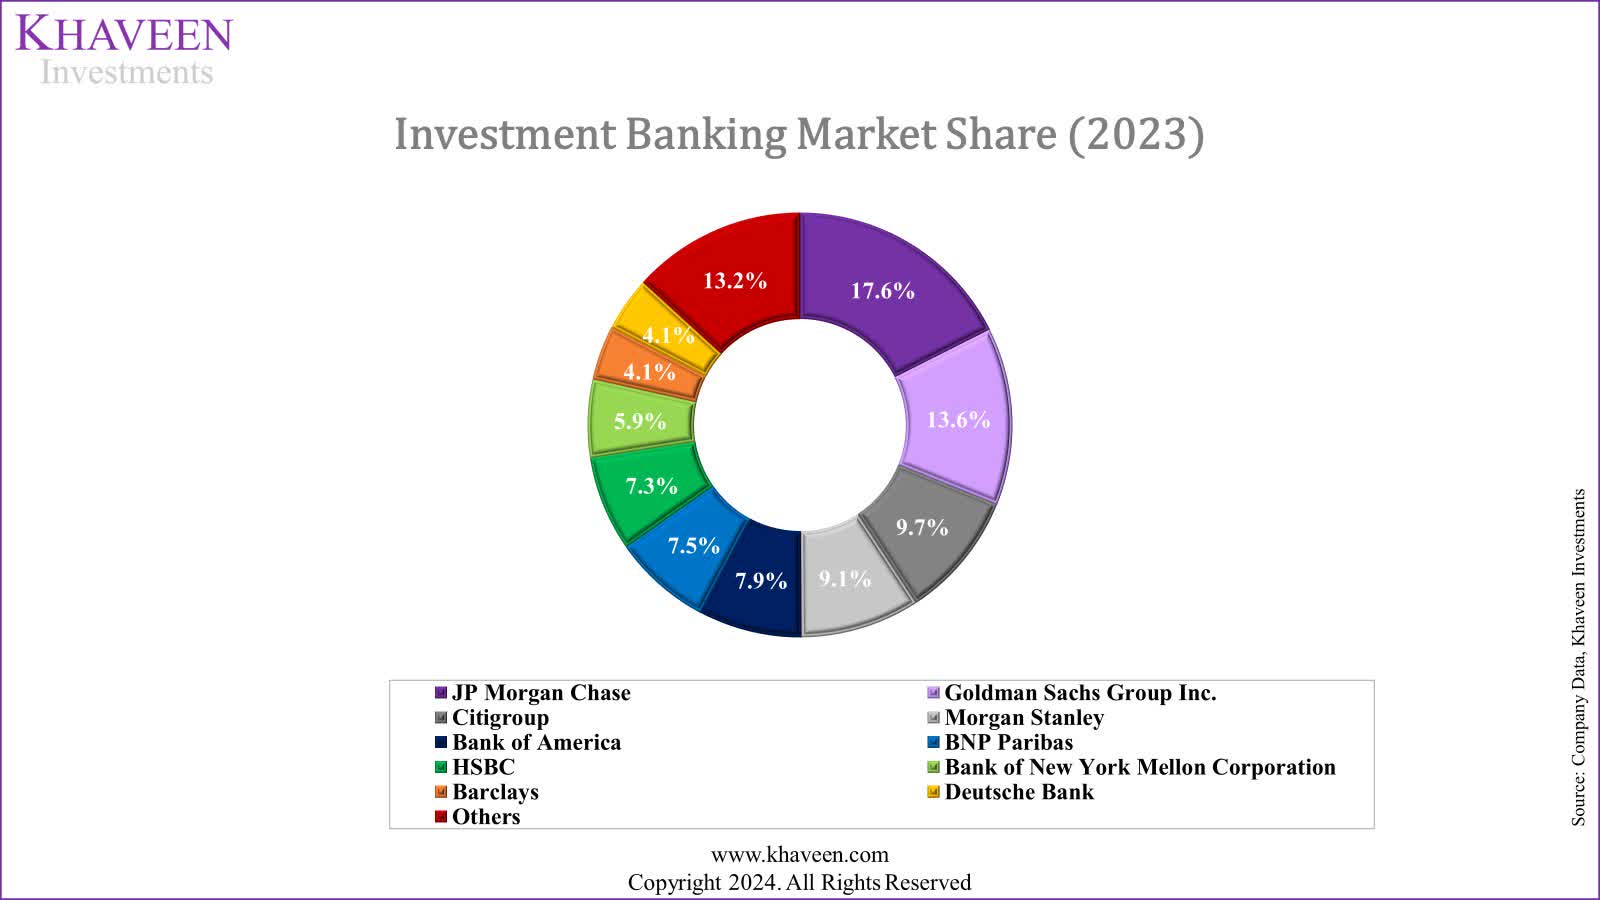
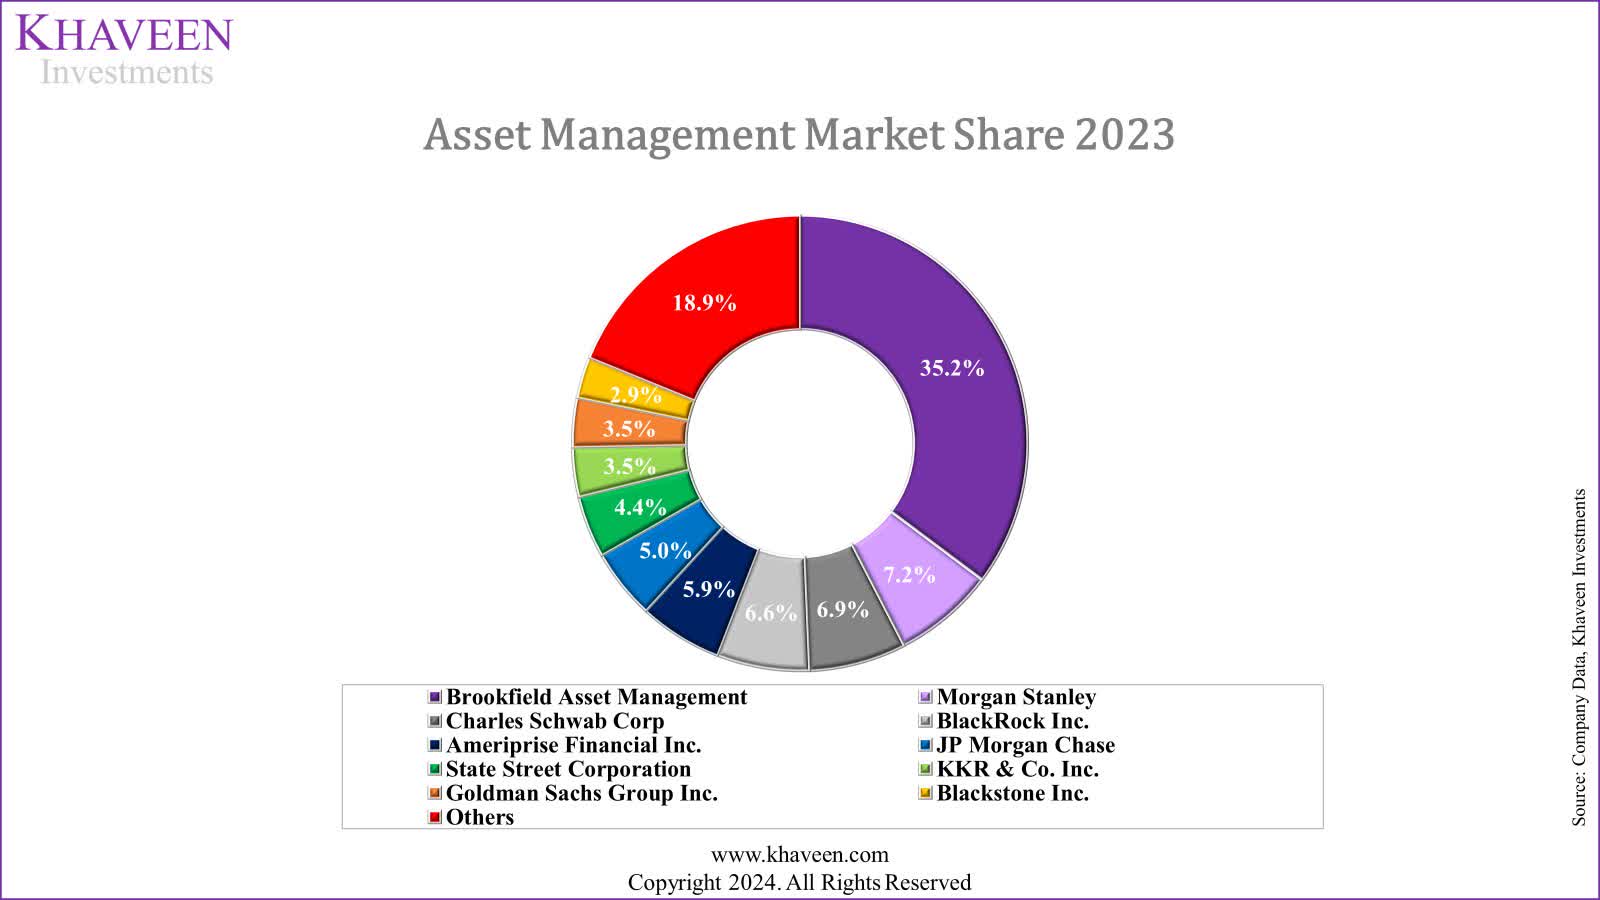
As highlighted in our previous analysis, both companies have a strong market position, MS and GS are among the top companies by market share in IB and asset management and are well established in these markets. Thus, our focus on comparison to determine which is more suitable for fixed income investors focuses more on stability and growth track record.
Revenue Growth Track Record and Stability
We updated the revenue breakdown between Asset Management and Investment Banking from our previous analysis below to include 2023.
|
Revenue by Segment ($ mln) |
2014 |
2015 |
2016 |
2017 |
2018 |
2019 |
2020 |
2021 |
2022 |
2023 |
Average |
Standard Deviation |
|
GS Total IB Revenue |
24,733 |
24,888 |
22,796 |
23,931 |
26,259 |
25,995 |
32,886 |
44,810 |
30,682 |
30,371 |
||
|
Growth % YoY |
0.6% |
-8.4% |
5.0% |
9.7% |
-1.0% |
26.5% |
36.3% |
-31.5% |
-1.0% |
4.0% |
19.6% |
|
|
GS Asset Management Revenue |
5,748 |
5,868 |
5,407 |
5,867 |
6,590 |
6,189 |
6,923 |
8,059 |
9,005 |
9,532 |
||
|
Growth % YoY |
2.1% |
-7.9% |
8.5% |
12.3% |
-6.1% |
11.9% |
16.4% |
11.7% |
5.9% |
6.1% |
8.5% |
|
|
MS Total IB Revenue |
20,038 |
20,262 |
19,251 |
21,180 |
22,223 |
21,356 |
26,508 |
29,325 |
24,465 |
24,748 |
||
|
Growth % YoY |
1.1% |
-5.0% |
10.0% |
4.9% |
-3.9% |
24.1% |
10.6% |
-16.6% |
1.2% |
2.9% |
11.5% |
|
|
MS Asset Management Revenue |
10,570 |
10,766 |
10,697 |
11,797 |
12,898 |
13,083 |
14,272 |
19,967 |
19,578 |
19,617 |
||
|
Growth % YoY |
1.9% |
-0.6% |
10.3% |
9.3% |
1.4% |
9.1% |
39.9% |
-1.9% |
0.2% |
7.7% |
12.9% |
Source: Company Data, Khaveen Investments
Both companies have shown a positive growth track record over the years. In Investment Banking, the growth trend between Goldman Sachs and Morgan Stanley is fairly similar. When GS’s IB revenues declined, so did MS, except in 2023, where MS posted slightly better growth at 1.2% compared to GS’s -1%. However, GS experienced a much larger revenue decline in 2022 (-31.5%) compared to MS’s decline of 16.6% in the same year. In 2016, GS revenues fell by 8.4%, while MS’s drop was more moderate at 5%. The only year where MS underperformed GS was in 2019 when MS’s revenues fell by 3.9% compared to GS’s 1% decline. Despite GS having a higher average growth rate, MS is more stable, with smaller declines during downturns. Furthermore, GS Total IB Revenue has a higher standard deviation (19.6%) compared to MS Total IB Revenue (11.5%). Additionally, GS IB’s revenue growth is more unstable than MS’s due to a higher standard deviation, whereas GS AM’s revenue growth is more stable due to a lower standard deviation.
In terms of Asset Management, the trend is also similar. GS’s revenues declined more than MS in 2016 and 2019, but in 2022, MS saw a slight decline of 1.9%, whereas GS experienced strong growth. MS’s Asset Management segment has a higher average growth rate than GS. GS Asset Management Revenue has a lower standard deviation (8.5%) compared to MS Asset Management Revenue (12.9%), but this could be due to the surge in 2021 due to MS’ acquisition of Eaton Vance. More importantly, the average decline of GS IB is larger than MS IB, at -10.5% and -8.5% respectively, whereas the average decline of GS AM is larger than MS AM, at -7.0% and -1.3% respectively.
Trading – Investment Banking Comparison
|
Trading Revenue ($ mln) |
2014 |
2015 |
2016 |
2017 |
2018 |
2019 |
2020 |
2021 |
2022 |
2023 |
Average |
Standard Deviation |
|
GS Trading |
14,953 |
14,541 |
13,315 |
13,804 |
15,630 |
16,209 |
20,197 |
27,023 |
19,288 |
20,364 |
||
|
Growth % YoY |
-2.8% |
-8.4% |
3.7% |
13.2% |
3.7% |
24.6% |
33.8% |
-28.6% |
5.6% |
5.0% |
18.2% |
|
|
MS Trading |
9,377 |
10,114 |
10,209 |
11,116 |
11,551 |
11,274 |
13,983 |
12,810 |
13,928 |
15,263 |
||
|
Growth % YoY |
7.9% |
0.9% |
8.9% |
3.9% |
-2.4% |
24.0% |
-8.4% |
8.7% |
9.6% |
5.9% |
9.1% |
Source: Company Data, Khaveen Investments
Trading is the largest revenue contributor to both companies’ Investment Banking revenues. Both companies’ average growth track record is overall positive with a similar average of 5% for GS and 5.9% for MS. However, GS’s trading revenue shows relatively more fluctuations with large growth swings, such as 33.8% in 2021 followed by a steep decline of -28.6% in 2022. In contrast, MS’s trading revenue fluctuates less dramatically, with the largest decline being -8.4% in 2021 and a recovery of 8.7% in 2022. MS’s average growth rate (5.9%) is higher than GS’s (5.0%) and MS has smaller declines and more moderate growth periods, making it more stable. Moreover, GS has a higher standard deviation in its trading revenue at 18.2%, compared to MS’s standard deviation of 9.1%. Thus, we believe Morgan Stanley appears to be more stable than Goldman Sachs in terms of trading revenue growth.
Investment Banking Fees – Investment Banking Comparison
|
Total Investment Banking Fee Revenue ($ mln) |
2014 |
2015 |
2016 |
2017 |
2018 |
2019 |
2020 |
2021 |
2022 |
2023 |
Average |
Standard Deviation |
|
GS Investment Banking Fees |
6,464 |
7,027 |
6,273 |
7,076 |
7,430 |
6,798 |
9,141 |
14,168 |
7,360 |
6,218 |
||
|
Growth % YoY |
8.7% |
-10.7% |
12.8% |
5.0% |
-8.5% |
34.5% |
55.0% |
-48.1% |
-15.5% |
3.7% |
29.8% |
|
|
MS Investment Banking Fees |
5,948 |
5,594 |
4,933 |
6,003 |
6,482 |
6,163 |
7,674 |
10,994 |
5,599 |
4,948 |
||
|
Growth % YoY |
-6.0% |
-11.8% |
21.7% |
8.0% |
-4.9% |
24.5% |
43.3% |
-49.1% |
-11.6% |
1.6% |
26.8% |
Source: Company Data, Khaveen Investments
Investment banking fees are another key contributor to IB revenues, but they are highly volatile. Both GS and MS saw lower investment banking fee revenues in 2023 compared to 2014. Their revenues generally declined in the same years, except in 2015 when GS experienced positive growth while MS saw a decline. Additionally, except for 2022, MS’s fee revenue declines were only slightly (around 1%) lower than GS’s. Also, GS has a standard deviation of 29.8% in its Investment Banking Fee revenue, which is slightly higher than MS’s standard deviation of 26.8%.
Brokerage Revenue – Investment Banking Comparison
|
Brokerage Revenue ($ mln) |
2014 |
2015 |
2016 |
2017 |
2018 |
2019 |
2020 |
2021 |
2022 |
2023 |
Average |
Standard Deviation |
|
GS Brokerage |
3,316 |
3,320 |
3,208 |
3,051 |
3,199 |
2,988 |
3,548 |
3,619 |
4,034 |
3,789 |
||
|
Growth % YoY |
0.1% |
-3.4% |
-4.9% |
4.9% |
-6.6% |
18.7% |
2.0% |
11.5% |
-6.1% |
1.8% |
8.6% |
|
|
MS Brokerage |
4,713 |
4,554 |
4,109 |
4,061 |
4,190 |
3,919 |
4,851 |
5,521 |
4,938 |
4,537 |
||
|
Growth % YoY |
-3.4% |
-9.8% |
-1.2% |
3.2% |
-6.5% |
23.8% |
13.8% |
-10.6% |
-8.1% |
0.1% |
11.7% |
Source: Company Data, Khaveen Investments
The last component of Investment Banking Revenues is Brokerage revenues. GS shows smaller fluctuations in its brokerage revenue. The most significant decline was -6.6% in 2019, but GS also posted growth. The largest decline in 2023 was -6.1%. Overall, GS’s average growth rate is 1.8%, and while there are some negative years. MS saw substantial declines in 2015 (-9.8%) and 2022 (-10.6%). MS’s average growth rate over the period is much lower at 0.1%. GS has a lower standard deviation in its Brokerage Revenue at 8.6% compared to MS’s 11.7%.
AUM – Asset Management
Company Data, Khaveen Investments
In terms of Asset Management, we analyze the company’s AUM. GS has relatively steady growth with fewer periods of decline compared to MS in 2018 and 2022, and an average annual growth of 11.3% compared to MS of 25%. However, this is due to the surge in growth in 2021. In our previous analysis, we highlighted its acquisition of Eaton Vance which contributed greatly to the rise in 2021 with an AUM of $507 bln. Moreover, MS AM revenue % AUM is higher than GS, highlighting that MS is more efficient at generating AM revenue per $ bln of AUM. Notably, both GS and MS AM revenue % AUM has been declining steadily since 2017, likely due to faster relative growth in AUM compared to AM revenue.
Earnings Stability
|
Companies |
ROA (5-year Average) |
ROE (5-year Average) |
NIM (5-year Average) |
ROA (5-year Average) Ranking |
ROE (5-year Average) Ranking |
NIM (5-year Average) Ranking |
Overall Earnings Stability Ranking |
|
JPMorgan (JPM) |
1.16% |
15.40% |
2.9% |
1 |
2 |
2 |
1.7 |
|
Goldman Sachs |
0.96% |
12.32% |
0.8% |
3 |
3 |
10 |
5.3 |
|
Morgan Stanley |
1.06% |
12.06% |
1.1% |
2 |
4 |
8 |
4.7 |
|
Bank of America (BAC) |
0.94% |
10.04% |
2.3% |
4 |
5 |
4 |
4.3 |
|
Citi (C) |
0.70% |
7.82% |
3.0% |
7 |
7 |
1 |
5.0 |
|
UBS (UBS) |
0.88% |
16.78% |
0.9% |
5 |
1 |
9 |
5.0 |
|
Deutsche Bank (DB) |
0.16% |
1.56% |
1.8% |
10 |
10 |
7 |
9.0 |
|
Barclays (BCS) |
0.36% |
5.76% |
1.9% |
9 |
9 |
6 |
8.0 |
|
HSBC (HSBC) |
0.48% |
6.32% |
2.2% |
8 |
8 |
5 |
7.0 |
|
Wells Fargo (WFC) |
0.80% |
8.56% |
2.9% |
6 |
6 |
3 |
5.0 |
|
Average |
0.8% |
9.7% |
2.0% |
Source: Company Data, Khaveen Investments
In our previous analysis of JPM, we compared the top financial firms in terms of their ROA, ROE and NIM.
When comparing GS and MS, both have nearly identical metrics, with both companies showing close averages in ROA, ROE, and NIM, making their overall financial performance highly comparable. However, MS slightly outperforms GS overall. MS has a higher ROA (1.06% vs. 0.96%) and NIM (1.1% vs. 0.8%), ranking 2nd and 8th, respectively, while GS ranks 3rd and 10th. Although GS has a slightly better ROE (12.32% vs. 12.06%), it ranks lower overall in earnings (5.3 vs. MS’s 4.7). Thus, MS shows better profitability than GS.
|
Earning Margins Comparison |
2019 |
2020 |
2021 |
2022 |
2023 |
Average |
Standard Deviation |
|
Goldman Sachs ROA |
0.9% |
0.9% |
1.6% |
0.8% |
0.6% |
1.0% |
0.38% |
|
Goldman Sachs ROE |
10% |
11% |
23% |
10% |
8% |
12.3% |
6.11% |
|
Goldman Sachs NIM |
0.8% |
0.8% |
0.9% |
1.0% |
0.7% |
0.8% |
0.11% |
|
Morgan Stanley ROA |
1.1% |
1.1% |
1.3% |
0.9% |
0.9% |
1.1% |
0.17% |
|
Morgan Stanley ROE |
12% |
13% |
15% |
11% |
9% |
12.1% |
2.18% |
|
Morgan Stanley NIM |
0.9% |
1.1% |
1.2% |
1.3% |
1.2% |
1.1% |
0.14% |
Source: Company Data, Khaveen Investments
Based on the table above, GS’ ROA, ROE, and NIM have remained relatively in line with an average of 1.0%, 12.3%, and 0.8% over the period, respectively. However, all 3 of GS’s earning margins have slightly declined in 2023 compared to 2019. In contrast, MS also experienced a decline in its ROA, dropping from 1.1% in 2019 to 0.9% in 2023, but its NIM improved, increasing from 0.9% to 1.2% during the same period. Moreover, MS ROA and ROE standard deviation are lower than GS, highlighting MS’s higher stability in these ratios. However, MS NIM standard deviation is higher than GS. Additionally, GS and MS’ ROA and ROE spiked during 2021, likely due to higher revenues in Investment Banking and Equities for the year. During 2021, GS Investment Banking revenues spiked 55.0%, due to “elevated” M&A activities “further bolstered by high levels of investable capital from financial sponsors”, as highlighted by GS management. MS also indicated that “IPO issuances were exceptionally robust in the year”, whereby MS Investment Banking rose 43.3% YoY. The increase in M&A and IPO activity is likely because of low interest rates, where PWC noted that in 2021 in the Americas region, “companies looked to take advantage of ripe IPO conditions – high valuations, low-interest rates and strong investor appetite for equity”. Overall, the profitability between GS and MS is highly similar, both companies have decent profitability. However, we believe MS slightly edges out GS with a lesser decline in ROA in 2023 and increasing NIM.
Conclusion
|
Factor |
Winner |
|
Overall Investment Banking |
Morgan Stanley |
|
Overall Asset Management |
Goldman Sachs |
|
Profitability |
Morgan Stanley |
|
Overall |
Morgan Stanley |
Source: Company Data, Khaveen Investments
Overall, in terms of fundamentals, we believe Morgan Stanley edges out Goldman Sachs in terms of revenue growth track record and stability. While both companies exhibit strong performance across their business segments, we find that MS consistently shows a more stable growth pattern with smaller declines during downturns, as evidenced by its lower standard deviations across key revenue segments within Investment Banking revenues. However, we believe Goldman Sachs outperforms Morgan Stanley in Asset Management with more stable growth trends and low volatility with lower standard deviation.
Furthermore, we observe that MS has demonstrated better profitability with higher ROA and NIM, and although GS boasts a slightly better ROE, MS ranks higher in overall earnings. Our analysis of both companies’ profitability metrics also supports this, as MS experienced a lesser decline in ROA in 2023 and showed an increase in NIM. Therefore, we believe Morgan Stanley’s stability provides it with a slight edge over Goldman Sachs.
Based on its previous earnings briefing, MS management highlighted a positive outlook for investment banking as “the investment banking backdrop continues to improve, led by the US, the advisory and underwriting pipelines are healthy across regions and sectors”. Additionally, the company also highlighted its steady growth in its Asset Management business as “year-to-date, net new assets are $131 billion representing 5% annualized growth of beginning period assets”. Additionally, from its latest earnings briefing in Q3, management highlighted that its IB revenue growth in the quarter was “driven by continued strength in underwriting, led by debt underwriting, and further aided by a pickup in advisory revenues”. Meanwhile, GS management in its latest earnings call also highlighted strength in IB as they “see significant pent-up demand” from clients.
Financial Position Comparison
In the next section, we compare both GS and MS in terms of their financial positions and focus on key financial ratios to determine which company is more suitable for fixed income investors.
Capital Adequacy Ratio
|
Companies |
Tier 1 CAR Ratio (5-year) |
Total CAR Ratio (5-year) |
Tier 1 CAR Ratio (2023) |
Total CAR Ratio (2023) |
Min Requirement (Basel III) |
GSIB |
Stress Capital Buffer |
Total Requirement |
Excess |
Tier 1 CAR Ranking (5-year) |
Total CAR Ranking (5-year) |
Overall Capital Adequacy Ranking |
|
JP Morgan |
15.1% |
17.1% |
15.1% |
18.5% |
4.50% |
4.50% |
3.30% |
12.30% |
6.2% |
7 |
7 |
7.0 |
|
Goldman Sachs |
16.0% |
18.5% |
15.9% |
18.1% |
4.50% |
3.50% |
5.50% |
13.50% |
4.6% |
5 |
5 |
5.0 |
|
Morgan Stanley |
17.7% |
20.2% |
17.1% |
19.5% |
4.50% |
3.00% |
5.40% |
12.90% |
6.6% |
3 |
2 |
2.5 |
|
Bank of America |
13.2% |
15.3% |
15.2% |
16.6% |
4.50% |
3.00% |
2.50% |
10.00% |
6.6% |
9 |
10 |
9.5 |
|
Citi |
13.6% |
15.6% |
13.6% |
15.1% |
4.50% |
3.50% |
4.30% |
12.30% |
2.8% |
8 |
8 |
8.0 |
|
UBS |
19.1% |
20.0% |
16.8% |
16.8% |
4.50% |
1.50% |
9.10% |
15.10% |
1.7% |
1 |
3 |
2.0 |
|
Deutsche Bank |
15.5% |
17.9% |
16.1% |
18.6% |
4.50% |
1.50% |
9.30% |
15.30% |
3.3% |
6 |
6 |
6.0 |
|
Barclays |
17.8% |
20.7% |
17.6% |
19.9% |
4.50% |
1.50% |
4.70% |
10.70% |
9.2% |
2 |
1 |
1.5 |
|
HSBC |
17.0% |
19.5% |
17.3% |
20.2% |
4.50% |
2.00% |
6.40% |
12.90% |
7.3% |
4 |
4 |
4.0 |
|
Wells Fargo |
12.8% |
15.5% |
13.0% |
15.7% |
4.50% |
1.50% |
2.90% |
8.90% |
6.8% |
10 |
9 |
9.5 |
|
Average |
15.8% |
18.0% |
15.1% |
18.5% |
4.5% |
2.6% |
5.3% |
12.4% |
5.5% |
Source: Company Data, Khaveen Investments
Based on our previous analysis of JPMorgan, we compiled the top companies in terms of their capital adequacy. Comparing GS and MS specifically, MS has a higher Tier 1 Capital Adequacy Ratio (‘CAR’) both in the 5-year average (17.7% vs. 16.0%) and in 2023 (17.1% vs 15.9%), as well as a stronger Total CAR for the 5-year average (20.2% vs. 18.5%) and in 2023 (19.5% vs. 18.1%). Additionally, MS holds moderately more excess capital (6.6%) than GS (4.6%). Although both banks meet the same minimum requirement of 4.5%, Morgan Stanley’s stronger capital ratios and larger capital buffer lead to a higher overall capital adequacy ranking (2.5) compared to Goldman Sachs (5.0), indicating better capital resilience and adequacy for MS.
|
Capital Adequacy Ratio Comparison |
2019 |
2020 |
2021 |
2022 |
2023 |
Average |
|
Goldman Sachs Tier 1 CAR Ratio |
15.2% |
16.7% |
15.8% |
16.6% |
15.9% |
16.0% |
|
Goldman Sachs Tier 2 CAR Ratio |
2.6% |
2.8% |
2.1% |
2.5% |
2.2% |
2.4% |
|
Goldman Sachs Total CAR Ratio |
17.8% |
19.5% |
17.9% |
19.1% |
18.1% |
18.5% |
|
Morgan Stanley Tier 1 CAR Ratio |
18.6% |
19.4% |
16.0% |
17.2% |
17.1% |
17.7% |
|
Morgan Stanley Tier 2 CAR Ratio |
2.4% |
2.1% |
3.7% |
2.1% |
2.4% |
2.5% |
|
Morgan Stanley Total CAR Ratio |
21.0% |
21.5% |
19.7% |
19.3% |
19.5% |
20.2% |
Source: Company Data, Khaveen Investments
Over the years, GS’s Tier 1 CAR Ratio has shown an improvement from 15.2% in 2019 to 16.6% in 2022, with a slight decline to 15.9% in 2023, leading to an average of 16.0%. On the other hand, MS’s Tier 1 CAR Ratio remains stronger with an average of 17.7% despite the decline during 2021. Both banks have similar Tier 2 CAR Ratios, averaging 2.5%, but Morgan Stanley’s Total CAR Ratio (20.2%) consistently exceeds Goldman Sachs’ (18.5%). Notably, MS shows a higher capital adequacy profile throughout the period, indicating a stronger capital position compared to GS. Additionally, MS Total CAR Ratio is higher than GS, due to MS’s lower Risk-Weighted Assets. Moreover, the Total CAR Ratio is calculated as Total Capital / Risk-Weighted Assets. During 2023, MS’s Risk-Weighted Assets were $456,053 mln and GS’s Risk-Weighted Assets were $692,737 mln, whereas MS’s Total Capital was $88,874mln, and GS’s Total Capital was $125,162 mln. Thus, MS’s Total CAR Ratio was 19.5% in 2023, whereas GS’s was 18.1%.
Asset Quality
|
Companies |
Non-Performing Loans % |
Provision Coverage Ratio (Provisions / Gross NPLs) |
Non-Performing Loans % Ranking |
Provision Coverage Ratio (Provisions / Gross NPLs) Ranking |
Overall Asset Quality Ranking |
|
JP Morgan |
0.67% |
2.23 |
4 |
2 |
3 |
|
Goldman Sachs |
1.26% |
1.74 |
9 |
4 |
6.5 |
|
Morgan Stanley |
0.42% |
0.73 |
1 |
8 |
4.5 |
|
Bank of America |
0.59% |
2.08 |
3 |
3 |
3 |
|
Citi |
0.80% |
2.97 |
6 |
1 |
3.5 |
|
UBS |
0.72% |
1.20 |
5 |
6 |
5.5 |
|
Deutsche Bank |
0.53% |
0.29 |
2 |
9 |
5.5 |
|
Barclays |
2.01% |
0.23 |
10 |
10 |
10 |
|
HSBC |
1.25% |
0.97 |
8 |
7 |
7.5 |
|
Wells Fargo |
0.85% |
1.65 |
7 |
5 |
6 |
|
Average |
0.91% |
1.41 |
Source: Company Data, Khaveen Investments
Furthermore, in comparing the asset quality, Morgan Stanley has a lower percentage of Non-Performing Loans (NPLS) at 0.42%, which is significantly better than Goldman Sachs’ 1.26%. In terms of the Provision Coverage Ratio (provisions/gross NPLs), GS is higher at 1.74 compared to MS’s 0.73. Additionally, in the Non-Performing Loans % Ranking, MS ranks 1st, while GS ranks 9th, further indicating MS’s superior asset quality. For the Provision Coverage Ratio Ranking, GS ranks better at 4th, compared to MS’s 8th place. However, considering the overall Asset Quality Ranking, Morgan Stanley ranks 4.5, indicating better asset quality compared to Goldman Sachs, which ranks lower at 6.5. Thus, Morgan Stanley has stronger overall asset quality due to its better performance in managing non-performing loans.
|
Asset Quality Comparison |
2019 |
2020 |
2021 |
2022 |
2023 |
Average |
|
Goldman Sachs Non-Performing Loans % |
0.38% |
0.86% |
2.34% |
1.14% |
1.57% |
1.26% |
|
Goldman Sachs Provision Coverage Ratio (Provisions / Gross NPLs) |
2.40 |
2.08 |
0.95 |
1.77 |
1.50 |
1.74 |
|
Morgan Stanley Non-Performing Loans % |
0.49% |
0.46% |
0.48% |
0.34% |
0.31% |
0.42% |
|
Morgan Stanley Provision Coverage Ratio (Provisions / Gross NPLs) |
0.39 |
0.65 |
0.71 |
0.78 |
1.14 |
0.73 |
Source: Company Data, Khaveen Investments
GS has experienced a concerning upward trend in its NPL ratio, increasing from 0.38% in 2019 to 1.57% in 2023. This rising trend signals deteriorating asset quality over the period, which is unfavorable. In contrast, MS has maintained a much more stable NPL ratio, starting at 0.49% in 2019 and gradually decreasing to 0.31% by 2023, demonstrating consistent asset quality management. This stability in MS’s NPL ratio indicates a stronger and more controlled approach to managing credit risk compared to GS’s increasing NPL ratio, which reflects worsening asset quality. Moreover, GS has a higher NPL ratio compared to MS because GS has a higher NPL relative to its loans compared to MS. During 2023, GS had total loans of $160,939 mln and NPLs of $2,533 mln, whereas MS had total loans of 206,663 mln and NPLs of $635 mln. Thus, MS had 28% more loans than GS but had 75% fewer NPLs than GS.
Furthermore, in terms of the Provision Coverage Ratio, GS’s ratio has been trending downwards, with a peak ratio of 2.08 in 2019 and the lowest at 0.95 in 2021. Morgan Stanley’s Provision Coverage Ratio started lower at 0.39 in 2019 and gradually increased to 1.14 in 2023. The consistently lower NPL percentage coupled with a gradually increasing provision ratio reflects Morgan Stanley’s more conservative and effective risk management strategy compared to Goldman Sachs.
Liquidity
|
Companies |
Current Ratio (5-year Average) |
Quick Ratio (5-year Average) |
Cash Ratio |
Loan-to-Deposit Ratio |
Liquidity Coverage Ratio (5-year Average) |
Current Ratio (5-year Average) Ranking |
Quick Ratio (5-year Average) Ranking |
Cash Ratio Ranking |
Loan-to-Deposit Ratio Ranking |
Liquidity Coverage Ratio Ranking (5-year Average) |
Overall Liquidity Ranking |
|
JPMorgan |
0.87 |
0.44 |
0.82 |
0.52 |
1.12 |
7 |
8 |
3 |
3 |
10 |
5.3 |
|
Goldman Sachs |
1.78 |
1.44 |
1.26 |
0.47 |
1.27 |
2 |
1 |
1 |
2 |
6 |
3.0 |
|
Morgan Stanley |
1.90 |
1.32 |
1.10 |
0.61 |
1.32 |
1 |
2 |
2 |
6 |
5 |
4.3 |
|
Bank of America |
0.81 |
0.32 |
0.32 |
0.55 |
1.17 |
10 |
9 |
9 |
5 |
8 |
7.3 |
|
Citi |
0.99 |
0.44 |
0.44 |
0.52 |
1.16 |
5 |
6 |
7 |
4 |
9 |
6.7 |
|
UBS |
1.07 |
0.48 |
0.48 |
1.29 |
1.62 |
4 |
5 |
6 |
10 |
3 |
6.3 |
|
Deutsche Bank |
0.83 |
0.6 |
0.60 |
0.77 |
1.64 |
9 |
4 |
5 |
9 |
2 |
5.3 |
|
Barclays |
1.41 |
0.7 |
0.70 |
0.74 |
1.72 |
3 |
3 |
4 |
8 |
1 |
4.3 |
|
HSBC |
0.96 |
0.44 |
0.44 |
0.43 |
1.35 |
6 |
6 |
7 |
1 |
4 |
4.0 |
|
Wells Fargo |
0.85 |
0.26 |
0.26 |
0.67 |
1.24 |
8 |
10 |
10 |
7 |
7 |
8.0 |
|
Average |
1.15 |
0.64 |
0.64 |
0.66 |
1.36 |
Source: Company Data, Khaveen Investments
In comparing GS and MS based on liquidity metrics, both firms exhibit strong performance, but GS edges out slightly in overall liquidity ranking. Goldman Sachs has a Current Ratio (5-year average) of 1.78, slightly below MS’s stronger 1.90, indicating that MS has a slight advantage in covering short-term liabilities with its current assets. In terms of the Quick Ratio (5-year average), GS is higher at 1.44 compared to MS’s 1.32, which suggests GS has more liquid assets available to meet short-term obligations. GS also leads in the Cash Ratio with 1.26 versus MS’s 1.10, highlighting greater cash reserves relative to liabilities. For the Loan-to-Deposit Ratio, GS is lower at 0.47 compared to MS’s 0.61, meaning GS has a more conservative approach to lending relative to deposits. Both firms have similar Liquidity Coverage Ratios (5-year average), with GS at 1.27 and MS at 1.32.
|
Liquidity Comparison |
2019 |
2020 |
2021 |
2022 |
2023 |
Average |
|
Goldman Sachs Current Ratio |
1.80 |
1.80 |
1.90 |
1.90 |
1.50 |
1.78 |
|
Goldman Sachs Quick Ratio |
1.50 |
1.50 |
1.50 |
1.50 |
1.20 |
1.44 |
|
Goldman Sachs Cash Ratio |
1.30 |
1.30 |
1.30 |
1.30 |
1.10 |
1.26 |
|
Goldman Sachs Loan-to-Deposit Ratio |
0.57 |
0.45 |
0.44 |
0.46 |
0.43 |
0.47 |
|
Goldman Sachs Liquidity Coverage Ratio |
1.27 |
1.28 |
1.22 |
1.29 |
1.28 |
1.27 |
|
Morgan Stanley Current Ratio |
1.80 |
1.80 |
2.00 |
2.00 |
1.90 |
1.90 |
|
Morgan Stanley Quick Ratio |
1.20 |
1.40 |
1.50 |
1.30 |
1.20 |
1.32 |
|
Morgan Stanley Cash Ratio |
1.00 |
1.10 |
1.20 |
1.20 |
1.00 |
1.10 |
|
Morgan Stanley Loan-to-Deposit Ratio |
0.69 |
0.52 |
0.58 |
0.62 |
0.64 |
0.61 |
|
Morgan Stanley Liquidity Coverage Ratio |
1.34 |
1.29 |
1.34 |
1.32 |
1.29 |
1.32 |
Source: Company Data, Khaveen Investments
That said, from 2019 to 2023, GS showed a general declining trend in liquidity, particularly with declines in the quick and cash ratios. The GS quick ratio remained stable at 1.50 until 2021, but dropped to 1.20 in 2023, indicating a weakening ability to meet short-term obligations. Similarly, the cash ratio fell from 1.30 in 2019-2021 to 1.10 in 2023. GS’s loan-to-deposit ratio has also decreased consistently from 0.57 in 2019 to 0.43 in 2023, suggesting a more conservative lending approach. On the other hand, MS shows a stronger liquidity position overall, with its current ratio improving from 1.80 in 2019-2020 to 2.00 in 2021-2022, and only slightly declining to 1.90 in 2023. While MS’s quick and cash ratios both improved through 2021, they also saw a slight decrease by 2023, dropping to 1.20 and 1.00, respectively. However, MS’s loan-to-deposit ratio has increased from 0.52 in 2020 to 0.64 in 2023. Overall, GS has shown more significant declines in recent years compared to MS.
Conclusion
|
Factor |
Winner |
|
Capital Adequacy Ratio |
Morgan Stanley |
|
Asset Quality |
Morgan Stanley |
|
Liquidity |
Goldman Sachs |
|
Overall |
Morgan Stanley |
Source: Company Data, Khaveen Investments
Overall, in terms of capital adequacy, asset quality, and liquidity, we believe MS outperforms GS. MS boasts a stronger capital adequacy ratio, with an average Tier 1 CAR Ratio of 17.7% compared to GS’s 16.0%, indicating better capital resilience. MS also maintains a consistently higher Total CAR Ratio, benefiting from lower Risk-Weighted Assets. In terms of asset quality, MS has a significantly lower percentage of Non-Performing Loans (‘NPL’) at 0.42%, while GS’s NPLs have been on an upward trend, reaching 1.57% in 2023, signaling deteriorating asset quality. Additionally, MS has demonstrated a more effective risk management strategy with a stable NPL ratio and a gradually increasing Provision Coverage Ratio, contrasting with GS’s declining trend in this metric. Although GS slightly edges out MS in liquidity, particularly in the Quick and Cash Ratios, MS’s overall liquidity position remains strong, with a better Current Ratio and a higher Loan-to-Deposit Ratio. While GS has shown a declining trend in liquidity over recent years, MS has maintained a relatively stable liquidity profile. Thus, MS’s stronger capital adequacy, superior asset quality, and stable liquidity position make it the more resilient and stable option compared to GS.
Comparison of Fixed Income Securities
In the last section, we compared GS and MS in terms of the attractiveness of their fixed income securities. In our previous analysis of JPMorgan, we compared a total of 100 fixed income securities of the companies’ top fixed income securities in terms of their average coupon rates, credit ratings from Fitch, Moody’s, and S&P, their overall average credit rating score, and the ratio of the coupon rate and yield to the credit rating score.
Coupon Rate to Credit Rating Score Ratio
|
Company |
Average Coupon Rate |
Fitch |
Moody’s |
S&P |
Average Credit Rating Score |
Coupon Rate to Credit Rating Score Ratio |
Yield Rate to Credit Rating Score Ratio |
Average Bond Seniority Ranking |
|
JPMorgan |
7.674% |
AA- |
A1 |
A- |
5.3 |
1.44% |
1.07% |
3.5 |
|
Bank of America Corporation |
7.122% |
AA- |
A1 |
A- |
5.3 |
1.34% |
0.93% |
3.9 |
|
Wells Fargo |
6.785% |
A+ |
A1 |
BBB+ |
6.0 |
1.13% |
0.85% |
4.2 |
|
Citigroup |
6.832% |
A |
A3 |
BBB+ |
7.0 |
0.98% |
0.71% |
3.5 |
|
HSBC |
7.464% |
A+ |
A3 |
A- |
6.3 |
1.18% |
0.86% |
4.2 |
|
Morgan Stanley |
6.165% |
A+ |
A1 |
A- |
5.7 |
1.09% |
0.86% |
3.2 |
|
Goldman Sachs |
6.980% |
A |
A2 |
BBB+ |
6.7 |
1.05% |
0.95% |
3.4 |
|
UBS Group |
4.979% |
A |
A3 |
A- |
6.7 |
0.75% |
0.74% |
3.0 |
|
Deutsche Bank |
5.560% |
A- |
A1 |
A |
6.0 |
0.93% |
0.83% |
2.9 |
|
Barclays PLC |
5.821% |
A |
Baa1 |
BBB+ |
7.3 |
0.79% |
0.70% |
3.7 |
|
Total Average |
6.538% |
6.2 |
1.07% |
0.85% |
3.6 |
Source: Company Data, Khaveen Investments
On average, the total coupon rate across all companies is 6.538%, with JPMorgan having the highest coupon rate at 7.674%, and UBS Group having the lowest at 4.979%. Credit ratings indicate the creditworthiness of these institutions, and a lower average credit rating score indicates better credit standing. Barclays PLC has the worst average credit rating score of 7.3, while JPMorgan and Bank of America have the best scores at 5.3. The coupon rate to credit rating score ratio measures the yield a company offers relative to its credit risk. In terms of this metric, JPMorgan stands out with the highest ratio of 1.44%, suggesting a better return relative to its credit risk.
Comparing GS and MS, in terms of the coupon rate to credit rating score ratio, which reflects compensation relative to risk, Morgan Stanley has a slightly better ratio at 1.109% compared to Goldman Sach’s 1.09%. This is mainly due to Morgan Stanley having a better credit rating score compared to Goldman Sachs. Moreover, based on the average bond seniority ranking, MS has the 2nd highest seniority bond ranking, whereas GS is ranked 6th, highlighting that MS has more senior bonds compared to GS. Additionally, having more senior bonds is better for fixed-income investors, as more senior bonds would mean investors will have “first claims on the company’s cash flows” and have first claim on “company’s property, plant, or equipment” in the event of bankruptcy or liquidation. Overall, despite the lower coupon rate to credit rating score ratio, Morgan Stanley holds a better average credit rating score of 5.7, compared to Goldman Sachs’ score of 6.7, indicating that Morgan Stanley is viewed as less risky. According to Fitch, some of its key rating drivers mentioned include its robust capital adequacy ratios like the Tier 1 capital ratio and that “MS is well-placed to comply with the recently proposed Basel III Endgame rules”. Additionally, in terms of Basel 3 endgame impacting CET1, the Federal Reserve announced plans in September to increase “CET1 capital requirements for the G-SIBs by 9%”, which would increase capital requirements for GS and MS, as these banks are a part of (G-SIBs). As a result, banks “will be required to hold more capital against assets, which will reduce the size of their balance sheets”. Moreover, PWC highlighted that in terms of Basel 3 endgame capital implementation, it will “take effect on July 1, 2025 and have a three-year phase in of capital ratio impact until June 30, 2028”.
Additionally, another factor highlighted by Fitch is the consistency of its profitability as “operating profit as a share of RWAs was 2.6% in 1Q24 and 2.7% on average for the 10-year period from 2013-2022, comparing favorably to both U.S. and international peers”. In the first section, we highlighted the superior profitability of MS vs GS in terms of ROA, ROE and net interest margin which are higher than GS.
Moreover, Fitch had also highlighted that MS had a “diversified business model”, particularly around Wealth Management and Investment Management completed by its past acquisitions such as Eaton Vance and E*TRADE. Comparatively, Fitch noted diversification weakness in GS’s business model, where they highlighted that “GS’s ratings have been constrained by its business model’s weighting toward investment banking and trading activities”.
|
Revenue Breakdown by Segment |
2014 |
2015 |
2016 |
2017 |
2018 |
2019 |
2020 |
2021 |
2022 |
2023 |
|
GS IB |
81.1% |
80.9% |
80.8% |
80.3% |
79.9% |
80.8% |
82.6% |
84.8% |
77.3% |
76.1% |
|
GS AM |
18.9% |
19.1% |
19.2% |
19.7% |
20.1% |
19.2% |
17.4% |
15.2% |
22.7% |
23.9% |
|
MS IB |
65.7% |
65.9% |
68.3% |
71.1% |
67.7% |
66.4% |
66.6% |
55.5% |
61.6% |
62.0% |
|
MS AM |
34.5% |
34.7% |
35.7% |
35.8% |
36.7% |
38.0% |
35.0% |
40.5% |
44.5% |
44.2% |
Source: Company Data, Khaveen Investments
The table shows that GS has consistently had higher exposure to IB compared to MS, with IB contributing over 80% of GS’s revenue until 2020, though it dropped to 76.1% in 2023. In contrast, AM only accounted for 15.2% to 23.9% of GS’s revenue in recent years. On the other hand, MS has more balanced revenue exposure, with IB contributing between 55.5% and 71.1% and AM steadily increasing to 44.2% in 2023.
Outlook
|
Factor |
Winner |
|
Average Coupon Rate |
Goldman Sachs |
|
Average Credit Rating Score |
Morgan Stanley |
|
Bond Seniority Ranking |
Morgan Stanley |
|
Overall |
Morgan Stanley |
Source: Company Data, Khaveen Investments
Overall, Morgan Stanley edges out Goldman Sachs in terms of fixed income securities despite Goldman Sachs having a better average coupon rate, as we believe MS is superior to GS in terms of its creditworthiness based on average credit rating score and bond seniority ranking. MS is better than GS in terms of credit ratings with a stronger average credit rating score of 5.7, indicating lower credit risk compared to GS’s score of 6.7. Several factors highlighted for this are due to MS’s robust capital adequacy ratios. Additionally, MS has a more diversified revenue model, with a balanced mix of Investment Banking (IB) and Asset Management (AM). In 2023, AM accounted for 44.2% of MS’s revenue, whereas GS’s revenue remains heavily weighted toward IB, contributing 76.1% in the same year. In contrast, GS’s focus on investment banking and trading activities indicates less diversified and more volatile revenue streams as highlighted in our first section where we analyzed the higher volatility as measured by the standard deviation of investment banking revenues compared to asset management. In terms of bond seniority rankings, MS has the 2nd highest bond seniority ranking, indicating it has more senior bonds compared to GS which is ranked 6th.
Risk: Lower Interest Rates
As highlighted in our analysis in JPMorgan, we believe one of the risks for Financials companies is the reduction in interest rates. In September, the Federal Reserve cut rates by 50 basis points and their projections indicate further rate cuts going into 2025. We believe lower rates could impact MS and GS’ total revenues negatively. MS’s net interest income was $8,803 mln or 16% of its 2023 revenues while GS’s net interest income was $6,351 mln or 14% of its total revenues.
Verdict
|
Factor |
Winner |
|
Overall Investment Banking |
Morgan Stanley |
|
Overall Asset Management |
Goldman Sachs |
|
Profitability |
Morgan Stanley |
|
Overall Fundamentals |
Morgan Stanley |
|
Capital Adequacy Ratio |
Morgan Stanley |
|
Asset Quality |
Morgan Stanley |
|
Liquidity |
Goldman Sachs |
|
Overall Financial Position |
Morgan Stanley |
|
Average Coupon Rate |
Goldman Sachs |
|
Average Credit Rating Score |
Morgan Stanley |
|
Bond Seniority Ranking |
Morgan Stanley |
|
Overall Fixed Income Comparison |
Morgan Stanley |
Source: Company Data, Khaveen Investments
To conclude, we believe MS is the superior choice for fixed-income investors due to its stronger fundamentals and financial position. We find that MS demonstrates more stable revenue growth and smaller declines during downturns across key segments like Investment Banking, Trading, and Asset Management, with lower volatility compared to GS. Additionally, we observe that MS shows better profitability, with higher ROA and NIM, and a stronger capital adequacy ratio, indicating better capital resilience. We also believe that MS outperforms GS in asset quality, maintaining a lower percentage of Non-Performing Loans (NPL) and a more effective risk management strategy. While GS offers a slightly higher coupon rate to credit rating score ratio, we believe MS’s stronger average credit rating score of 5.7 indicates lower credit risk. Furthermore, we see that MS’s diversified revenue model, with a balanced mix of Investment Banking and Asset Management, contrasts with GS’s heavier reliance on Investment Banking. Additionally, MS holds the 2nd highest bond seniority ranking, indicating it has more senior bonds than GS, which ranks 6th. Notwithstanding, while we believe MS is superior to GS for fixed income, we believe GS is also decent due to its strong position in both investment banking and asset management. Not to mention, both companies have average yield rate to credit rating score ratios above the average of top Financials firms. Thus, we rate both Morgan Stanley and Goldman Sachs fixed income securities as a Buy.
Analyst’s Disclosure: I/we have a beneficial long position in the shares of GS.PR.A, MS.PR.A either through stock ownership, options, or other derivatives. I wrote this article myself, and it expresses my own opinions. I am not receiving compensation for it (other than from Seeking Alpha). I have no business relationship with any company whose stock is mentioned in this article.
No information in this publication is intended as investment, tax, accounting, or legal advice, or as an offer or solicitation to sell or buy. Material provided in this publication is for educational purposes only and was prepared from sources and data believed to be reliable, but we do not guarantee its accuracy or completeness.
Seeking Alpha’s Disclosure: Past performance is no guarantee of future results. No recommendation or advice is being given as to whether any investment is suitable for a particular investor. Any views or opinions expressed above may not reflect those of Seeking Alpha as a whole. Seeking Alpha is not a licensed securities dealer, broker or US investment adviser or investment bank. Our analysts are third party authors that include both professional investors and individual investors who may not be licensed or certified by any institute or regulatory body.