
Summary:
- Amazon is an ultra value strong buy, especially for high-yield investors, with a 44% undervaluation and explosive return potential justified by spectacular fundamentals.
- Combining Amazon with high-yield blue chips can turbocharge long-term income, resulting in inflation-adjusted income over the last 25 years.
- Amazon’s hyper growth is driven by investments in high-margin sectors like AWS and advertising, with a clear path to continued growth beyond 2029.
- Amazon’s over $1 trillion in growth spending through 2029 is expected to generate almost $200 billion in free cash flow in 2030, and its cash pile could grow to $700+ billion.
- Amazon could likely soon begin paying dividends and buying back stock, but its 0.5 PEG ratio, 27% annual growth in free cash flow, and 80% one-year return potential make it the most attractive big tech name by a wide margin for 2025 and beyond.
bigtunaonline/iStock via Getty Images
Bottom Line Up Front: Amazon Is An Ultra Value Buy Ahead Of Earnings… Including Dividend Investors
Amazon isn’t a dividend stock... yet, but it’s clear that if it grows as expected, one day soon, it will likely have to pay a dividend and repurchase stock in exceptional amounts.
Medium-Term Amazon Balance Sheet Consensus
| Year | Total Debt (Millions) | Cash | Net Debt (Millions) |
| 2023 | $58,314 | $73,387 | $62,224 |
| 2024 | $53,930 | $111,920 | -$24,492 |
| 2025 | $52,130 | $178,869 | -$95,788 |
| 2026 | $50,477 | $279,024 | -$179,444 |
| 2027 | $58,314 | $407,840 | -$279,861 |
| 2028 | $58,314 | $553,890 | -$371,143 |
| 2029 | $58,314 | $674,052 | -$484,828 |
| Annualized Growth (2024-2029) | 0.0% | 44.7% | 81.7% |
(Source: FactSet)
Amazon is on track to have twice as much net cash on its balance sheet by 2029 as Apple (AAPL) had when it began the most significant cash return to shareholders in history ($250 billion in 2012).
Amazon is a coiled spring, and earnings are the most significant short-term potential catalyst to trigger a run to new record highs.
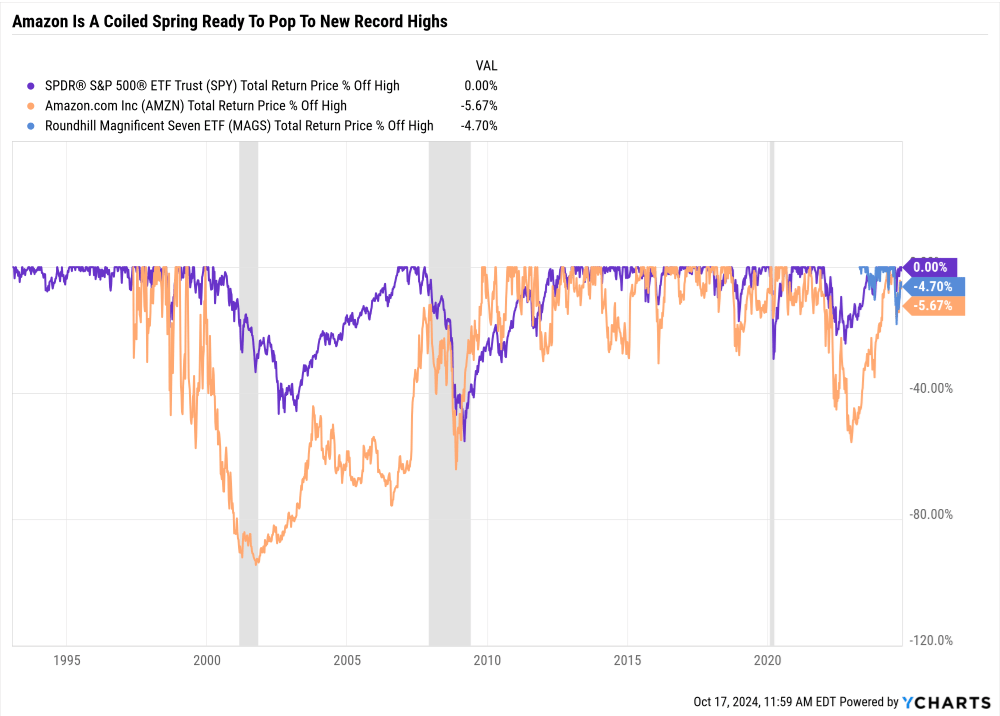
Ycharts
Consensus Total Return Potential
- Not a forecast.
- Consensus return potential.
- These are the expected returns if and only if these companies grow as expected and return to historical fair value by the end of 2026.
- Fundamentals would justify that.
2-Year Fundamentally Justified Upside Potential: 127% vs 22% S&P.
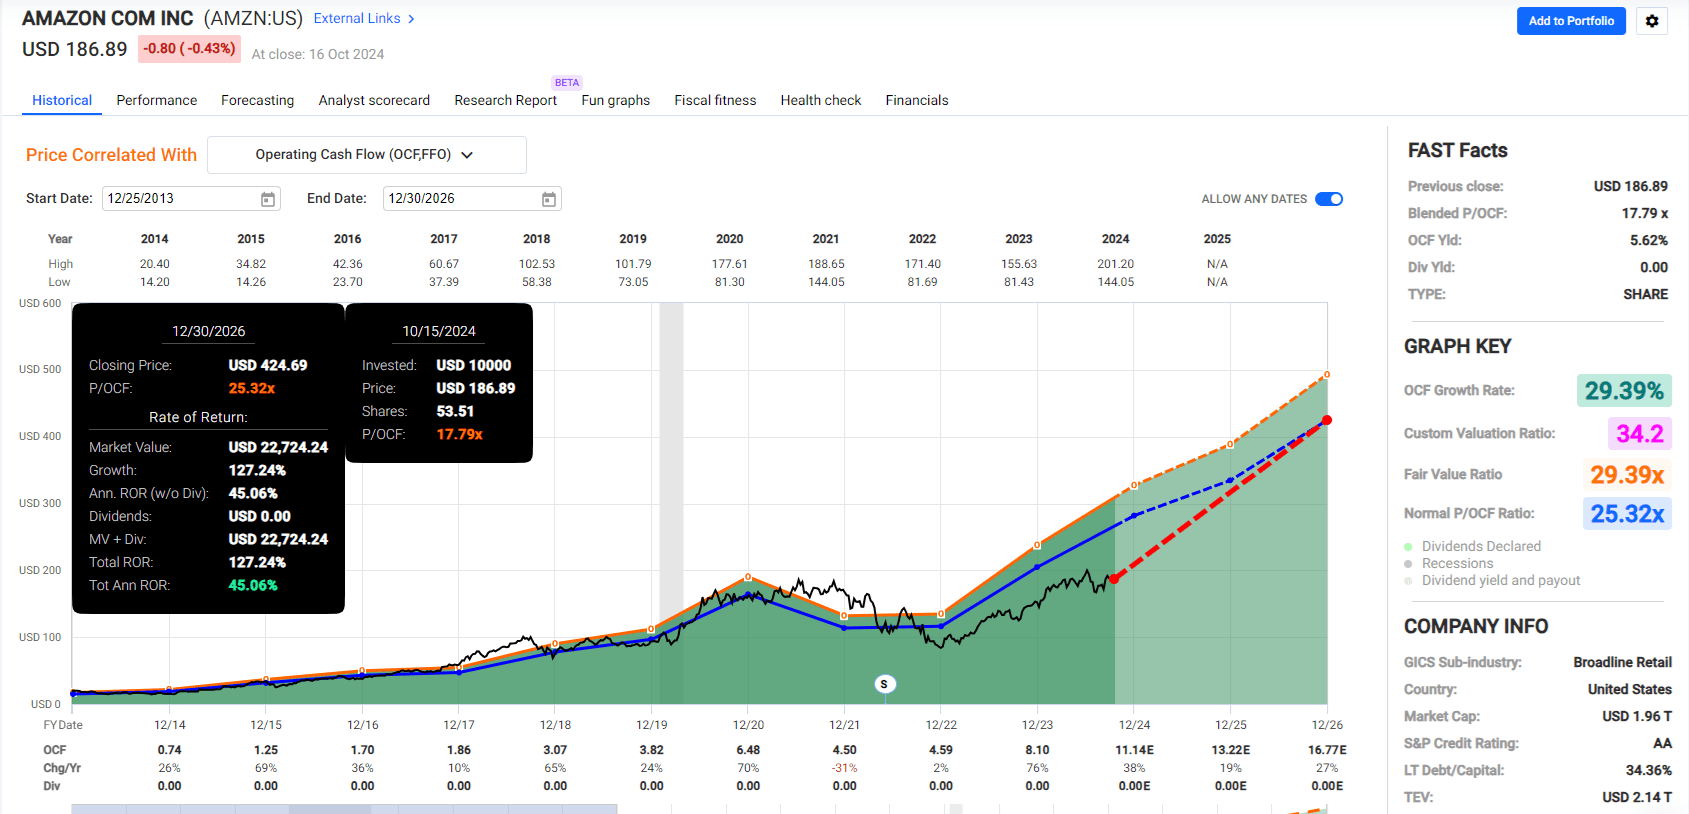
FAST Graphs, FactSet
5-Year Consensus Return Potential: 265% (28% CAGR) vs 76% (12% CAGR) S&P.
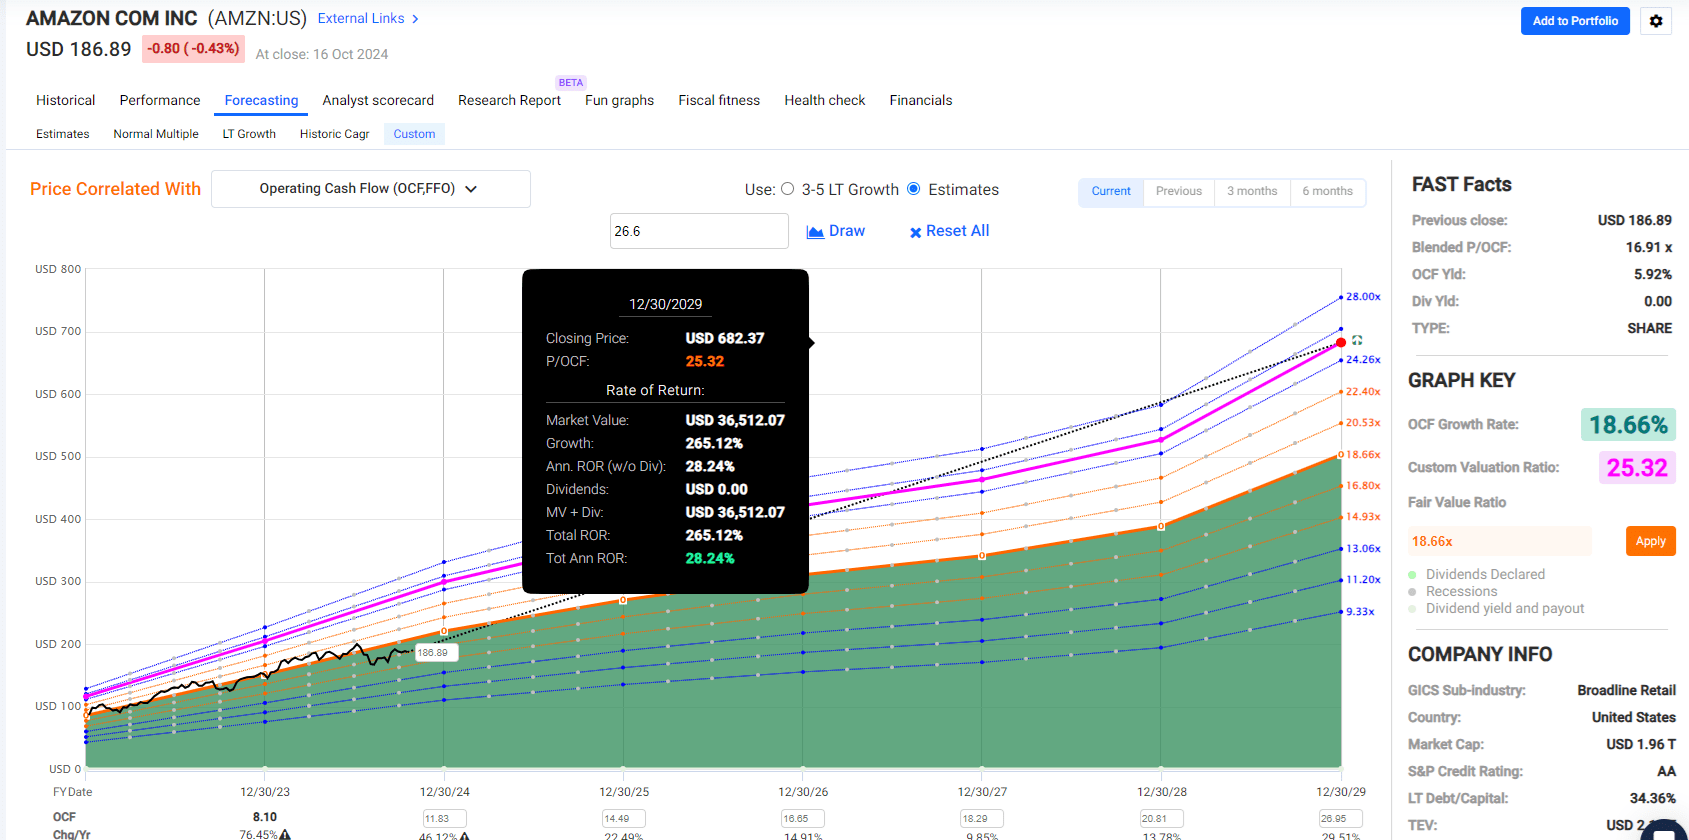
FAST Graphs, FactSet
First Reason High-Yield Investors Should Buy Amazon Now: It Turbocharges Portfolio Income
I can’t stress this enough: Maximizing long-term income requires focusing on total returns.
That’s because dividend reinvestment and annual rebalancing mean total returns drive income growth rates.
AMZN, combined with high-yield blue chips such as British American (BTI), Enbridge (ENB), and Toronto-Dominion Bank (TD), can generate far more income than just buying high-yield blue chips alone.
- TD, BTI, and ENB yield 6.7%, more than 2X Vanguard’s High-Yield ETF (VYM), which is 2.8%.
Historical Returns Since 1997
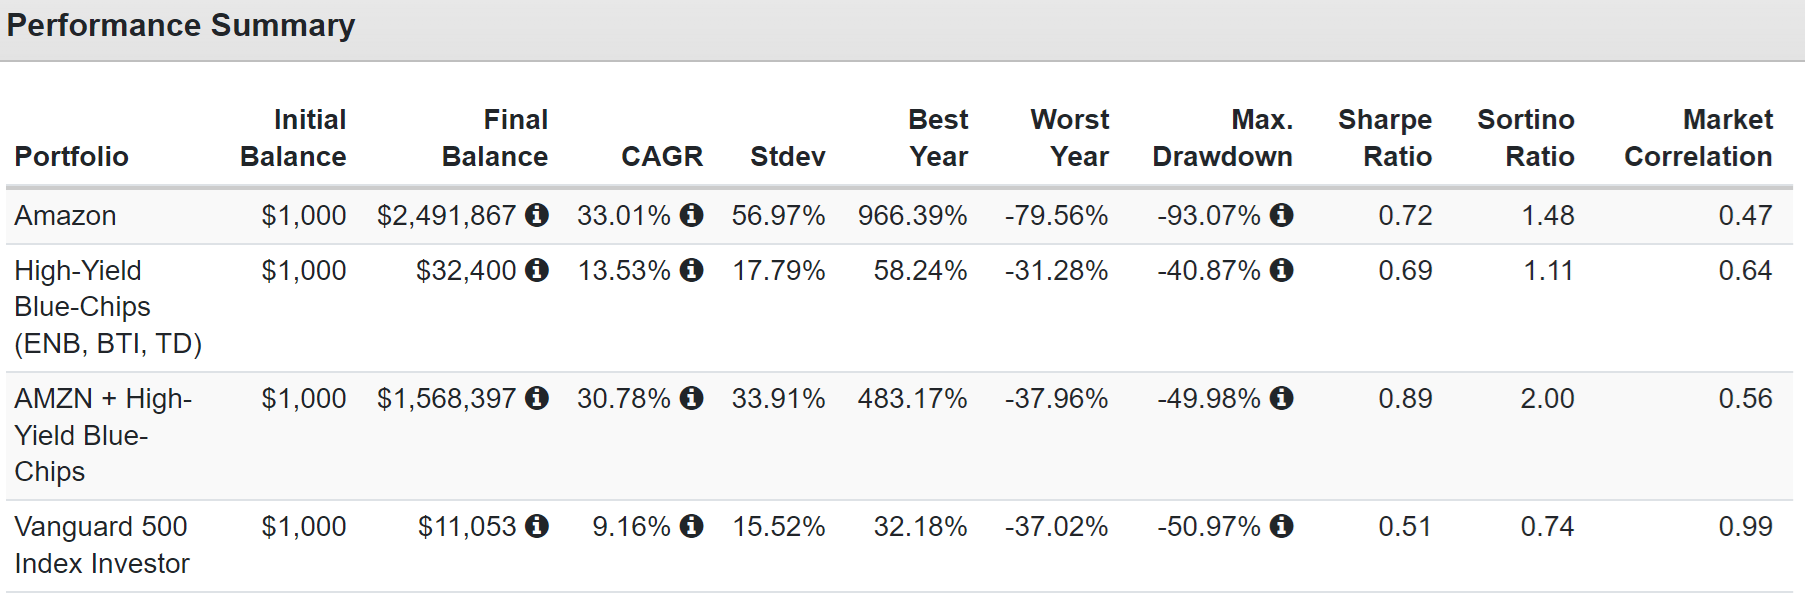
Portfolio Visualizer
High-yield blue chips did great, beating the market with smaller declines in the worst bear markets.
Portfolio Visualizer
AMZN and high-yield, adjusted for inflation, beat high-yield alone by 47X and the S&P by 142X.
Portfolio Visualizer
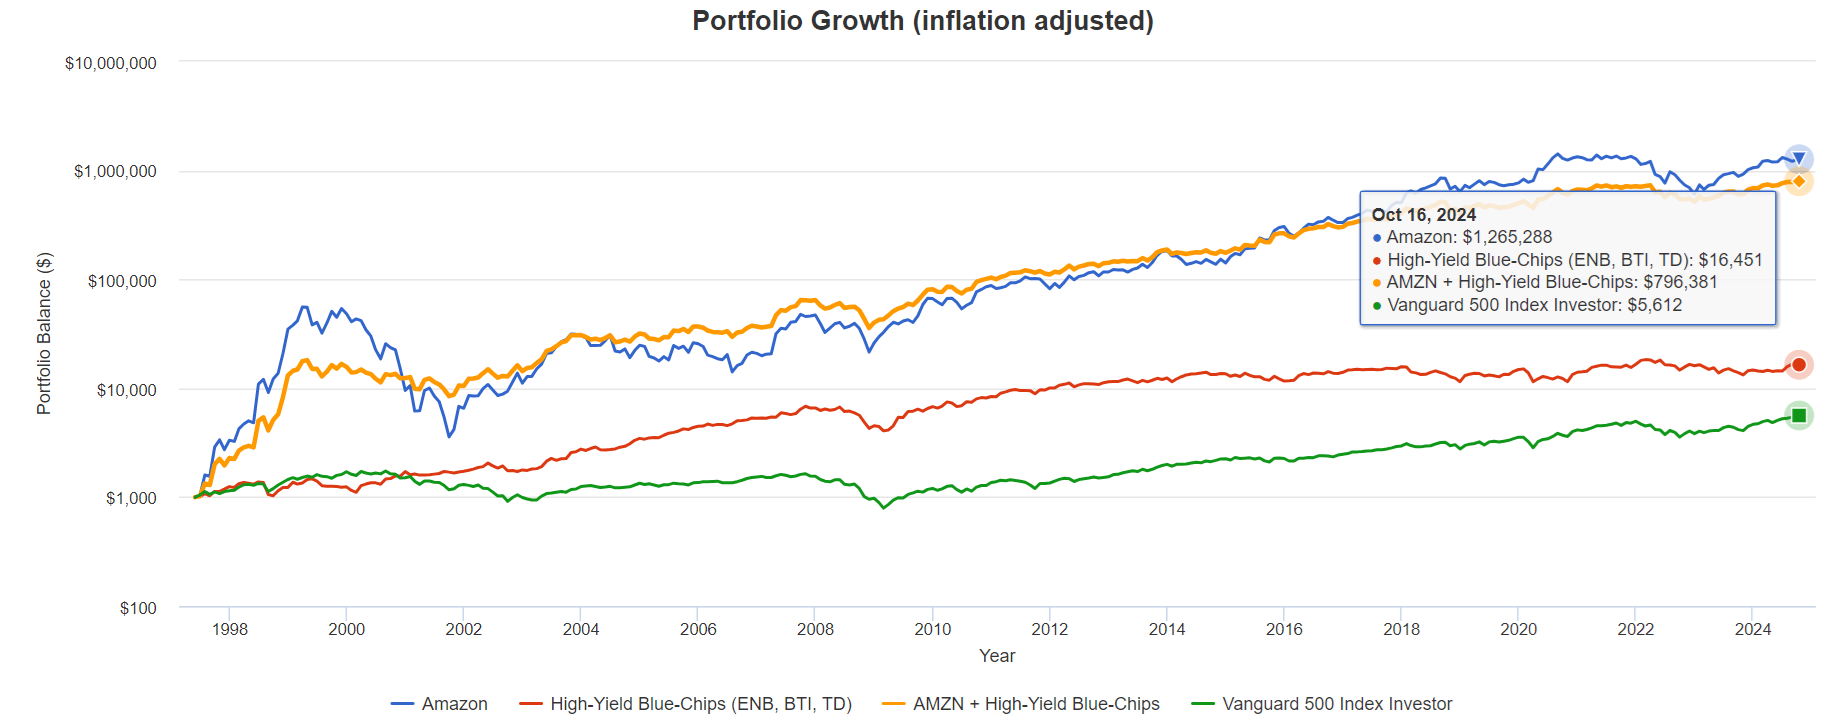
Combining AMZN with a high yield reduced the volatility (conditional value at risk).
In other words, the 5% worst monthly declines were half as painful, and this combo captured 166% of the S&P’s upsides in rising markets with just 78% of the downside.
- 60-40 stock/bond retirement portfolio captures 70% of the S&P’s upside and 80% of its downside.
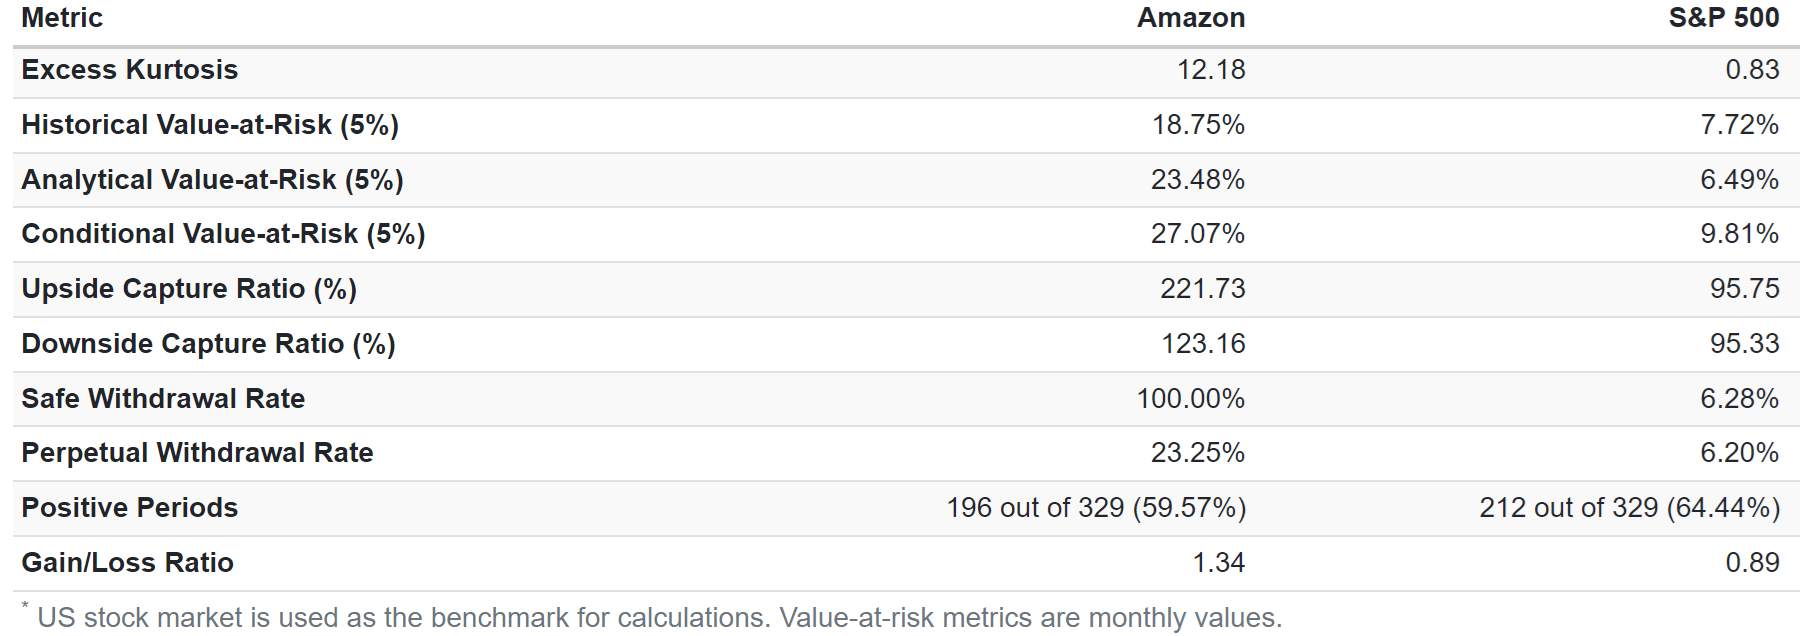
The safe perpetual withdrawal rate of the 60-40 was 4% per year. For the S&P, it was 6%; for high-yield blue chips, it was 10%; for AMZN, it was 23%; but for AMZN and high-yield, it was almost as good, 22%.
- Take out 22% of the portfolio in 1997 and adjust for inflation each year.
A 5% annual withdrawal rate is a generous retirement (and minimum charitable endowments payout), and my ZEUS family portfolio seeks 6.5% yearly withdrawals.
- 5% charity.
- 0.5% family and friend gifts.
- 1% living expenses (for future wife and kids).
So, let’s look at a 6.5% withdrawal rate, which is beyond generous and not something most retirees could dream of.
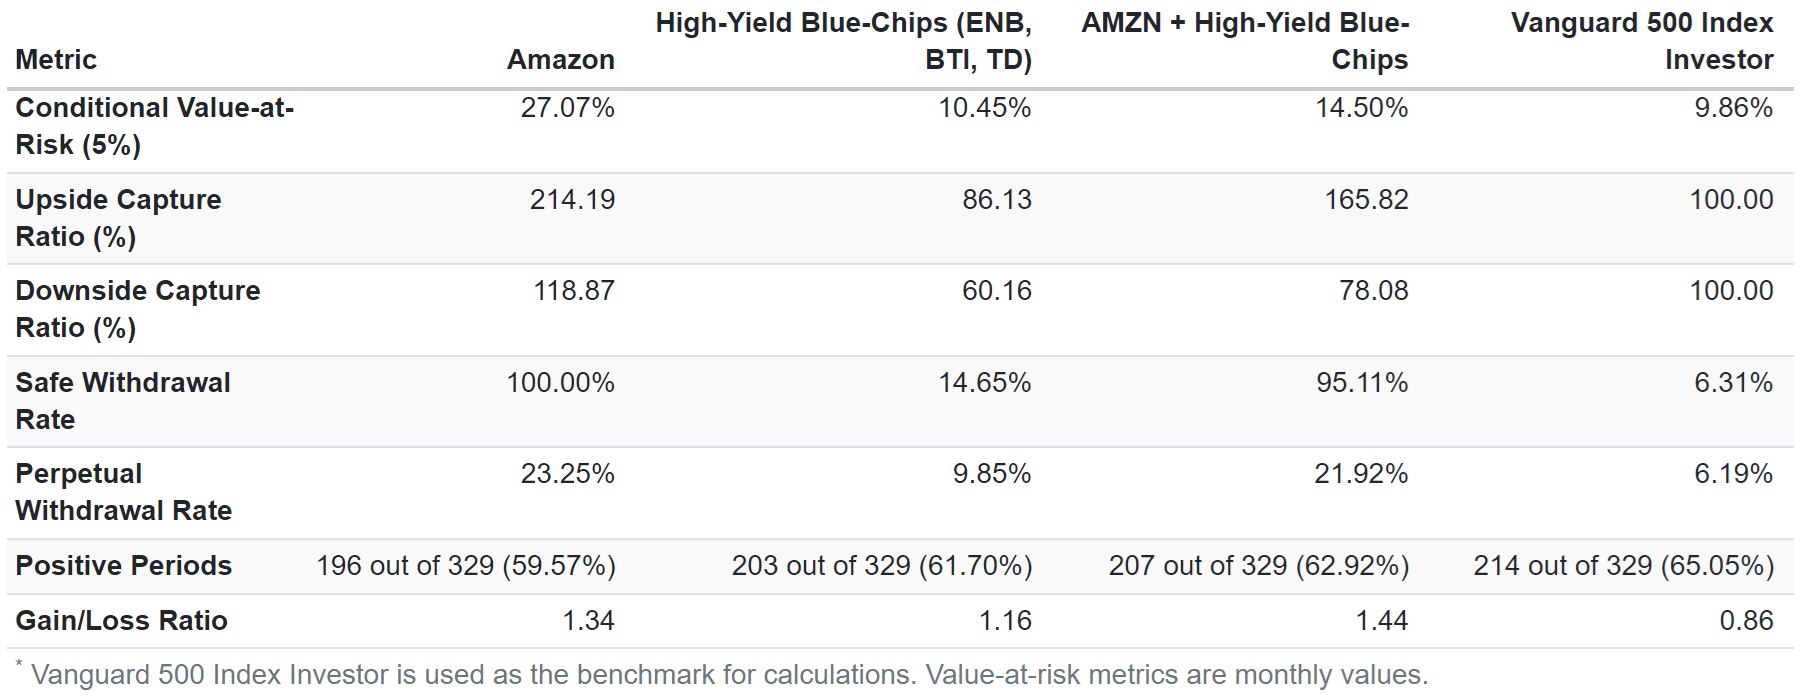
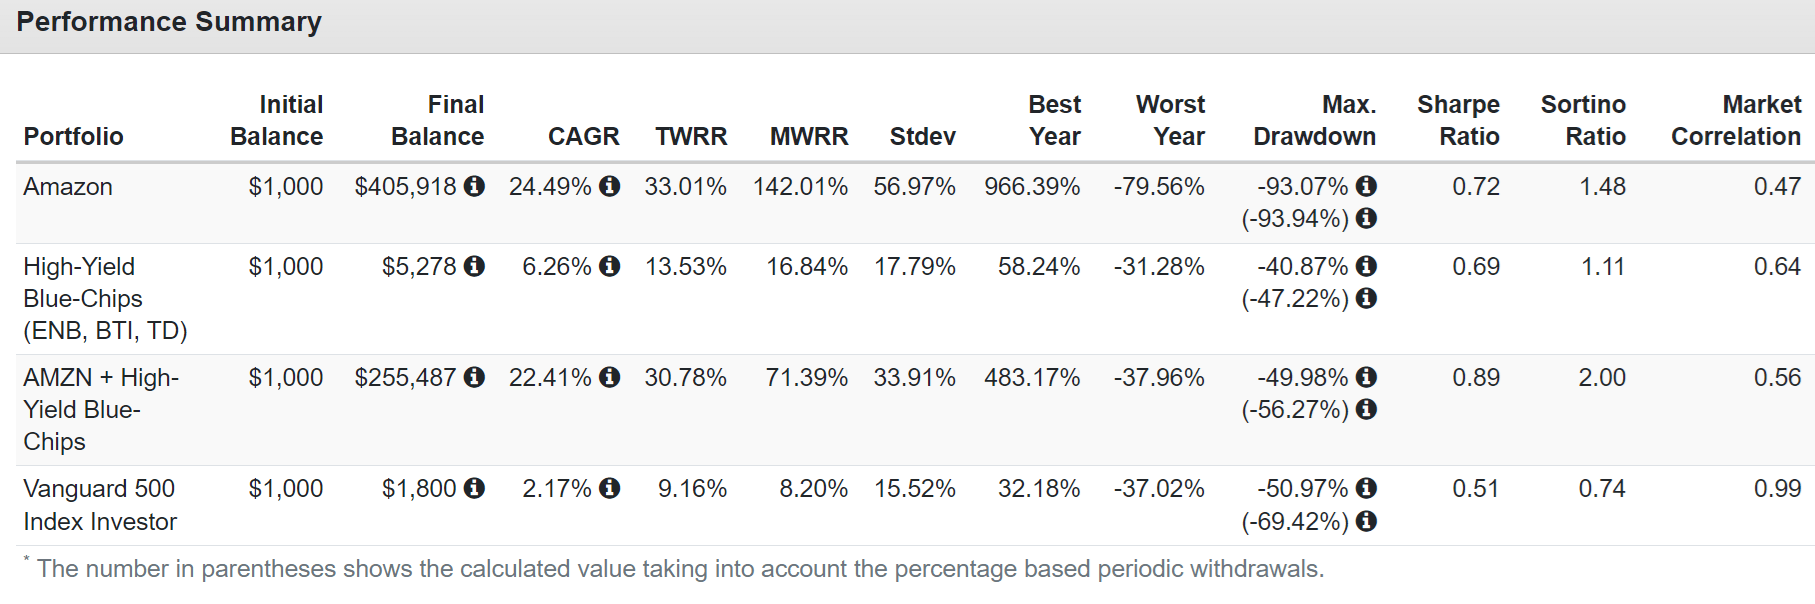
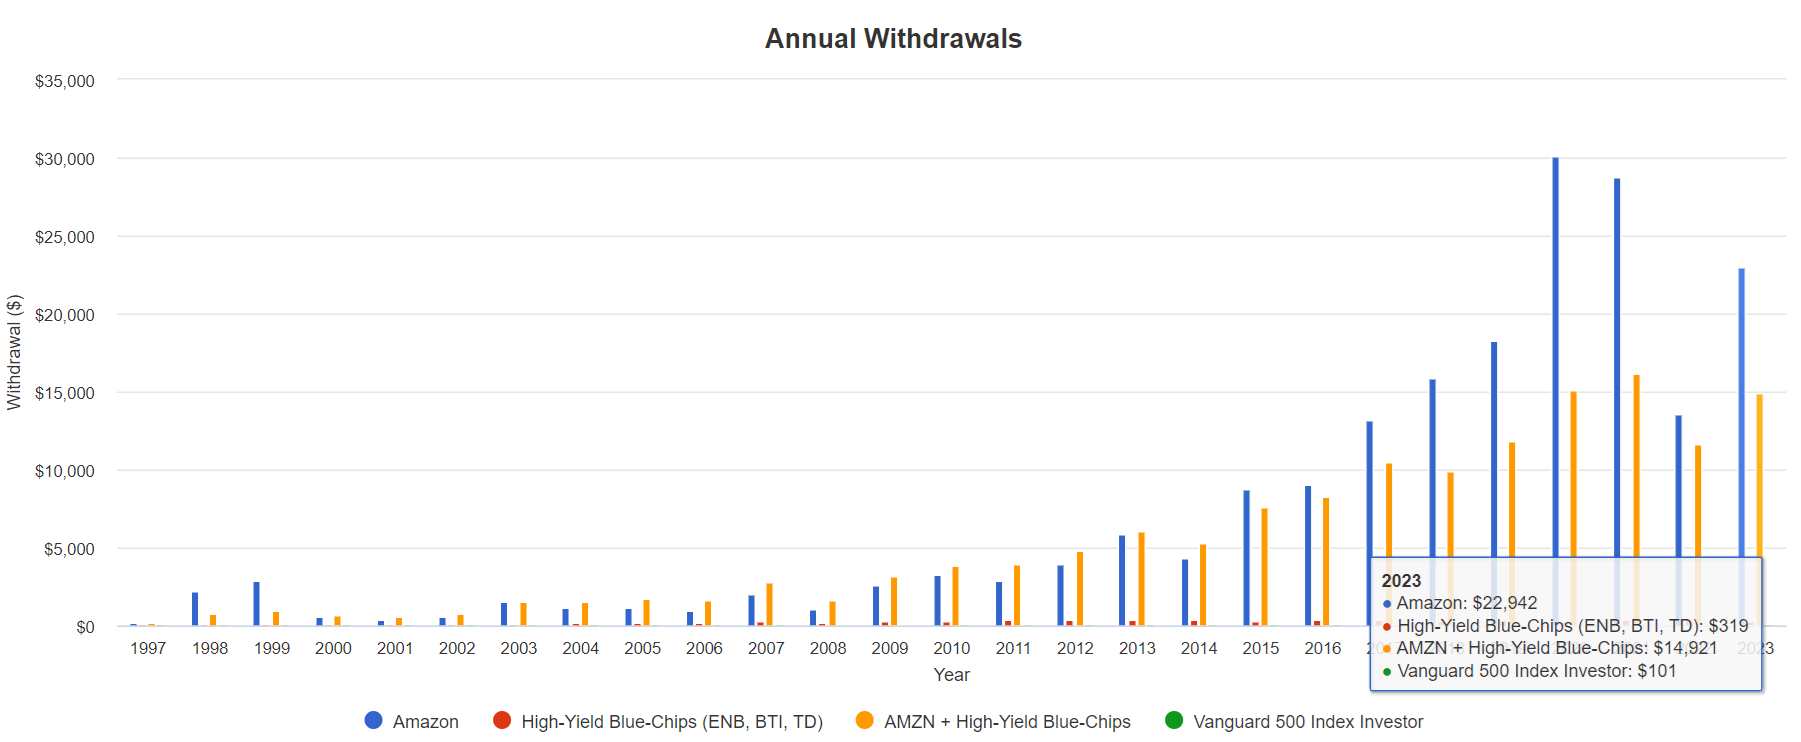
Total Returns Since 1997 (6.5% Annual Withdrawals)
Portfolio Visualizer
If you withdrew 6.5% per year from the S&P, you would have an 80% appreciation for your principal.
With high-yield blue chips at 428%, and for AMZN and high-yield 256X returns.
Portfolio Visualizer
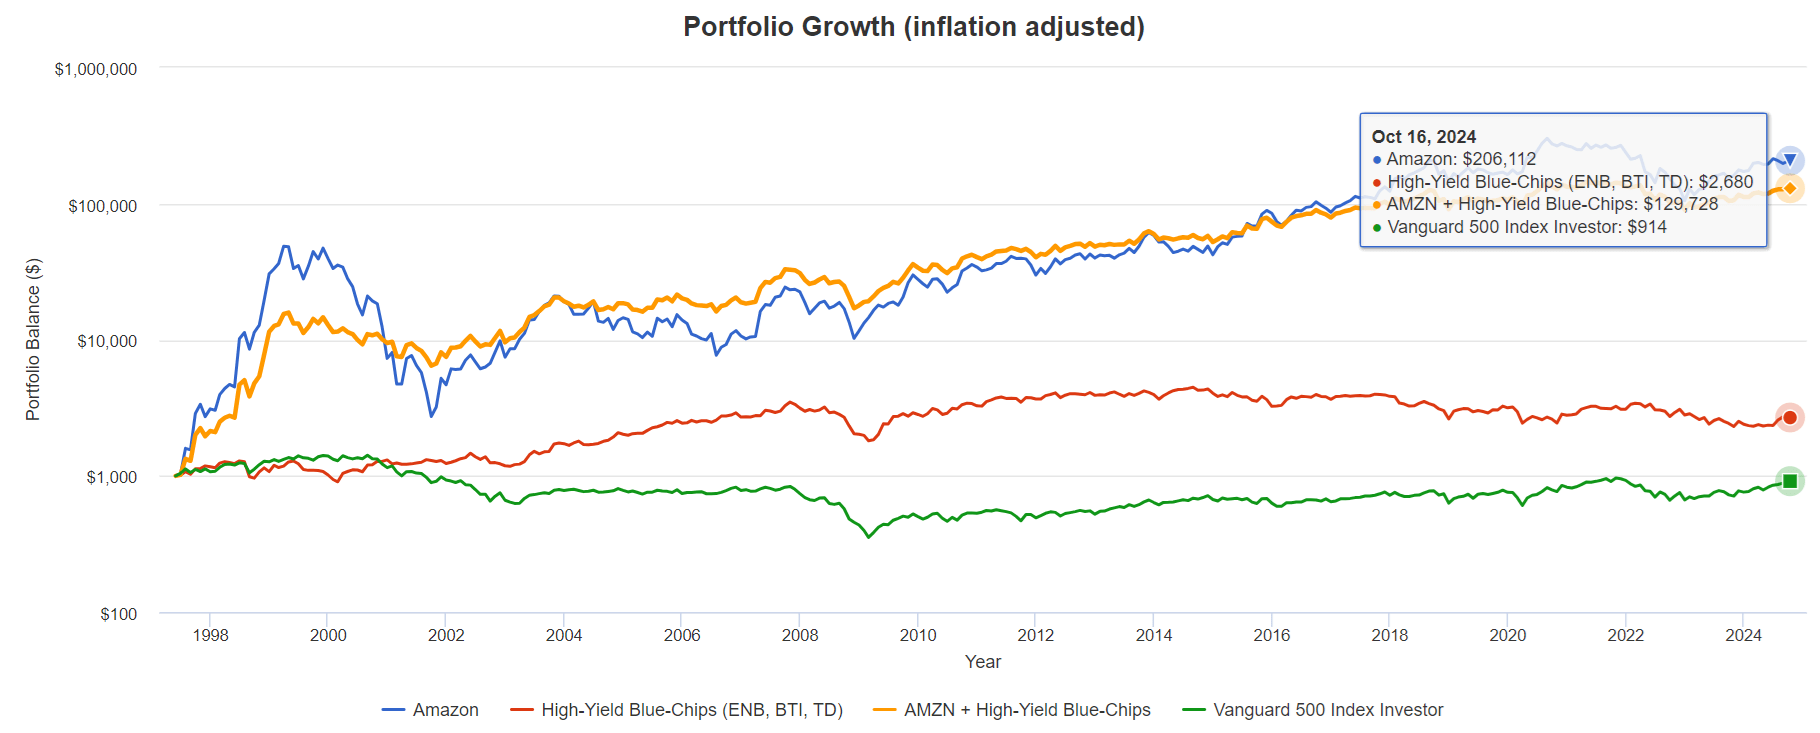
If you started with $1,000 in 1997 and took out $65 per year and adjusted for inflation, today, your $1,000 is worth $914, adjusted for inflation.
Given your income, that’s pretty good purchasing power resilience.
High-yield blue chips took $1,000, paid out even more income, and are now worth $2700 adjusted for inflation.
However, high-yield and Amazon together (with annual rebalancing), turned $1,000 into $130,000 (adjusted for inflation) and looked at the generated income.
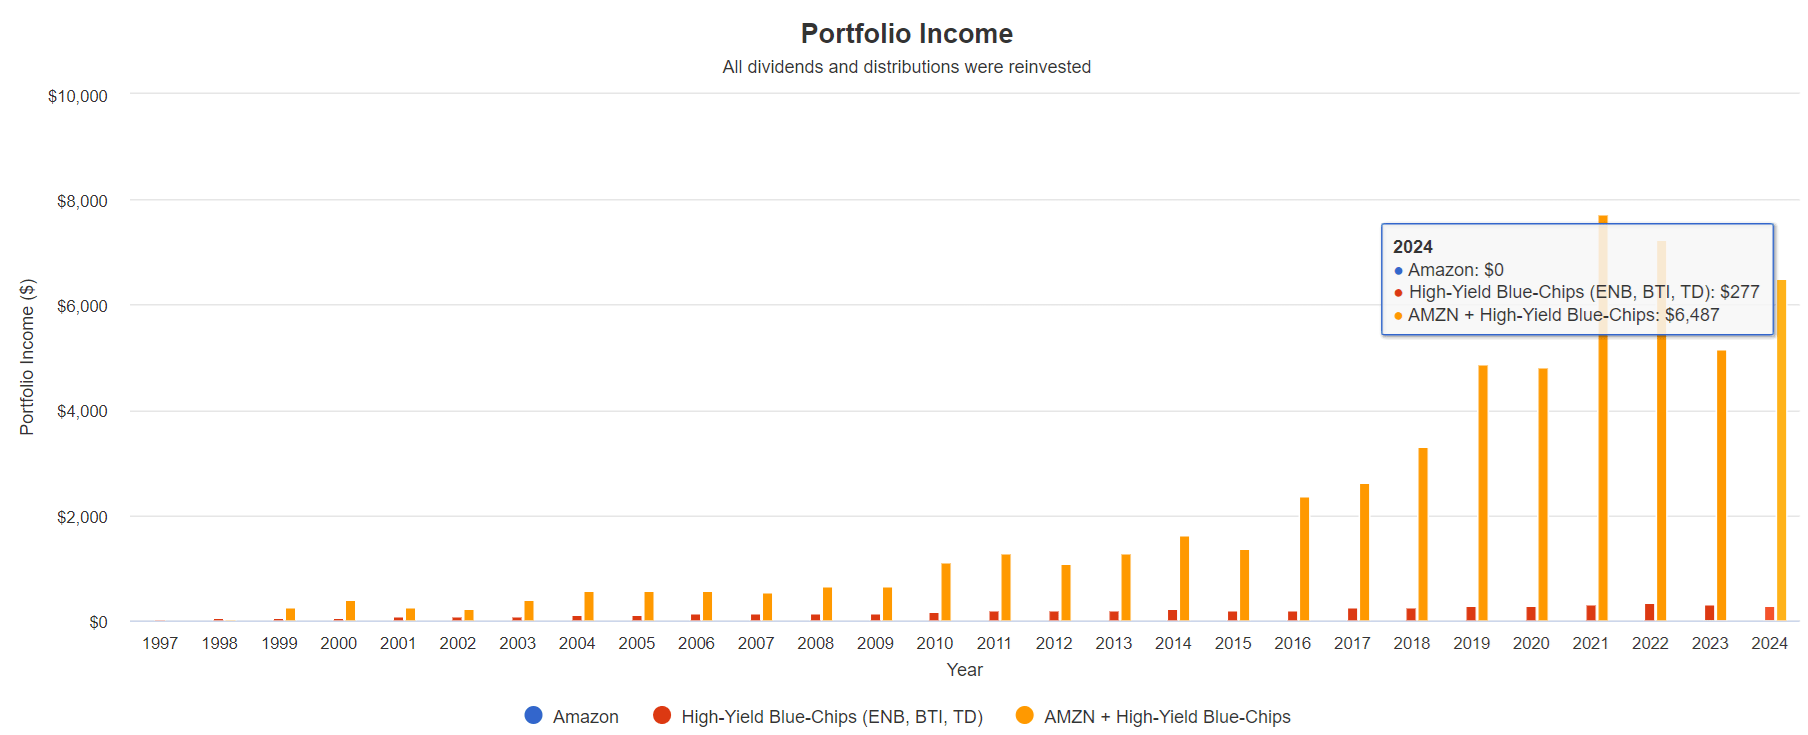
Income Per $1,000 Investment In 1997 (6.5% Annual Withdrawal Rate)
Portfolio Visualizer
Portfolio Visualizer
Behold the power of long-term high-yield + hyper-growth compounding.
| Metric | High-Yield Blue-Chips (ENB, BTI, TD) | AMZN + High-Yield Blue-Chips | S&P 500 |
| Total Income | $4,982.45 | $57,469.42 | $1,500.33 |
| Inflation-Adjusted Income | $2,516.39 | $29,024.96 | $757.74 |
| Total Withdrawals | $7,014.53 | $147,898.24 | $1,930.60 |
| Inflation-Adjusted Total Withdrawals | $3,542.69 | $74,696.08 | $975.05 |
| Inflation-Adjusted Withdrawals Compared To High-Yield Blue-Chips Alone | 1.00 | 21.08 | 0.28 |
| Starting Yield | 5.07% | 2.54% | 2.54% |
| Yield On Cost | 37.0% | 864.9% | 12.9% |
| Inflation-Adjusted Yield On Cost | 18.67% | 436.81% | 6.50% |
| Income Growth | 9.3% | 26.0% | 7.8% |
| Total Return | 5.7% | 19.4% | 1.9% |
(Source: Portfolio Visualizer Premium)
A 6.5% annual withdrawal rate on the S&P resulted in $975 inflation-adjusted withdrawals, and you’re left with $980 in buying power. Not bad.
With high-yield blue chips, $1,000 resulted in $3,500 in withdrawals, and that $1,000 investment in 1997 is worth $2,800 adjusted for inflation. Excellent.
But combine hyper growth with high yield, and the inflation-adjusted withdrawals were $75,000. Today, they’re $130,000, adjusted for inflation.
- $1,000 became $205,000, adjusted for inflation, compared to $6,300 for high-yield blue chips alone and $1,975 for the S&P.
That’s 33X greater inflation-adjusted wealth creation than pure high-yield investing, which generated 3X more inflation-adjusted wealth than the S&P.
- High-yield investing was 3X better than the S&P.
- High-yield + hyper-growth was 104X better than the S&P.
Second Reason High-Yield Investors Should Buy Amazon: Hyper-Growth For The Foreseeable Future
OK, so had you known that Amazon would be one of the most significant growth stories of all time, you’d have made a fortune.
But how long can Amazon grow at close to 30% annually?
Let’s look at the medium-term FactSet consensus from all 70 analysts covering Amazon for a living.
Together, we know Amazon’s business better than anyone other than management.
Medium-Term Amazon Growth Consensus
| Year | Sales | Free Cash Flow | EBITDA | EBIT (Operating Income) | Net Income |
| 2023 | $574,785 | $36,658 | $110,775 | $36,852 | $30,425 |
| 2024 | $635,274 | $54,500 | $141,001 | $62,301 | $50,635 |
| 2025 | $704,013 | $69,500 | $167,703 | $76,385 | $63,178 |
| 2026 | $777,054 | $96,495 | $197,680 | $93,855 | $78,543 |
| 2027 | $852,458 | $118,438 | $210,646 | $114,439 | $94,473 |
| 2028 | $917,228 | $130,861 | $238,465 | $133,866 | $111,668 |
| 2029 | $991,689 | $152,116 | $272,179 | $160,044 | $134,634 |
| Annualized Growth 2024-2029 | 9.5% | 26.8% | 16.2% | 27.7% | 28.1% |
| Cumulative 2024-2029 | $4,877,716 | $621,910 | $1,227,674 | $640,890 | $533,131 |
(Source: FactSet)
AMZN is growing sales at double digits, but thanks to solid margin expansion, free cash flows are expected to increase threefold through 2029.
Medium-Term Amazon Growth Consensus
| Year | FCF Margin | EBITDA Margin | EBIT (Operating) Margin | Net Margin |
| 2023 | 6.4% | 19.3% | 6.4% | 5.3% |
| 2024 | 8.6% | 22.2% | 9.8% | 8.0% |
| 2025 | 9.9% | 23.8% | 10.8% | 9.0% |
| 2026 | 12.4% | 25.4% | 12.1% | 10.1% |
| 2027 | 13.9% | 24.7% | 13.4% | 11.1% |
| 2028 | 14.3% | 26.0% | 14.6% | 12.2% |
| 2029 | 15.3% | 27.4% | 16.1% | 13.6% |
| Annualized Growth | 15.8% | 6.1% | 16.6% | 17.0% |
(Source: FactSet)
Amazon’s margin growth rate is on par with Microsoft’s (MSFT) and Alphabet’s (GOOG) (GOOGL) EPS growth rates.
In other words, other tech giants are happy to grow at 15% to 17%, while Amazon’s margins are increasing at those rates.
That’s because the fastest-growing parts of the business (advertising and AWS) also have the highest margins.
As long as they continue to grow faster than revenue overall (9.5%), Amazon’s margins will keep rising, and profits will continue to grow hyper fast.
- Margins will keep rising as long as Amazon can grow sales faster than costs.
But how can Amazon keep growing sales at almost double digits (doubling every eight years) when it’s already selling $700 billion annually and expected to reach $1 trillion by 2029?
7 $1+ trillion growth markets for Amazon to Keep Investing In
- Digital Retail
- Third-Party Logistics
- Trucking
- Robo-Taxis
- Robotics
- Healthcare
- AI
Amazon is already investing aggressively in each of these markets. How much is it investing?
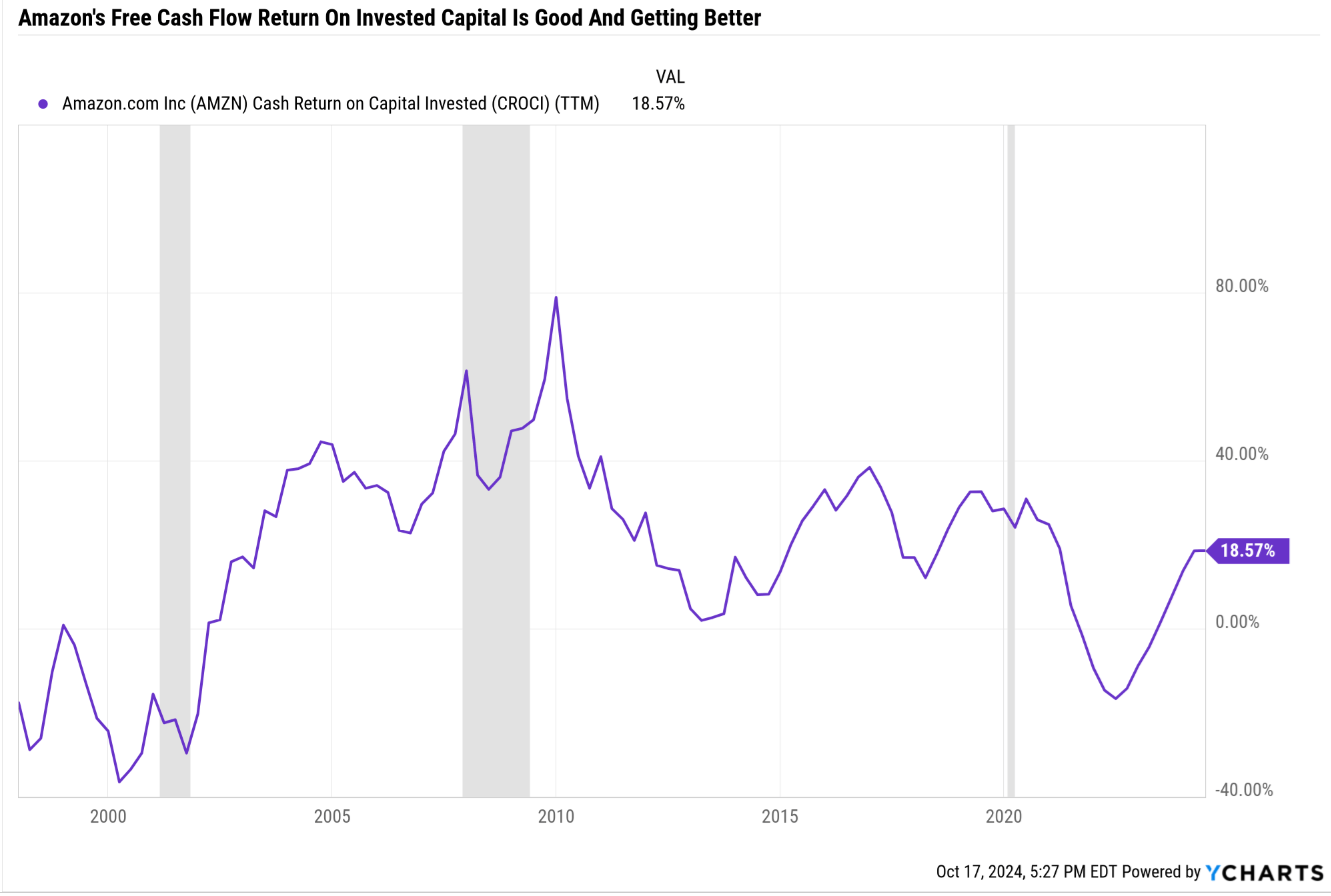
Ycharts
By investing in growth capex and R&D.
Medium-Term Amazon Growth Spending Consensus
| Year | Sales | R&D | Capex | Total Growth Spending | Growth Spending/Sales |
| 2023 | $574,785 | $85,622 | $52,729 | $138,351 | 24.1% |
| 2024 | $635,274 | $86,688 | $66,077 | $152,765 | 24.0% |
| 2025 | $704,013 | $96,831 | $72,522 | $169,353 | 24.1% |
| 2026 | $777,054 | $105,313 | $72,522 | $177,835 | 22.9% |
| 2027 | $852,458 | $109,692 | $77,437 | $187,129 | 22.0% |
| 2028 | $917,228 | $117,530 | $78,950 | $196,480 | 21.4% |
| 2029 | $991,689 | $125,560 | $83,117 | $208,677 | 21.0% |
| Annualized Growth | 9.52% | 6.59% | 11.21% | 8.73% | -1.67% |
| Total Spending 2024-2029 | $4,877,716 | $641,614 | $450,625 | $1,092,239 | |
| FCF Return On Invested Capital | 18.57% | 2030 Marginal FCF | $38,751 | ||
| 2029 FCF Consensus | $152,116 | 2030 Consensus FCF | $190,867 | ||
| 20-Year FCF Multiple | 49.18 | 2030 FCF Fair Value | $9,386,855 | ||
| Current Market Cap | $1,960,000 | Growth | 378.92% | ||
| Annualized Return Potential Justified By Current Spending Consensus | 36.70% |
(Source: FactSet)
Amazon’s current growth efficiency, combined with its more than $1 trillion in cumulative growth spending through 2029, is expected to generate nearly $200 billion in annual free cash flow by 2030.
Amazon’s growth spending is larger than small, wealthy nations, and it plans to build its own nuclear reactors to power data centers.
Alphabet plans to build seven small modular reactors in the coming years, and Microsoft has signed a 20-year contract with Constellation Energy to reopen Three Mile Island.
- Bloomberg Intelligence has increased its estimate of the percentage of US power going to data centers by 2030.
- From 7% to 9%.
In 2030, one-seventh of US power will be used in data centers, and the hyper-scaler tech giants own almost 90% of that market.
Amazon owns 32% of the market share, which has been stable for several years.
Multiplying that 2030 FCF estimate by the 20-year average FCF multiple provides a $9.4 trillion market cap justified by fundamentals by the end of 2029.
That’s a 37% annualized rate of return that would be 100% justified by today’s medium-term consensus fundamentals.
Can Amazon afford such massive growth spending?
Medium-Term Amazon Balance Sheet Consensus
| Year | Total Debt (Millions) | Cash | Net Debt (Millions) |
| 2023 | $58,314 | $73,387 | $62,224 |
| 2024 | $53,930 | $111,920 | -$24,492 |
| 2025 | $52,130 | $178,869 | -$95,788 |
| 2026 | $50,477 | $279,024 | -$179,444 |
| 2027 | $58,314 | $407,840 | -$279,861 |
| 2028 | $58,314 | $553,890 | -$371,143 |
| 2029 | $58,314 | $674,052 | -$484,828 |
| Annualized Growth (2024-2029) | 0.0% | 44.7% | 81.7% |
(Source: FactSet)
You can see why this is an AA-credit rating company, and by 2029, the net cash position is expected to be almost $500 billion.
- Buybacks and dividends are inevitable.
- $500 billion in net cash is a political risk.
- There’s no way a company can justify sitting on $500 billion in net cash.
- It’s fiduciary irresponsible.
In other words, Amazon is the hyper-growth Mag 7 name with the most straightforward path to continued hyper growth beyond 2029 and well into the 2030s.
Third Reason High-Yield Investors Should Buy Amazon: Valuation Is Outstanding
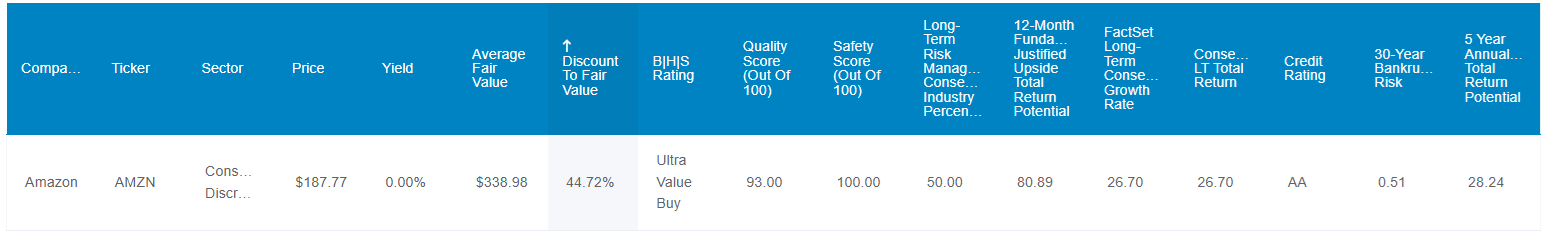
Dividend Kings Zen Research Terminal
- Amazon is 44% undervalued relative to its historical operating cash flow multiples.
Amazon Historical P/Operating Cash Flow
- 20FY Normal P/OCF 25.52x
- 19FY Normal P/OCF 24.88x
- 18FY Normal P/OCF 24.39x
- 17FY Normal P/OCF 24.2x
- 16FY Normal P/OCF 24.22x
- 15FY Normal P/OCF 23.95x
- 14FY Normal P/OCF 24.41x
- 13FY Normal P/OCF 24.92x
- 12FY Normal P/OCF 25.05x
- 11FY Normal P/OCF 25.51x
- 10FY Normal P/OCF 25.32x
- 9FY Normal P/OCF 24.25x
- 8FY Normal P/OCF 24.72x
- 7FY Normal P/OCF 24.33x
- 6FY Normal P/OCF 24.79x
- 5FY Normal P/OCF 23.13x
- 4FY Normal P/OCF 22.7x
- 3FY Normal P/OCF 24.82x
- 2FY Normal P/OCF 24.71x
- 1FY Normal P/OCF 18.54x
I use the 10-year average multiple as a good proxy for market-determined fair value, but the historical range of 24X to 26X cash flow is a good estimate of AMZN’s worth.
This is not my opinion but an objective market fact: Billions of investors have bought and sold AMZN over the past 20 years, indicating a 91% statistical probability that AMZN today is trading dirt cheaply.
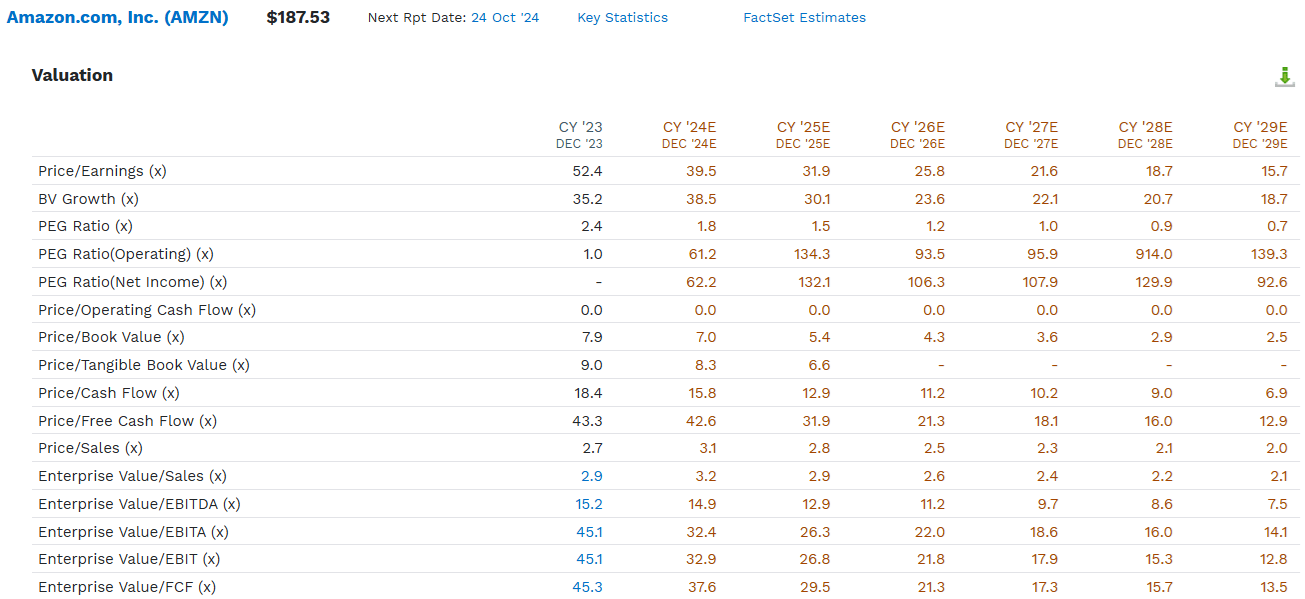
FactSet
Amazon is trading at 32X forward earnings, 13X forward cash flow, and 32X forward free cash flow.
When considering cash (enterprise value), we can see it’s trading at a cash-adjusted PE of 13 (0.5 PEG). The gold standard valuation metric? EV/FCF? 29.5X for a cash-adjusted PEG ratio of 1.1.
- 20-year average EV/FCF is 45.
- 20-year averaged cash-adjusted PEG 1.5.
In other words, Amazon is:
- 44% undervalued based on price/operating cash flow.
- 35% undervalued using the 20-year average EV/FCF.
- 27% undervalued using the 20-year cash-adjusted PEG ratio.
The chances of Amazon being overvalued right now are, statistically speaking, 9%.
Risk Profile: Why Amazon Isn’t Right For Everyone
Amazon has lots of fundamental risks to be aware of.
Market Position and Competition
Amazon must continually defend its leading position in online retail against increasing competition.
Traditional retailers are bolstering their online presence, and specialty retailers are leveraging physical showrooms to challenge Amazon’s supremacy.
The company’s estimated 36.7% market share in the fragmented online retail space as of 2023 is significant, but maintaining this edge requires ongoing investment and innovation.
Investment and Expansion Risks
To stay competitive, Amazon invests heavily in various areas, including:
- Content production for Prime Video
- Building its transportation network
- AWS (Amazon Web Services)
- Physical stores (Amazon-branded and Whole Foods)
- International expansion
These investments often require substantial capital allocation and management focus, potentially leading to periodic margin pressure.
Some investments, like the abandoned smartphone project, have failed in the past, raising concerns about the company’s ability to generate returns on these investments.
Regulatory and Legal Challenges
As Amazon expands globally, it faces increased exposure to different regulatory environments.
There’s growing scrutiny of large technology companies’ domestic and international market power. Key areas of concern include:
- Antitrust issues
- Data privacy regulations
- Section 230 of the Communications Decency Act
The company must navigate these complex legal landscapes while maintaining its growth trajectory.
Technological and Security Risks
As both a retailer and cloud service provider, Amazon faces significant risks related to:
- Data breaches
- Service outages
- Cybersecurity threats
The company holds personal information for hundreds of millions of consumers worldwide, and AWS hosts critical data for numerous enterprises.
Any major security incident could have severe reputational and financial consequences.
Supply Chain and Operational Risks
Amazon’s complex supply chain and stringent inventory management policies present ongoing challenges. The company must balance product availability with storage costs while managing relationships with suppliers and third-party sellers. Disruptions in the supply chain or failures in inventory management could significantly impact Amazon’s operations and customer satisfaction.
For example, the company must deal with other risks.
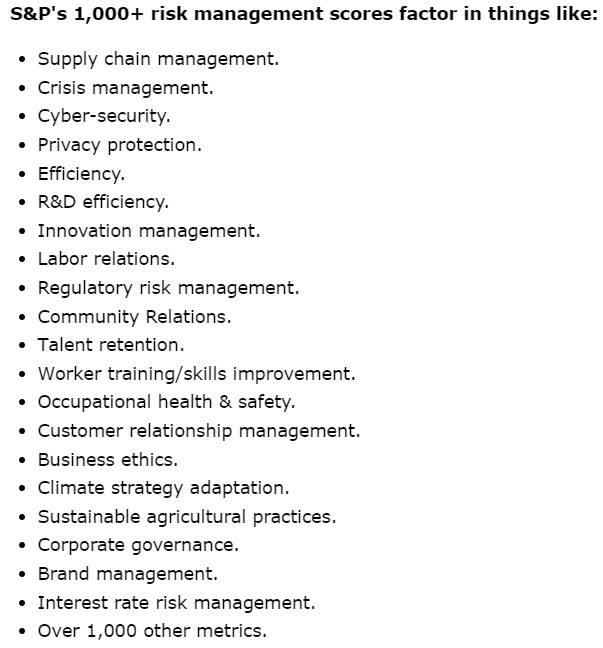
S&P
How does Amazon score on its complex risk profile, including antitrust regulatory threats, unionization drives, and retaining skilled workers in its fulfillment centers (high-pressure jobs)?
| S&P LT Risk Management Score | Rating |
| 0% to 9% | Very Poor |
| 10% to 19% | Poor |
| 20% to 29% | Suboptimal |
| 30% to 59% | Acceptable |
| 60% to 69% | Good |
| 70% to 79% | Very Good |
| 80+% | Exceptional |
| Amazon | 27.0% |
| Global Percentile | 50% (Top 50% of companies) |
(Source: S&P)
AMZN struggles with its supply chain and social impact, specifically with high center turnover. However, compared to the 13,000-plus companies S&P rates, it’s average at long-term risk management.
- Lots of room for improvement.
Volatility Profile: The Price You Pay For Those Life-Changing Returns And Income Growth
Since its IPO, Amazon turned $1,000 into $1.3 million, adjusted for inflation.
Yet to earn those life-changing returns and all that turbocharged income.
Portfolio Visualizer
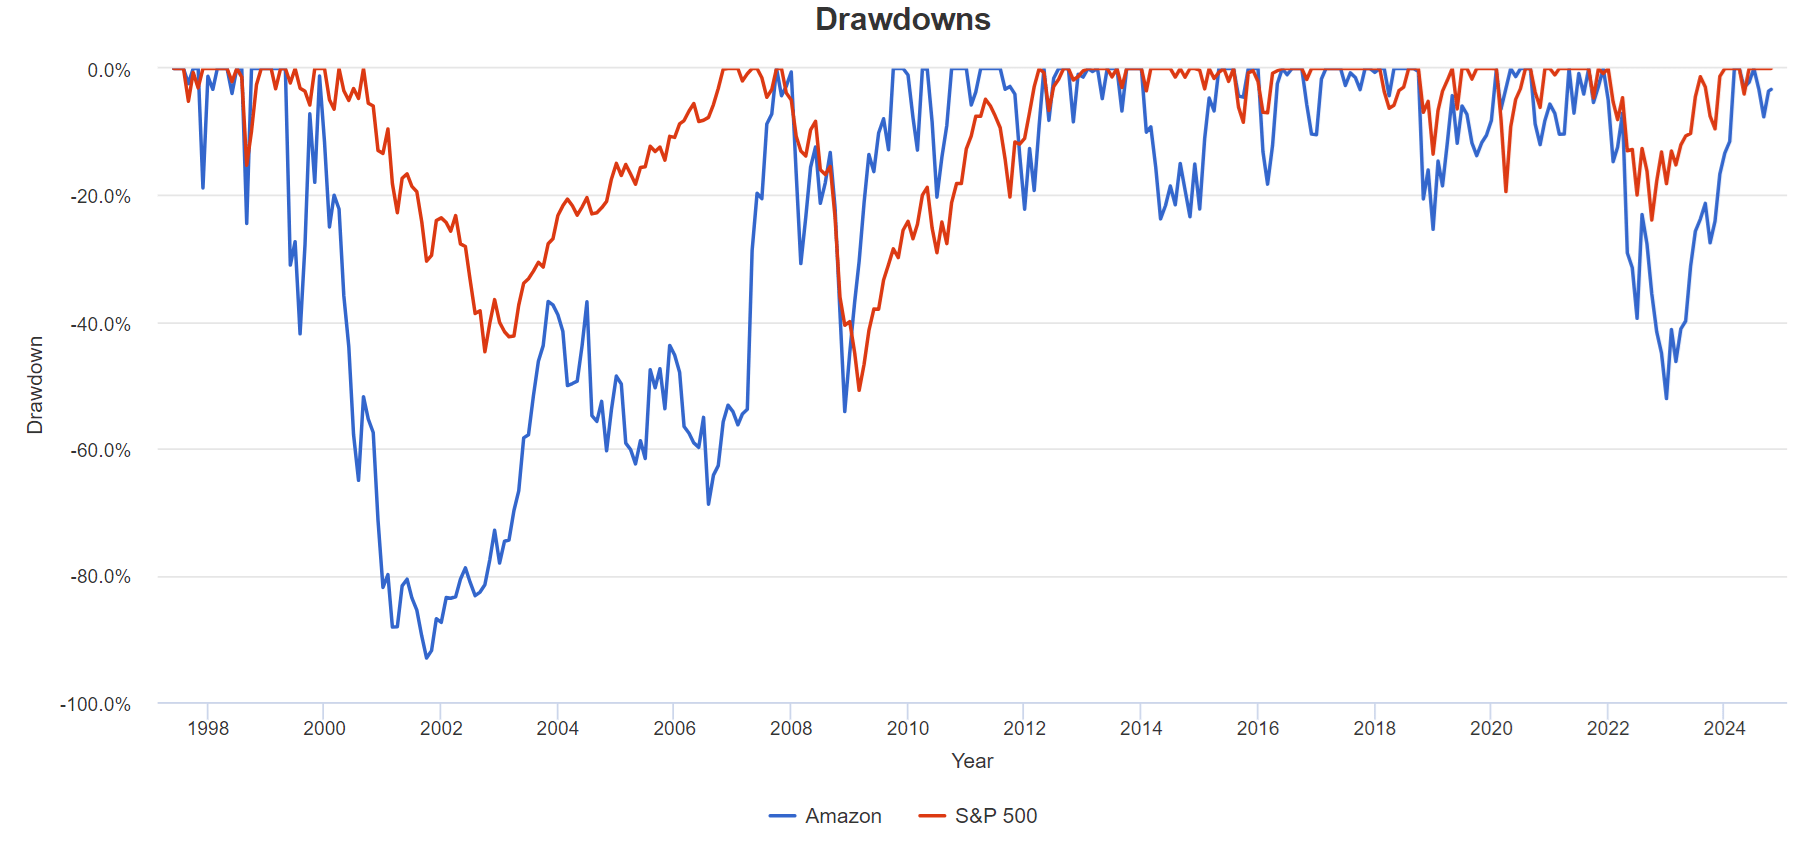
Just how bad have the bear markets been?

Portfolio Visualizer
Of course, Amazon is an individual company that can fall into bear markets when the S&P is not in one.
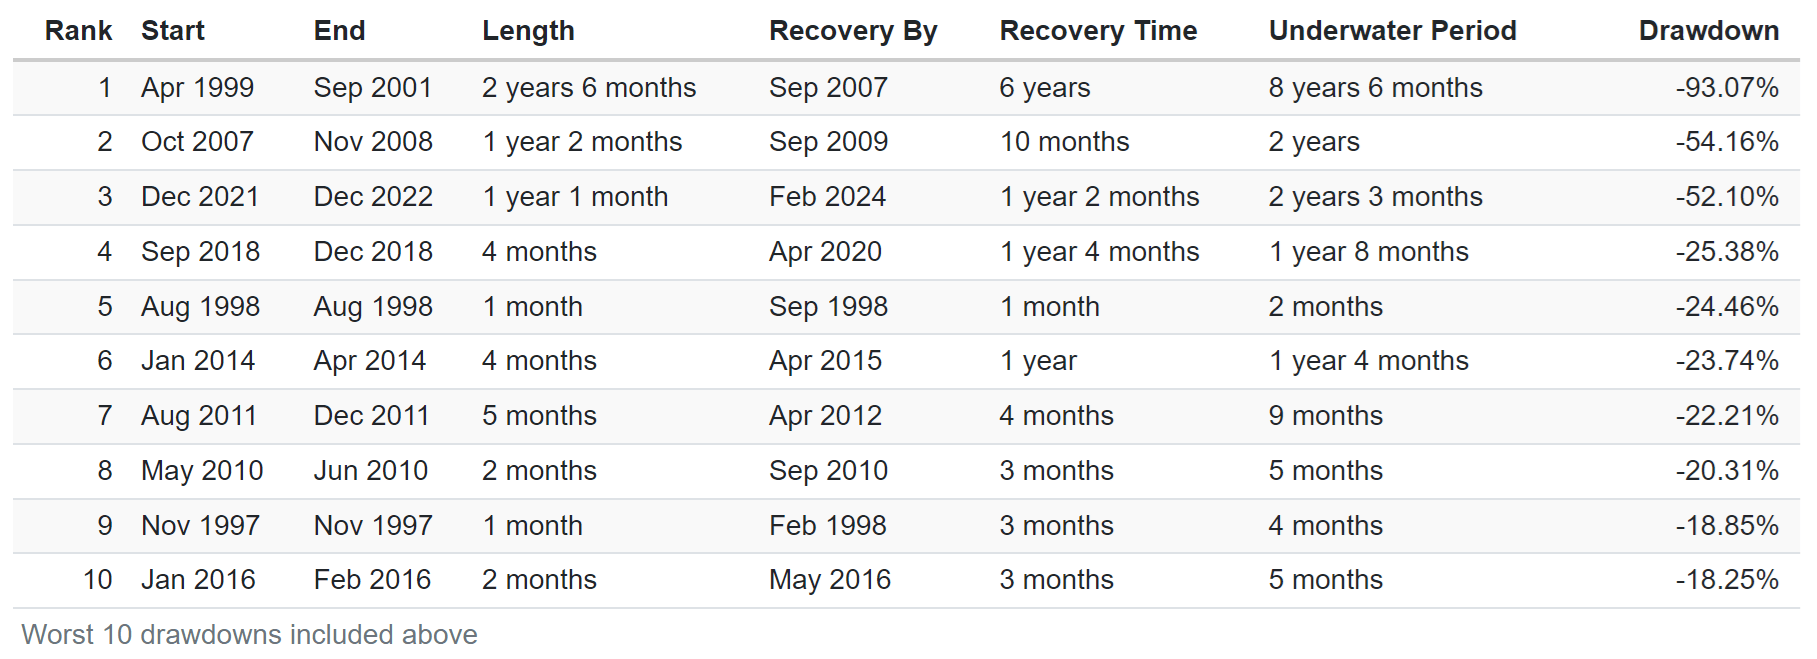
Portfolio Visualizer
These bear markets don’t quite highlight how intense AMZN’s volatility can be.
Portfolio Visualizer
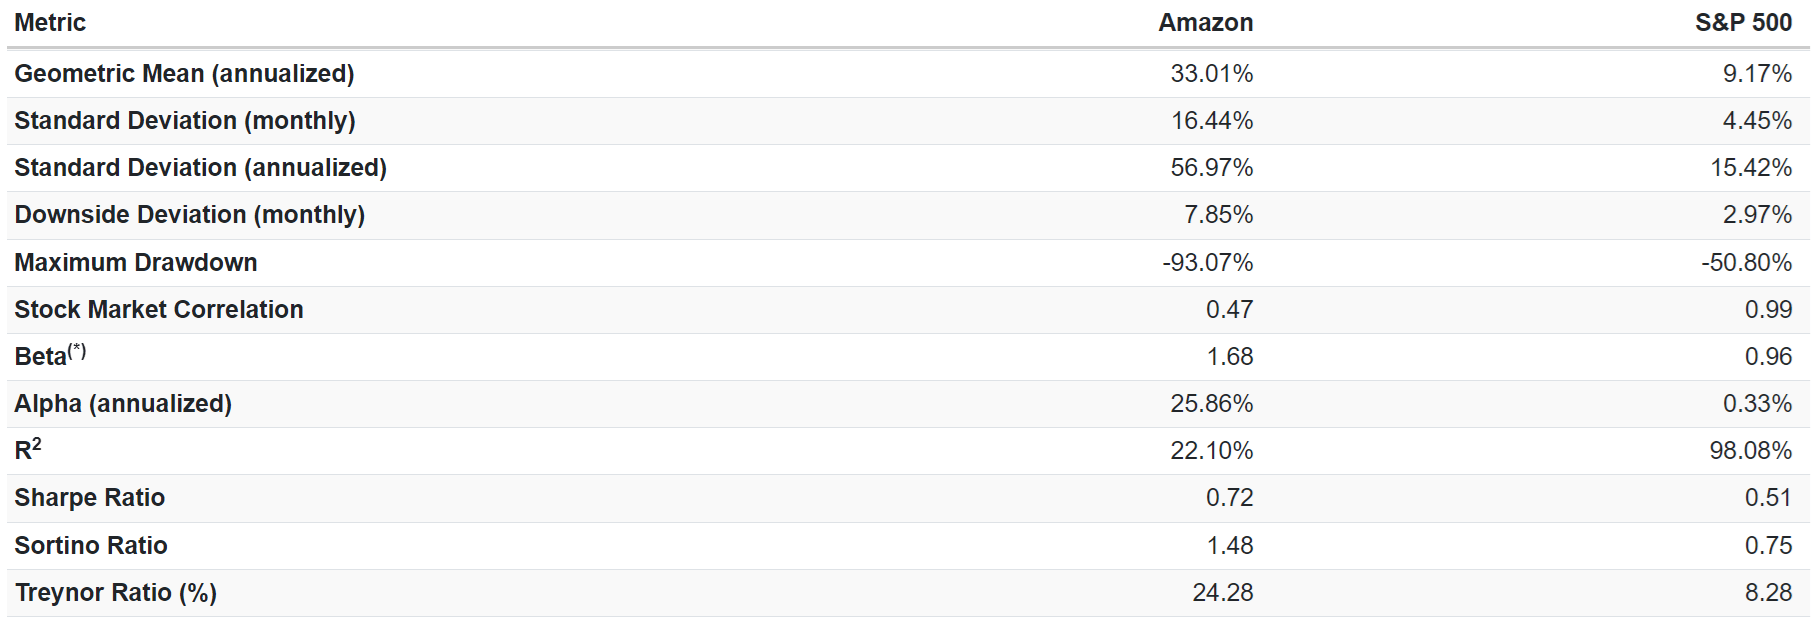
AMZN has 68% higher volatility than the S&P (1.68 beta), but it’s worth the volatility.
Per unit of volatility, AMZN’s excess returns (vs. risk-free cash) have been 24% (3X better Treynor ratio), and its negative volatility-adjusted returns (Sortino ratio) are 2X better than the S&P.
Portfolio Visualizer
The average 5% worst monthly returns (conditional value at risk) is 27%, 3X more than the S&P.
In a terrible month for stocks, 10% declines are expected.
In a terrible month for AMZN, expect 27% declines (or more).
A six-foot man can drown crossing a river that’s five feet deep on average.” – Howard Marks.
5 Worst Annual Returns Since 1998
| Year | AMZN Return | S&P Return |
| 2000 | -79.56% | -9.73% |
| 2022 | -49.62% | -18.17% |
| 2008 | -44.65% | -36.81% |
| 2001 | -30.47% | -11.76% |
| 2014 | -22.18% | 13.46% |
| Average | -45.30% | -12.60% |
| Median | -44.65% | -11.76% |
(Source: Portfolio Visualizer)
Bad years for Amazon are terrible, about 4X worse than the S&P.
And in 2014, the market was up a decent 13%, and Amazon fell 22%.
- Market envy risk = Fear of missing out (FOMO) risk.
5 Best Annual Returns Since 1998
| Year | AMZN Return | S&P Return |
| 1998 | 966.39% | 28.69% |
| 1997 | 234.72% | 15.31% |
| 2003 | 178.56% | 28.17% |
| 2009 | 162.32% | 26.37% |
| 2007 | 134.77% | 5.14% |
| Average | 335.35% | 20.74% |
| Median | 178.56% | 26.37% |
(Source: Portfolio Visualizer)
AMZN’s best years come after its worst (like 2003 post-2002, 2009 following 2008), and those gains are genuinely spectacular.
5% Worst Monthly Returns Since 1998
| Amazon | S&P 500 | ||
| Year | Month | Return | Return |
| 2001 | 2 | -41.16% | -9.54% |
| 2000 | 12 | -36.96% | -0.52% |
| 2001 | 9 | -33.22% | -8.16% |
| 2000 | 11 | -32.59% | -7.47% |
| 1999 | 5 | -30.98% | -2.29% |
| 2006 | 7 | -30.48% | 0.49% |
| 2004 | 7 | -28.46% | -3.22% |
| 2001 | 8 | -28.42% | -5.93% |
| 2008 | 11 | -25.40% | -6.96% |
| 2000 | 6 | -24.84% | 1.97% |
| 1998 | 8 | -24.46% | -14.12% |
| 2022 | 4 | -23.75% | -8.78% |
| 2008 | 10 | -21.33% | -16.52% |
| 2018 | 10 | -20.22% | -6.91% |
| 1999 | 7 | -20.03% | -3.10% |
| 2002 | 12 | -19.10% | -5.66% |
| Average | -27.59% | -6.05% | |
| Median | -26.91% | -6.42% |
(Source: Portfolio Visualizer)
A terrible month for Amazon can be as much as a 40% decline in weeks.
5% Best Monthly Returns Since 1998
| Amazon | S&P 500 | ||
| Year | Month | Return | Return |
| 1998 | 6 | 126.38% | 4.26% |
| 1997 | 9 | 85.52% | 4.81% |
| 1998 | 12 | 67.32% | 6.54% |
| 2001 | 11 | 62.18% | 7.80% |
| 1997 | 7 | 55.41% | 7.93% |
| 2001 | 4 | 54.25% | 7.04% |
| 2007 | 4 | 54.13% | 4.43% |
| 1998 | 11 | 51.85% | 5.57% |
| 2000 | 8 | 37.76% | 6.60% |
| 2005 | 7 | 36.45% | 3.83% |
| 1999 | 3 | 34.39% | 4.15% |
| 1998 | 9 | 33.28% | 6.36% |
| 2002 | 1 | 31.15% | -0.98% |
| 1998 | 2 | 30.51% | 6.93% |
| 1999 | 9 | 28.54% | -2.24% |
| 2009 | 10 | 27.26% | -1.92% |
| Average | 51.02% | 4.44% | |
| Median | 44.81% | 5.19% |
(Source: Portfolio Visualizer)
In its best months, AMZN outperformed the market by over 10X.
And those best months cluster around the worst months.
If you think you can time Amazon, you’re fooling yourself.
Amazon + Managed Futures Since 2010
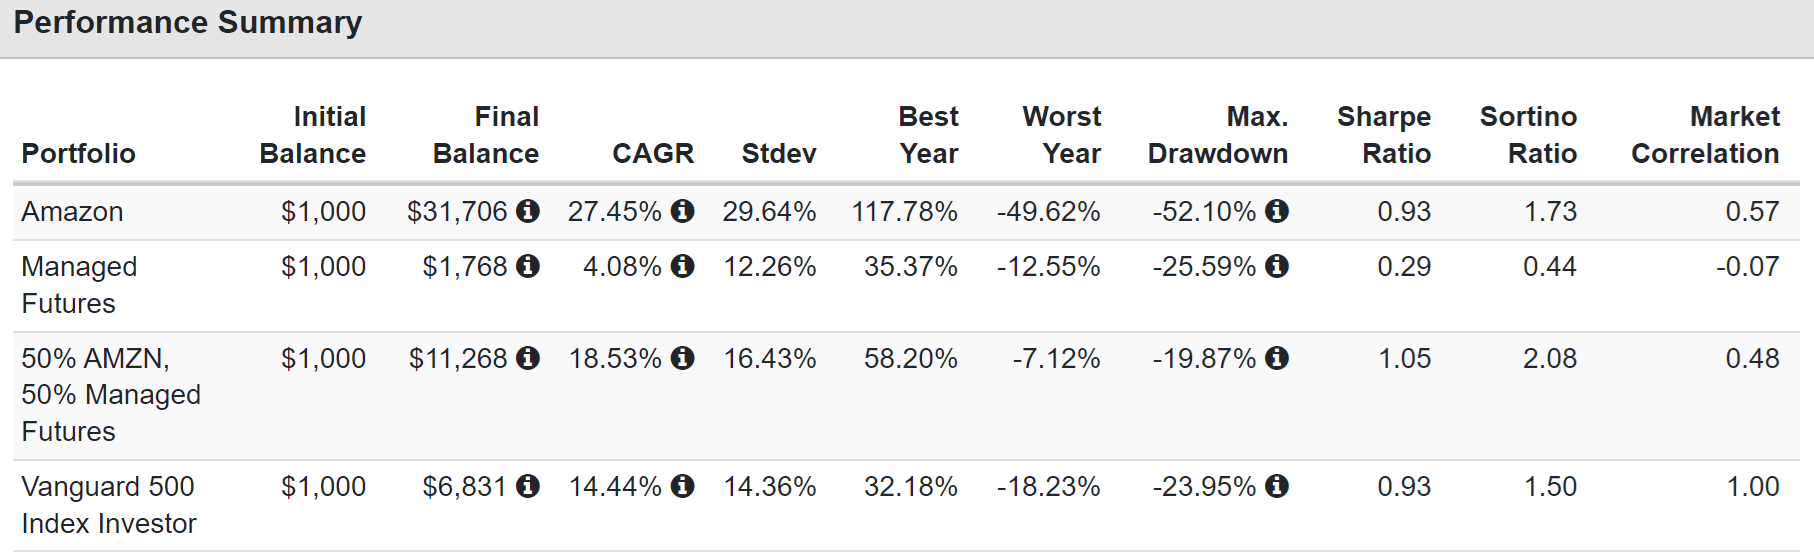
(Source: Portfolio Visualizer)
To control volatility, you should use inversely correlated assets like managed futures.
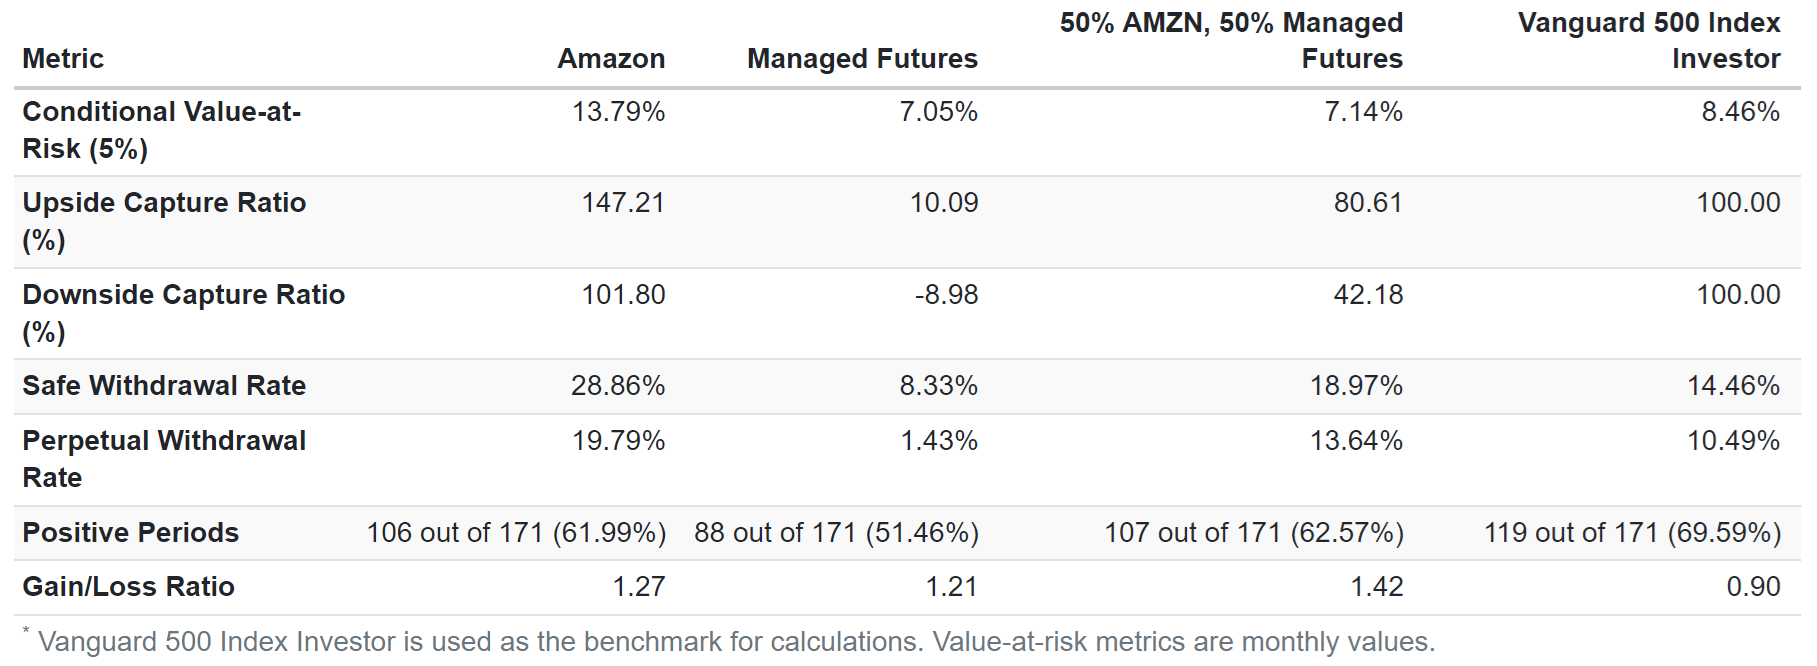
(Source: Portfolio Visualizer)
81% of the market’s upside with 42% of the downside, combining this legendary hyper-growth blue chip with the best hedging strategy of the last 50 years.
5% Worst Monthly Returns Since 2010
| Amazon | Managed Futures | 50% AMZN, 50% Managed Futures | Vanguard 500 Index Investor | ||
| Year | Month | Return | Return | Return | Return |
| 2022 | 4 | -23.75% | 10.00% | -5.29% | -8.73% |
| 2018 | 10 | -20.22% | -6.20% | -15.29% | -6.85% |
| 2016 | 1 | -13.15% | 5.88% | -3.63% | -4.98% |
| 2022 | 12 | -12.99% | -0.80% | -4.43% | -5.77% |
| 2022 | 6 | -11.65% | 6.60% | 0.04% | -8.27% |
| 2018 | 12 | -11.13% | 2.75% | -5.99% | -9.04% |
| 2022 | 9 | -10.86% | 8.62% | 1.63% | -9.22% |
| 2022 | 1 | -10.28% | 2.72% | -3.78% | -5.19% |
| Average | -14.25% | 3.70% | -4.59% | -7.26% | |
| Median | -12.32% | 4.32% | -4.11% | -7.56% |
(Source: Portfolio Visualizer)
5% Best Monthly Returns Since 2010
| Amazon | Managed Futures | 50% AMZN, 50% Managed Futures | Vanguard 500 Index Investor | ||
| Year | Month | Return | Return | Return | Return |
| 2022 | 7 | 27.06% | -5.67% | 4.72% | 9.21% |
| 2020 | 4 | 26.89% | -0.10% | 13.30% | 12.81% |
| 2010 | 9 | 25.82% | 4.55% | 15.20% | 8.92% |
| 2018 | 1 | 24.06% | 6.74% | 15.40% | 5.71% |
| 2015 | 7 | 23.51% | 2.64% | 14.82% | 2.08% |
| 2023 | 1 | 22.77% | -0.89% | 10.94% | 6.27% |
| 2015 | 10 | 22.27% | -1.29% | 13.27% | 8.42% |
| 2013 | 10 | 16.44% | 4.30% | 10.90% | 4.59% |
| Average | 23.60% | 1.29% | 12.32% | 7.25% | |
| Median | 23.79% | 1.27% | 13.29% | 7.35% |
(Source: Portfolio Visualizer)
In the best months, a 50% AMZN/50% managed futures combo almost doubles the market’s returns.
But with far smaller declines in the bad times (58% smaller)
Portfolio Visualizer
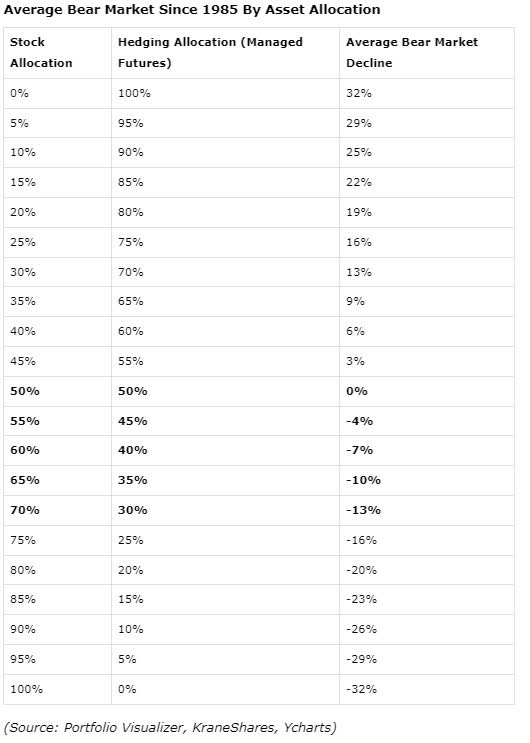
Using managed futures as a hedging asset can allow you to optimize your portfolio for whatever your personal emotional or financial (or both) risk profile is for bear markets.
In other words, you can target an average peak decline in bear markets for your portfolio.
If you can’t stand negative returns, you can be extra conservative and target an allocation with 25% to 40% stocks and 60% to 75% managed futures, which have historically delivered 6% to 16% positive gains during the average bear market since 1985.
- The average bear market of the last seven bear markets.
Bottom Line: Amazon is A Strong Buy Ahead Of Earnings, Especially for High-Yield Investors
Amazon is:
- 44% undervalued based on price/operating cash flow.
- 35% undervalued using the 20-year average EV/FCF.
- 27% undervalued using the 20-year cash-adjusted PEG ratio.
It’s a coiled spring growing like a weed and trading at a significant historical discount to its own objective market-determined fair value.
2-Year Fundamentally Justified Upside Potential: 127% vs 22% S&P.
FAST Graphs, FactSet
5-Year Consensus Return Potential: 265% (28% CAGR) vs 76% (12% CAGR) S&P.
FAST Graphs, FactSet
Its explosive return potential is justified by spectacular fundamentals. Let’s not forget that when combined with high-yield blue chips like BTI, ENB, or TD, it can turbocharge long-term income for retirees.
Why High-Yield Investors Should Consider Owning Hyper-Growth Blue-Chips
| Metric | High-Yield Blue-Chips (ENB, BTI, TD) | AMZN + High-Yield Blue-Chips | S&P 500 |
| Total Income | $4,982.45 | $57,469.42 | $1,500.33 |
| Inflation-Adjusted Income | $2,516.39 | $29,024.96 | $757.74 |
| Total Withdrawals | $7,014.53 | $147,898.24 | $1,930.60 |
| Inflation-Adjusted Total Withdrawals | $3,542.69 | $74,696.08 | $975.05 |
| Inflation-Adjusted Withdrawals Compared To High-Yield Blue-Chips Alone | 1.00 | 21.08 | 0.28 |
| Starting Yield | 5.07% | 2.54% | 2.54% |
| Yield On Cost | 37.0% | 864.9% | 12.9% |
| Inflation-Adjusted Yield On Cost | 18.67% | 436.81% | 6.50% |
| Income Growth | 9.3% | 26.0% | 7.8% |
| Total Return | 5.7% | 19.4% | 1.9% |
(Source: Portfolio Visualizer Premium) 6.5% annual withdrawal rate.
High-yield + hyper-growth over 25 years resulted in 21X higher inflation-adjusted income.
This is why my ZEUS family portfolio owns three hyper-growth Ultra SWANs combined with three high-yield Ultra SWANs.
A 4% yield today is excellent, but the spectacular future income (19% per year consensus) has me sleeping well at night.
Analyst’s Disclosure: I/we have a beneficial long position in the shares of AMZN, BTI, ENB either through stock ownership, options, or other derivatives. I wrote this article myself, and it expresses my own opinions. I am not receiving compensation for it (other than from Seeking Alpha). I have no business relationship with any company whose stock is mentioned in this article.
Seeking Alpha’s Disclosure: Past performance is no guarantee of future results. No recommendation or advice is being given as to whether any investment is suitable for a particular investor. Any views or opinions expressed above may not reflect those of Seeking Alpha as a whole. Seeking Alpha is not a licensed securities dealer, broker or US investment adviser or investment bank. Our analysts are third party authors that include both professional investors and individual investors who may not be licensed or certified by any institute or regulatory body.
—————————————————————————————-
 Dividend Kings helps you determine the best safe dividend stocks to buy via our Automated Investment Decision Tool, Zen Research Terminal, Daily Blue-Chip Deal Videos, and so much more!
Membership also includes
- Access to our 14 model portfolios
- my $3 million family hedge fund (real-time email updates on trades)
- 50% discount to iREIT (our REIT-focused sister service)
- real-time chatroom support
- numerous valuable investing tools
Click here for a two-week free trial so we can help you achieve better long-term total returns and your financial dreams.