Summary:
- Exxon Mobil’s recent bullish breakout was driven by strong Q2 results, with earnings of $2.14 per share and revenue of $93.06 billion.
- Despite YTD profit losses of -9%, Exxon saw a 15% quarterly gain in production, supported by record levels in the Permian and Guyana.
- Exxon’s forward P/E valuation is 14.89x, comparable to Chevron but higher than Shell and BP, suggesting room for growth.
- I maintain a “strong buy” rating, expecting new highs by year-end, bolstered by share buybacks, dividend payouts, and favorable upcoming earnings.
JHVEPhoto
When I last covered Exxon Mobil Corp. (NYSE:XOM) on May 7th, 2024 with ‘Exxon Mobil: Not Cheap, Still A Buying Opportunity‘, the stock was in the process of rallying quite strongly (posting gains of over 29.2% in less than four months). Of course, these bullish trend movements were quite forceful and possibly surprising to some investors and this would have been due to the fact that those rallies actually followed a long series of losses (totaling more than -20.65%) that had also developed over a period less than four months:
XOM: Two Way Price Action Sen During Early Parts of 2024 (Income Generator via TradingView)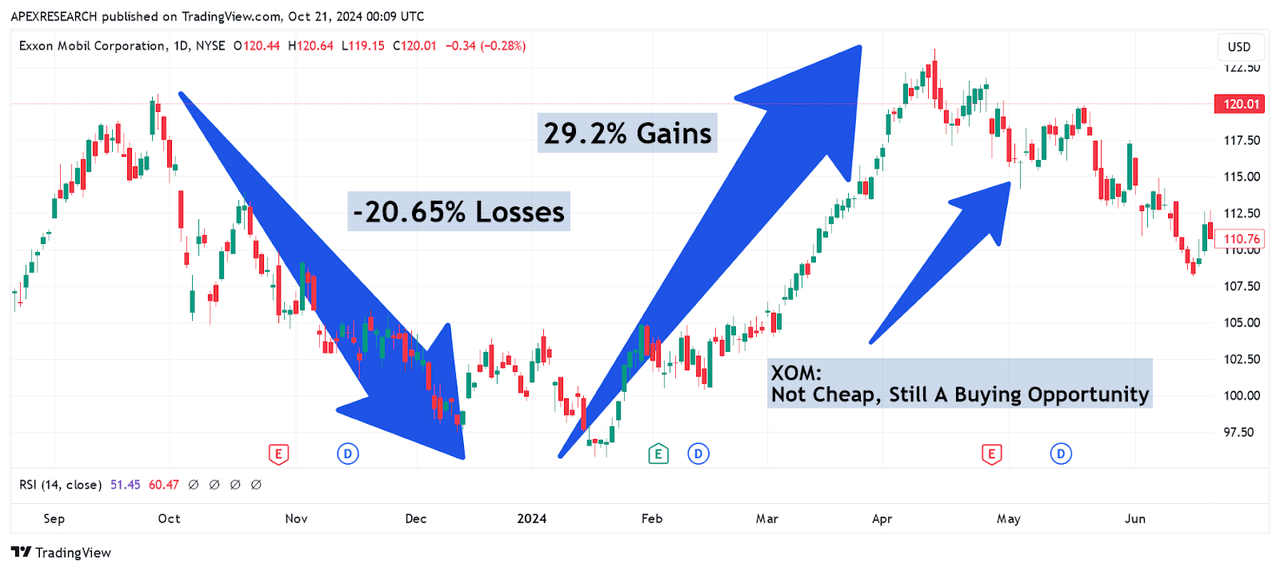
In prior articles, I have discussed the possibility that this type of two-way price movement can actually signify a period of indecision in the market because this type of seemingly directionless trading activity can pave the way for sideways ranges in the future. As we can see in the chart below, Exxon Mobil’s recent price behavior is an excellent example of this type of market phenomenon:
XOM: Sideways Trading Range Signifies Period of Indecision (Income Generator via TradingView)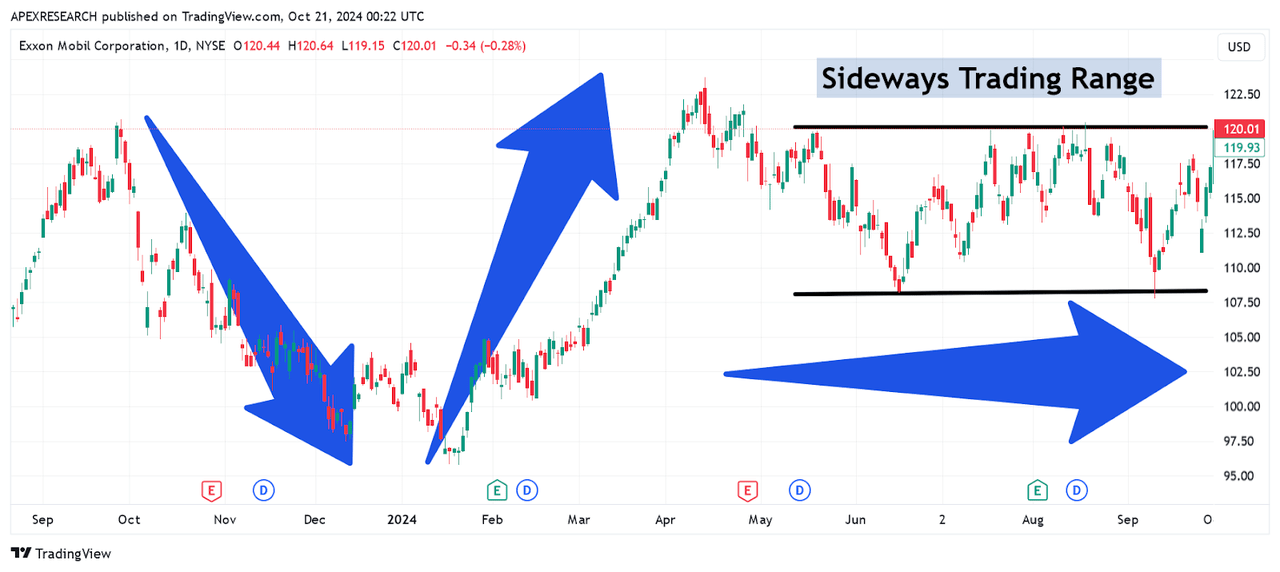
Ultimately, this sideways trading range lasted for nearly five months before breaking to the topside. The bullish breakout that occurred in early October was propelled in large part by strong second-quarter earnings results, which surpassed consensus estimates by a fairly wide margin and showed the highest oil production levels that have been seen at any point since the original Exxon / Mobil merger was finalized in 1999. For the period, the company recorded per-share earnings of $2.14 and this result soundly beat consensus estimates calling for $2.01 per share. On the revenue side, Exxon saw figures rise to $93.06 billion, and this was another substantial beat relative to the $90.99 billion that marked consensus estimates. Net income figures indicated annualized growth rates of 17% (at $9.2 billion) for the period.
Exxon Mobil: Quarterly Earnings Figures (Exxon Mobil: Q2 2024 Quarterly Earnings Presentation)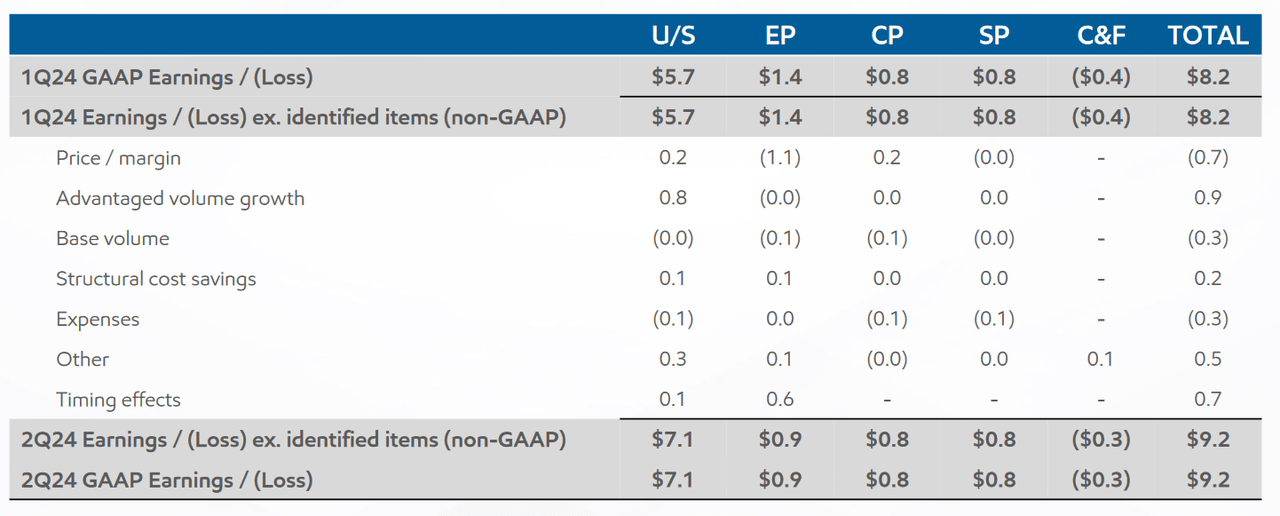
Overall, it appears to be quite clear that Exxon’s acquisition of Pioneer Natural Resources has had a dramatic impact on these positive results, contributing roughly $500 million to the quarterly earnings figure. On the negative side, YTD profit figures are showing losses of -9% (at $17.5 billion) relative to the prior-year figures, so it is also clear that weakened prices for natural gas and reduced margins for refining have had an obvious impact on Exxon’s results. All of that said, it must be understood that Exxon saw a 15% quarterly gain in production levels (at 4.4 million barrels daily) and these improvements were supported by record production levels that were achieved in the Permian and Guyana.
Exxon Mobil: Q2 2024 Quarterly Earnings Figures (Exxon Mobil: Q2 2024 Quarterly Earnings Presentation)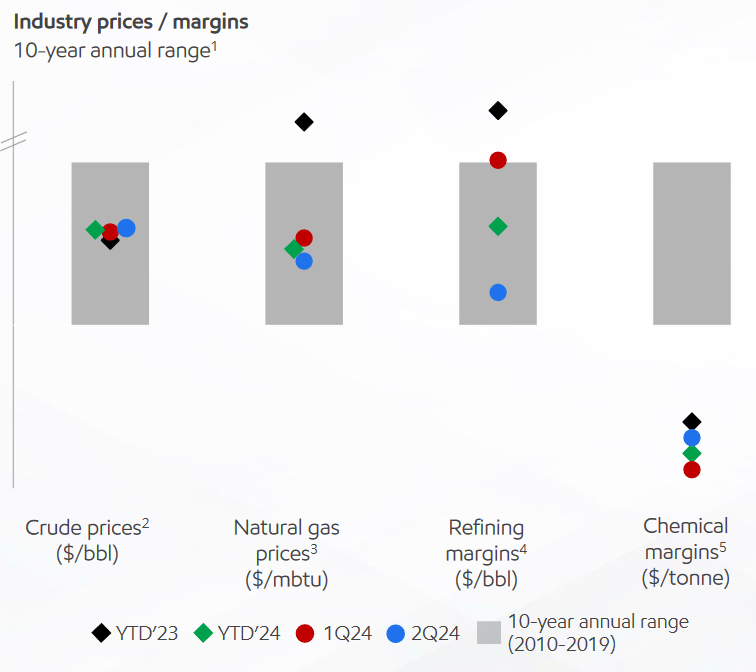
Given these strong results, investors must also draw important comparisons between XOM and alternative strategic plays within the energy markets. Currently, Exxon’s forward price-earnings valuation remains somewhat elevated (at 14.89x), which is roughly in-line with the market current valuation of Chevron Corp. (CVX) at 14.12x. Looking at the company’s industry peer group, there is really only one name that stands out to me as it trades at more expensive levels, and this would be Marathon Petroleum Corp. (MPC) at 17.42x. Alternatively, two oil companies that are trading at much more attractive levels right now can be found, with Shell plc (SHEL) at 8.42x and BP (BP) at 8.25x.
Exxon Mobil: Comparative Price to Earnings Valuations (YCharts)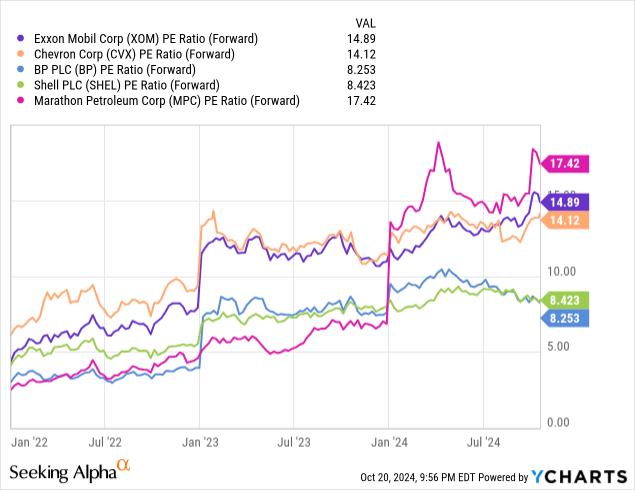
Similar trends can be seen when we view these companies in terms of their forward price-sales valuations. In this case, Exxon is trading with an elevated 1.51x valuation, while Chevron is trading a bit lower with a ratio of 1.39x. Again, the other energy companies in this group are trading at much cheaper valuations with Shell seen at 0.699x, BP at 0.42x and Marathon Petroleum seen at just 0.39x.
Exxon Mobil: Comparative Price to Sales Valuations (YCharts)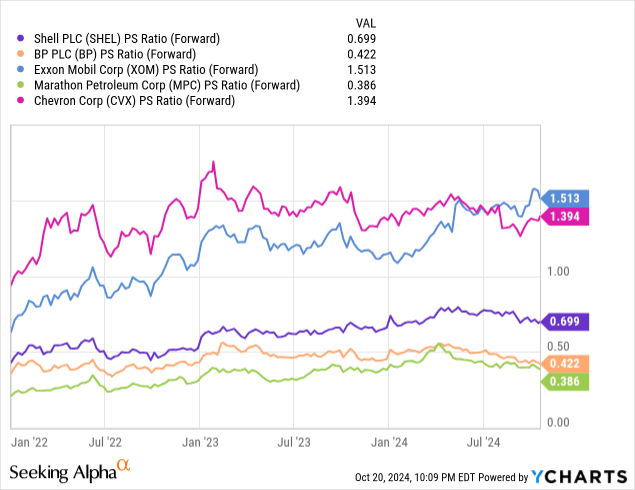
However, if we value these companies based on the price-book value metric, Exxon starts to look slightly more attractive (at 1.99x). Here, Marathon Petroleum is more expensively valued at 2.49x, but the other three companies in this grouping are still trading at lower valuations. Specifically, Chevron is currently trading at 1.72x, while British Petroleum is seen at 1.23x and Shell is seen at 1.11x. Overall, this is probably the individual metric that places XOM in its best light, but investors must remember that Exxon is trading at (or near) the top of this grouping for each of these valuation metrics, and it is clear that other energy companies are currently trading with lower valuations at the moment.
Exxon Mobil: Comparative Price to Book Valuations (YCharts)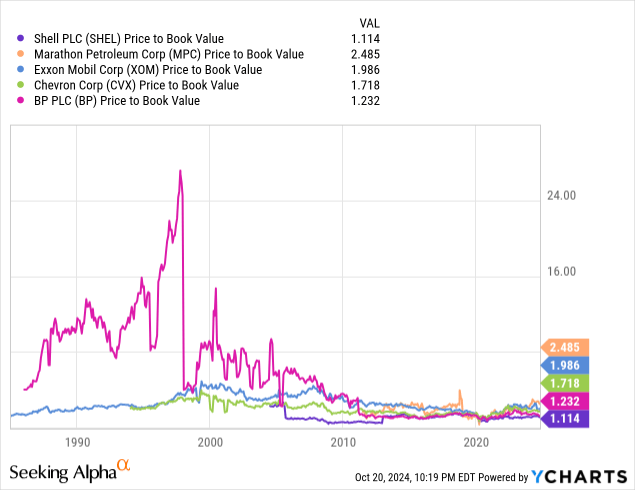
Looking at near-term activity in XOM share prices, we can see some very significant movement has occurred recently. Specifically, I am referring to the sideways trading range breakout that was seen during the October 2nd trading session (shown in the chart below). Ultimately, this trading activity signals an end to the period of indecision that has largely been in place since the end of April. This directional break shows momentum is finally moving in the positive direction, and I think some of this optimism is centered around the fact that Exxon now looks to be strongly positioned to continue outperforming consensus expectations.
XOM: Sideways Range Breakout Signifies Bullish Momentum (Income Generator via TradingView)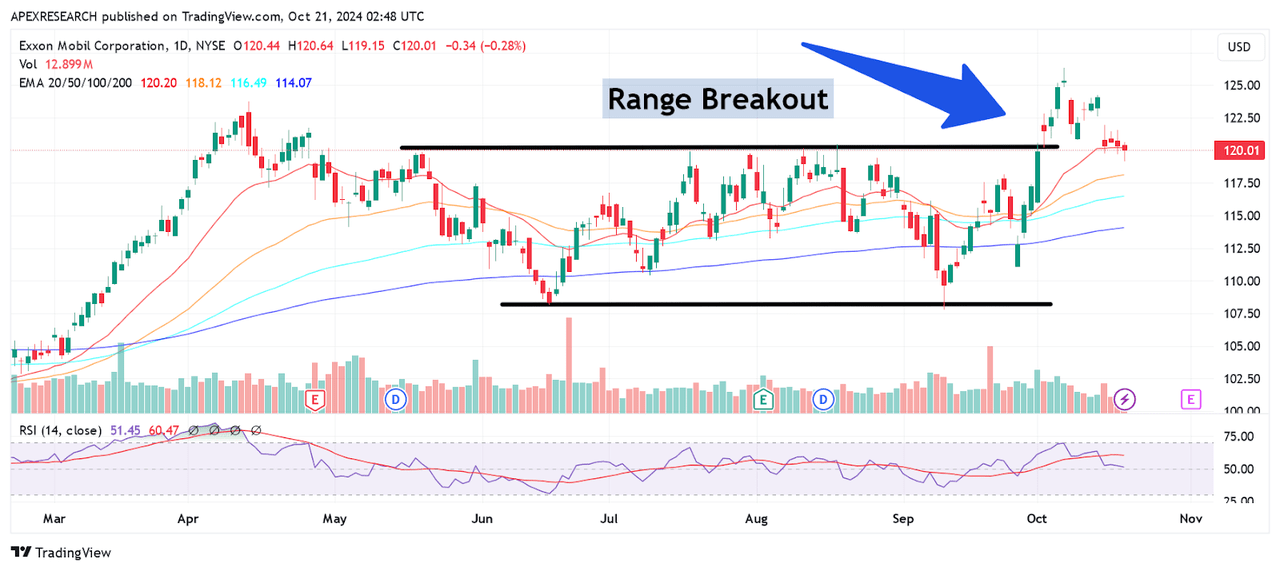
In order to downgrade from my current bullish outlook, I would need to see share prices break below $114.80 because this would suggest that the current wave of bullish momentum has completed. I am watching this area in particular because this region marks the 61.8% Fibonacci retracement of the ascending move from the September 11th, 2024 lows at $107.77 to the October 7th, 2024 highs at $126.34 – and this price region aligns closely with support zones created by the September 20th lows at $114.25.
XOM: Potential Downside Outlook Reversal Points (Income Generator via TradingView)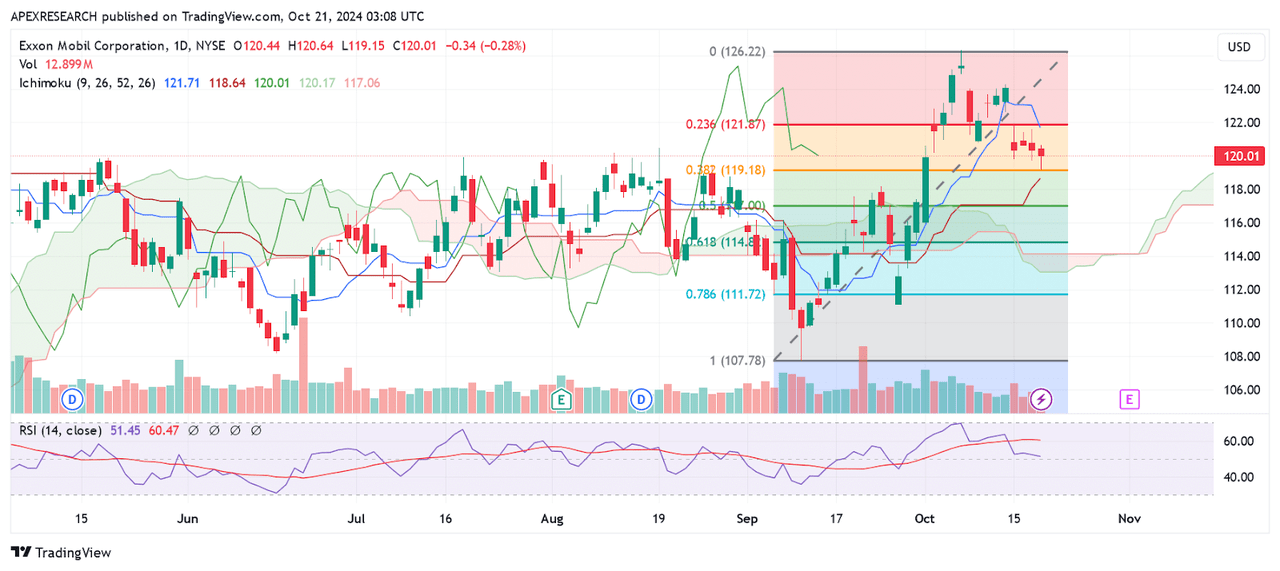
Ultimately, I would need to see share prices break below the stock’s major long-term support zone of $107.77 in order to reverse to a more bearish bias. I am focusing on this area as my reversal point because this region essentially defines the bottom of Exxon’s sideways trading range and a downward break through this area would then suggest that the bullish price move that was seen during the October 2nd trading session should actually be characterized as a false breakout. Currently, I am anticipating favorable results in Exxon’s upcoming earnings release due to the size of the earnings and revenue beats that were seen in the Q2 report and the clearly positive influences that the Pioneer acquisition is having on the company’s bottom line. Income investors should also be encouraged by Exxon’s recent share buybacks ($5.2 billion) and the $4.3 billion in dividend payouts that were just completed by the company. As a result of all of these factors, I will maintain my long position and raise my rating to a “strong buy” based on the expectation that I think the stock still has the potential to move to new highs before the end of this year.
Analyst’s Disclosure: I/we have a beneficial long position in the shares of XOM either through stock ownership, options, or other derivatives. I wrote this article myself, and it expresses my own opinions. I am not receiving compensation for it (other than from Seeking Alpha). I have no business relationship with any company whose stock is mentioned in this article.
Seeking Alpha’s Disclosure: Past performance is no guarantee of future results. No recommendation or advice is being given as to whether any investment is suitable for a particular investor. Any views or opinions expressed above may not reflect those of Seeking Alpha as a whole. Seeking Alpha is not a licensed securities dealer, broker or US investment adviser or investment bank. Our analysts are third party authors that include both professional investors and individual investors who may not be licensed or certified by any institute or regulatory body.
