Summary:
- Ford’s stock has experienced significant volatility, rallying 176% post-pandemic before reversing and losing 63.32% by August 2024.
- Despite earnings weaknesses, F’s auto revenues beat estimates, and management raised free cash flow guidance, supporting its attractive 7.17% dividend yield.
- Ford’s valuation metrics are historically low, with a forward price-sales ratio of 0.246x and a forward price-earnings ratio of 5.858x, suggesting potential upside.
- A double-bottom support zone near $9.50 and bullish RSI signals indicate favorable momentum, prompting a “strong buy” rating unless this support zone breaks.
Tramino
When I last covered Ford Motor Company (NYSE:F) long ago with “Ford: A Bullish Breakout Approaches” on December 4th, 2020, the stock was attempting to recover from the early pandemic lows of $3.96 that were seen in March 2020. At the time, the stock was approaching important resistance zones at $9.57 and, for many in the market, it was unclear if this would be the end of the recovery. In the article, my bullish thesis explained why an upside breakout was the most likely outcome for this classic dividend payer. As we can see in the chart below, this stock rating turned out to be incredibly accurate, with share prices rallying by more than 176% (not including dividends) over the next year:
Ford: Massive Bullish Breakout Follows Prior Buy Rating (Income Generator via Trading View)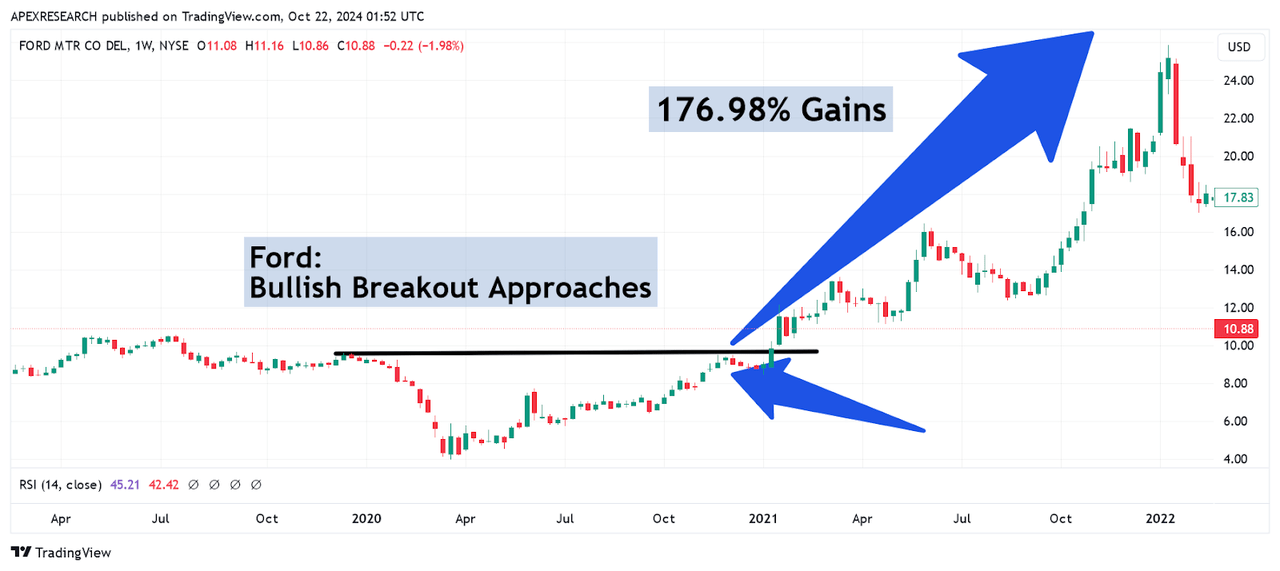
Undoubtedly, this was a tremendously accurate trading call – however, the story did not end there for bullish Ford investors. After reaching these incredible highs of $25.87 in January 2022, the stock encountered another massive reversal – this time, in the bearish direction. Rather than going through each of the declines that followed (and some of them were quite dramatic), we can simply look at the August 5th trough at $9.49 and see that the stock has now lost -63.32% over the next two years and seven months:
Ford: Later Losses Show Investor Struggles (Income Generator via Trading View)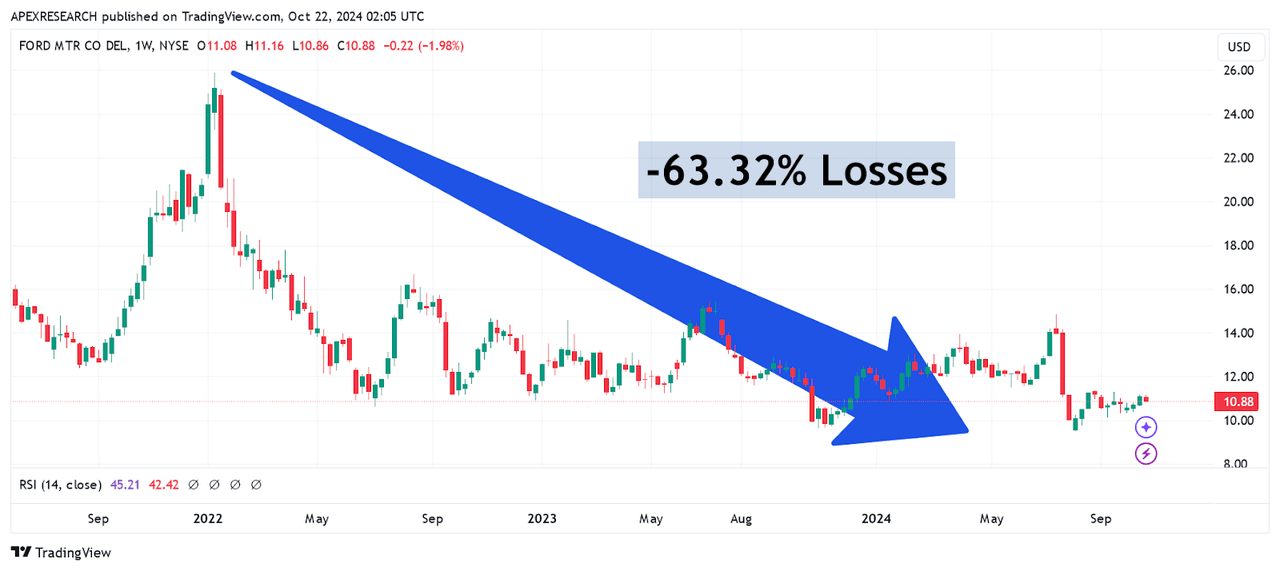
Of course, this has been quite a bumpy ride for Ford investors, but none of these events have occurred in a vacuum. During the second quarter period, reported adjusted earnings of $0.47 per share, and this fell far short of the consensus estimates of $0.68 per share. Fortunately, things were not quite as negative on the revenue side of the equation. Ford recorded auto revenues of $44.81 billion for the period, which did manage to beat consensus estimates of $44.02 billion. Weaknesses in earnings have been attributed in large part to persistent costs from warranty agreements for automobiles that were manufactured in 2021 or earlier, so it is also quite clear that these are issues that have remained in place for quite a while now.
Ford: Q2 2024 Earnings Figures (Ford: Q2 2024 Earnings Presentation)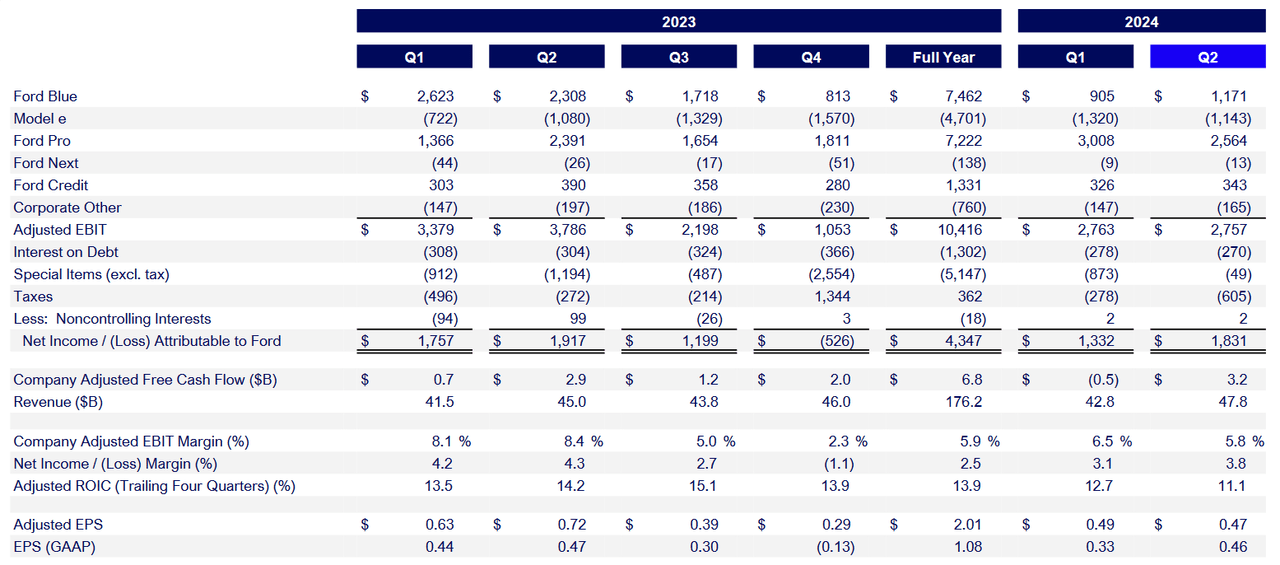
Ultimately, these disappointing weaknesses are weighing on full-year guidance figures (with EBIT now seen posting within a $10-12 billion range), and this is likely what has prevented an increase in earnings expectations for 2024 as a whole. Fortunately, management was able to raise its free cash flow guidance, and this does provide an additional measure of safety for investors that focus on the stock’s attractive dividend yield. However, EBIT figures (adjusted) did come in at $0.46 per share ($1.83 billion), which marks an annualized decline of 4.69% for the second quarter period.
Ford: Q2 2024 Earnings Figures (Ford: Q2 2024 Earnings Presentation)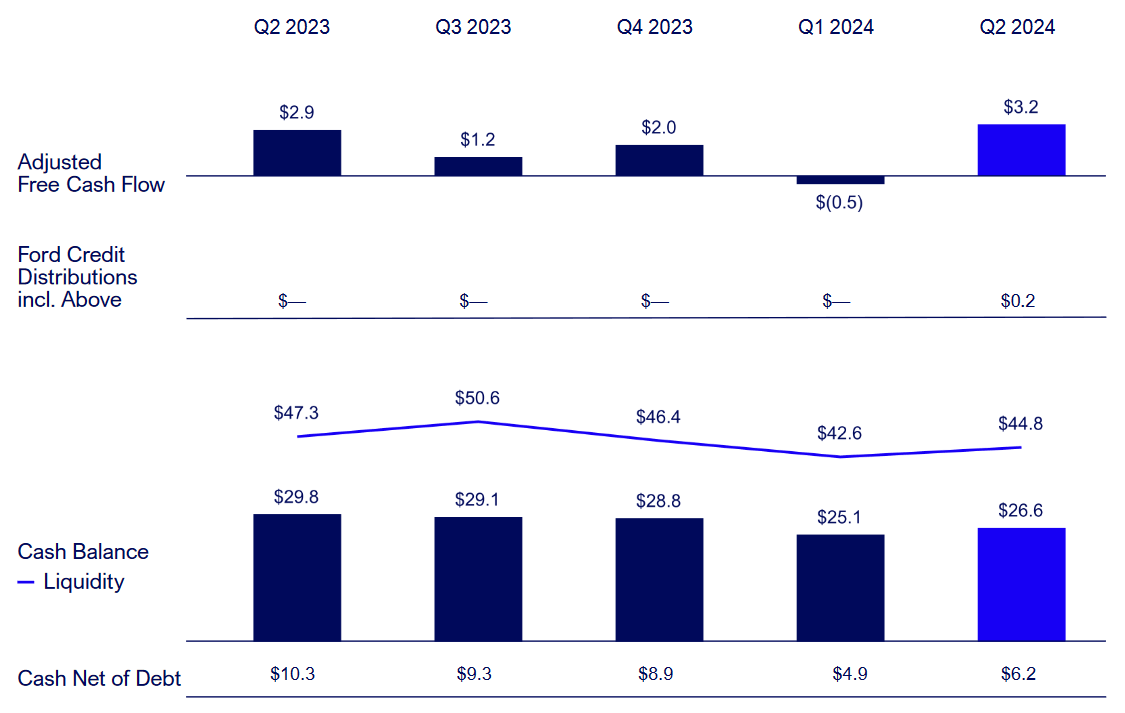
With all of this in mind, it seems obvious that the company is in recovery mode, and this is a process that is going to require investor patience. However, when we look at the company’s comparative valuation metrics, I think it also becomes clear that recent declines in share prices have reached a position that has become over-extended. First, we can look at Ford’s forward price-sales ratio, which currently stands at 0.246x, and we can see that this is firmly below competitor companies in the same industry group. At the moment, General Motors Company (GM) is trading at a slightly higher valuation (at 0.308x) and Honda Motor Company is also trading at a somewhat similar valuation (at 0.338x). At the upper end of this industry peer group, Toyota Motor Corp. (TM) is currently trading at 0.71x, and then Tesla, Inc. (TSLA) is trading at much more extreme forward price-sales valuations (at 6.986x).
Fored: Comparative Forward Price Valuation Metrics (YCharts)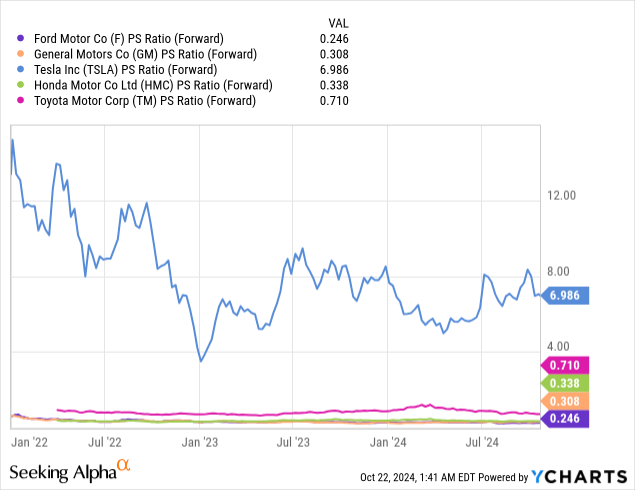
When looking at the relative price-book ratio for this industry peer group, the picture is slightly less favorable for Ford, with the stock currently trading at a 0.993x valuation. In this case, two companies in this cohort are currently trading are more attractive levels. Specifically, Honda is trading at 0.576x book value, while General Motors is also trading lower (at 0.801x). Once again, Toyota is trading at a more expensive valuation (at 1.002x) and Tesla is still significantly higher (at 10.52x). Based on this valuation assessment, Ford is currently holding near the middle of the group, which still suggests that the company is not overvalued at the moment.
Fored: Comparative Valuation Metrics (YCharts)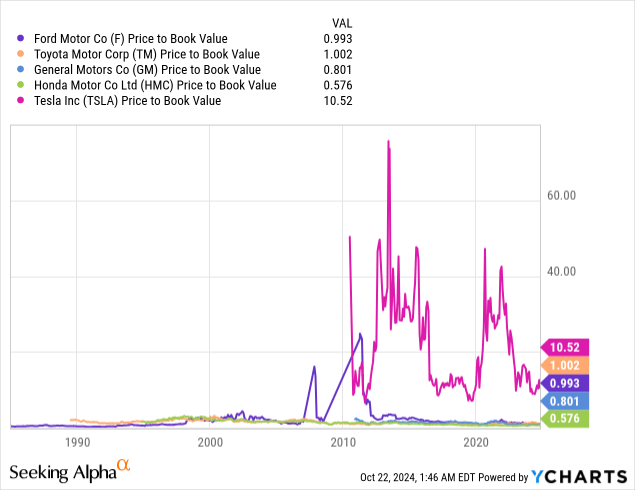
Ford’s historically low valuation metrics can also be seen in the company’s current forward price-earnings ratio (which now stands at just 5.858x. Of course, this is still slightly higher than General Motors (at just 5.145x). But when we compare these figures to a company like Tesla, which is truly trading out in the stratosphere right now (at an enormous 94.24x forward earnings), it quickly becomes obvious that Ford is flying under the radar and is simply not receiving the same type of attention in the market’s financial news headlines when compared to a MAG-7 stock like Tesla. In my view, this is quite surprising because we are also talking about a stock that has a massive 7.17% dividend yield, so I think there is a tremendous amount of upside available for people that are willing to take a chance on Ford stock.
Ford: Comparative Dividend Yield (Seeking Alpha)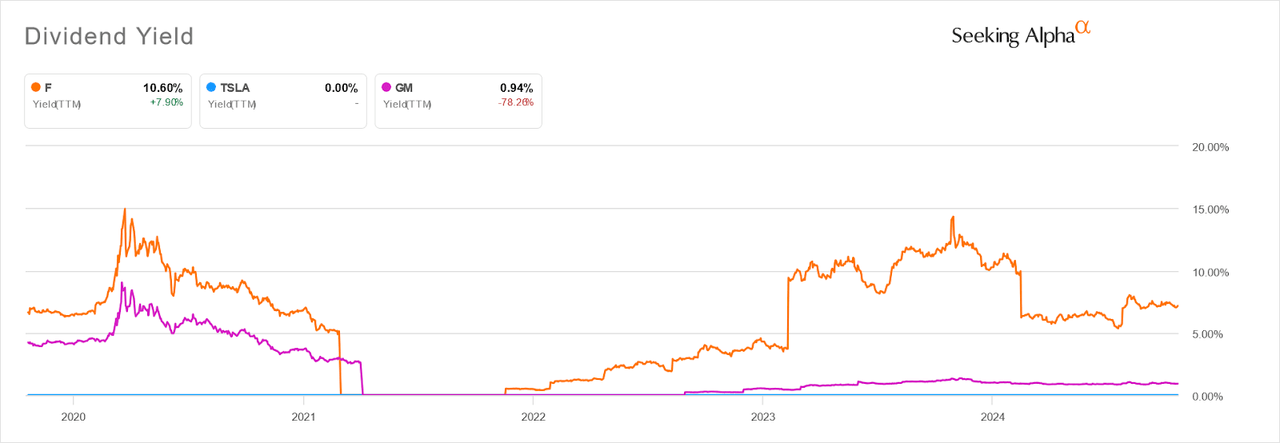
Of course, the real question at this stage is whether the stock can actually manage to find a sustainable and establish a reversal point in share prices. In my prior article, the bullish breakout point was starting to become apparent because the stock did find a sustainable low below $4 per share and the economic stocks of the early pandemic period were starting to stabilize in some ways. This time around, identifying similar price zones might not be quite as easy. However, what we can see is that Ford stock is now showing a double-bottom support zone near $9.50 per share. Essentially, this price region was formed by the historical lows from October 30th, 2023, and August 5th, 2024. As share prices have started to show some evidence of being able to bounce from this area, we can also see that indicator readings in the relative strength index have developed bullish signals as well. Specifically, the relative strength index (on the weekly time frame) has crossed above its own exponential moving average (which is typically referred to as a bullish crossover). Overall, this suggests that momentum readings for this stock remain favorable at current levels and these are signals that have developed on the longer-term time frames (which are typically viewed as being more stable and more reliable than shorter-term time frames).
Ford: Important Price Support Zones Develops (Income Generator via Trading View)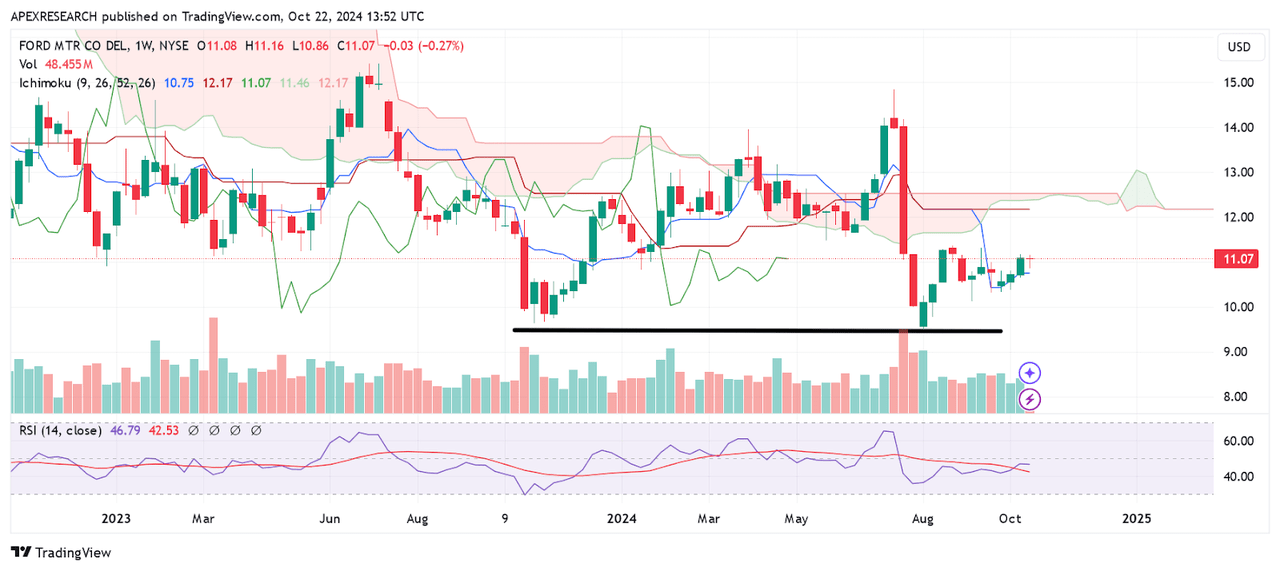
In order for me to reconsider my bullish stance on this stock, I would need to see this important support zone at $9.50 break to the downside because this would then suggest that the stock is continuing with its prior downward trend (defined by a continued series of lower lows). Until (or unless) this occurs, I will be looking to capitalize on this stock’s favorable comparative valuations and excellent 7.17% dividend yield. With this in mind, I will also be raising my rating outlook to a “strong buy” due to the fact that I think this stock still remains relatively overlooked by the broader market.
Analyst’s Disclosure: I/we have a beneficial long position in the shares of F either through stock ownership, options, or other derivatives. I wrote this article myself, and it expresses my own opinions. I am not receiving compensation for it (other than from Seeking Alpha). I have no business relationship with any company whose stock is mentioned in this article.
Seeking Alpha’s Disclosure: Past performance is no guarantee of future results. No recommendation or advice is being given as to whether any investment is suitable for a particular investor. Any views or opinions expressed above may not reflect those of Seeking Alpha as a whole. Seeking Alpha is not a licensed securities dealer, broker or US investment adviser or investment bank. Our analysts are third party authors that include both professional investors and individual investors who may not be licensed or certified by any institute or regulatory body.
