Summary:
- General Motors has seen a 49% YTD gain, outperforming the S&P 500, driven by strong earnings and revenue growth, and raised 2024 guidance.
- GM’s adjusted EPS of $2.96 beat estimates by 21.81%, and revenue of $48.8 billion surpassed expectations by 9.35%, prompting upward revisions in EBIT and cash flow guidance.
- Despite challenges in China, GM’s North American segment showed robust EBIT growth and profit margins, supporting the bullish outlook.
- GM’s attractive valuation metrics, including a forward PE ratio of 5.388x, suggest further upside potential, with a downside pivot point set at $44.20.
jetcityimage
On many fronts, General Motors Company (NYSE:GM) has reached a critical turning point in 2024. On a YTD basis, the stock has seen tremendous gains of over 49% even while the S&P 500 is currently lagging far behind (with gains of just 23.37%). Most of this bullish price activity has been propelled by improved operational performances that have enabled GM to raise its 2024 earnings on multiple occasions. But, for investors that are currently long this stock, critical questions still remain. Has the stock run too far? Is it time to take gains and look at other alternatives within the automotive industry? Of course, given the extent of the GM’s share price rallies this year, it should be said that these are perfectly reasonable questions to be asking. However, I think the company’s most recent performance results have provided investors with enough information to show that the turnaround story is real and that the stock is still capable of making new highs before the end of this year. As a result, I will explain the reasons behind my “buy” rating and my decision to maintain my GM long position even while the stock is trading at these elevated levels.
GM: Strong YTD Performances (Income Generator via TradingView)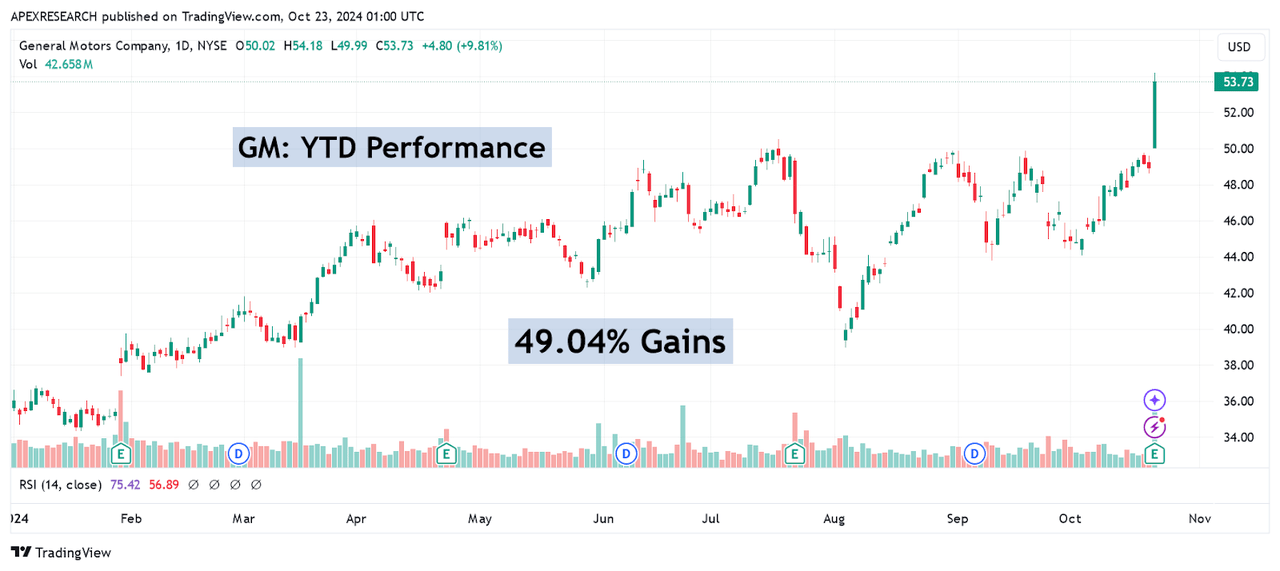
For the third quarter period, General Motors surpassed consensus earnings expectations by a wide margin, with adjusted EPS coming in at $2.96 and this figure beat the $2.43 consensus estimates by more than 21.81%. Of course, this figure also indicates massive EPS growth of 29.82%. GM’s revenue figures were also quite impressive, coming in at $48.8 billion and surpassing the $44.6 billion consensus estimates by more than 9.35%. Not surprisingly, these excellent quarterly performances have made it much easier for the company to raise its full-year 2024 guidance outlook (which is something we have already seen two previous times this year).
General Motors: Q3 2024 Earnings Figures (General Motors: Q3 2024 Earnings Presentation)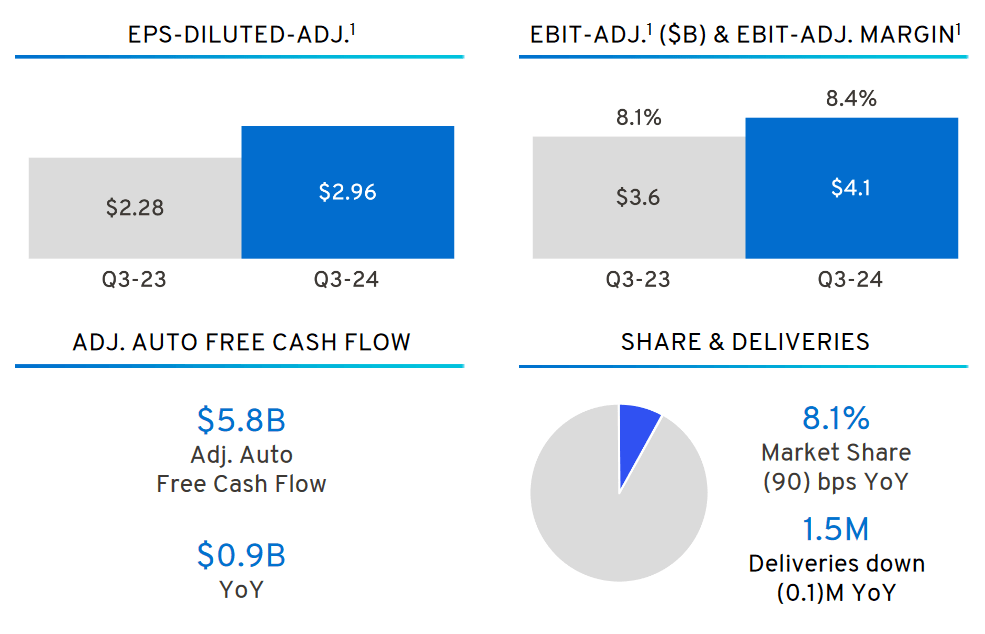
As a result of all of these gains in underlying growth, GM has now raised its EBIT guidance (adjusted) for 2024 to a $14-15 billion range (which comes out to $10-10.50 per share). Similar positive revisions were made with free cash flow guidance figures from the automotive segment, which are now expected to post within a $12.5-13.5 billion range, which now marks a sizable improvement from the $9.5-11.5 billion range seen previously. Additionally, ranges for net income guidance constricted from $10-11.4 billion ($8.93-9.93 per share) to $10.4-11.1 billion ($9.14-9.64 per share).
General Motors: Q3 2024 Earnings Figures (General Motors: Q3 2024 Earnings Presentation)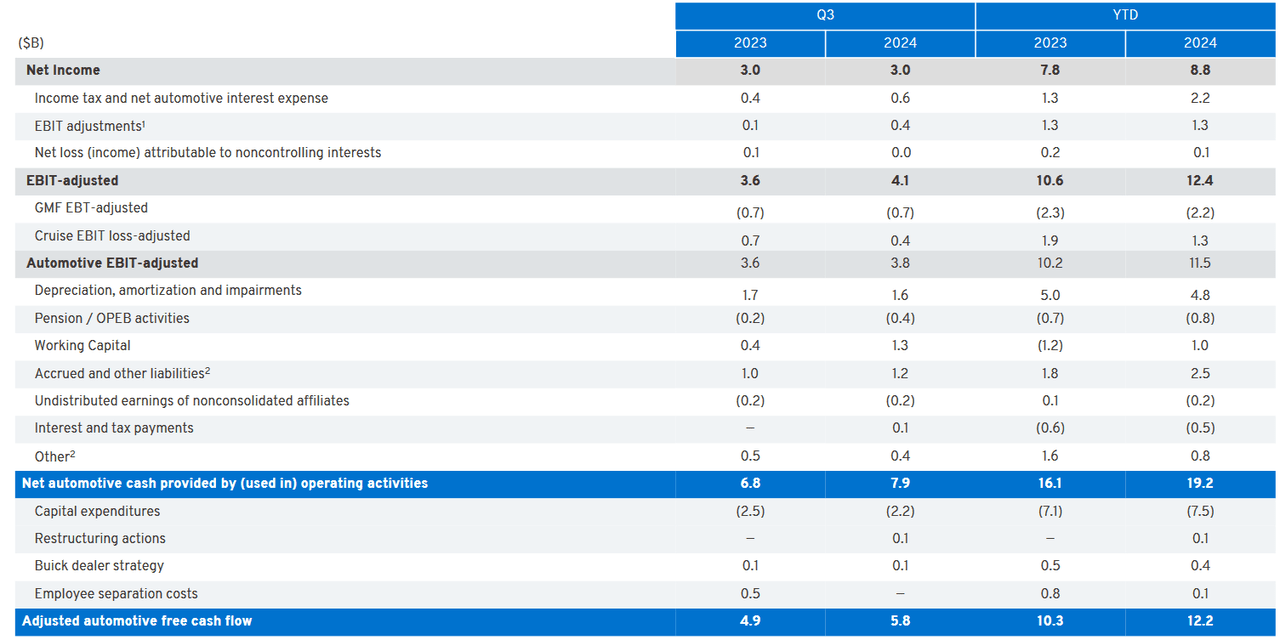
Key geographical areas of strength were found in GM’s North American segment, which generated 12.9% gains in annualized EBIT growth (just under $4 billion) with profit margins (adjusted) coming in at 9.7%. In contrast, quarterly figures in China were quite different (with losses of -$137 million seen during the period) and the company’s international segment saw annualized earnings declines (adjusted) of 88.2%. Of course, GM is still in the process of conducting major operational restructuring in China, and this type of weak performance in the region was largely expected.
General Motors: Q3 2024 Earnings Figures (General Motors: Q3 2024 Earnings Presentation)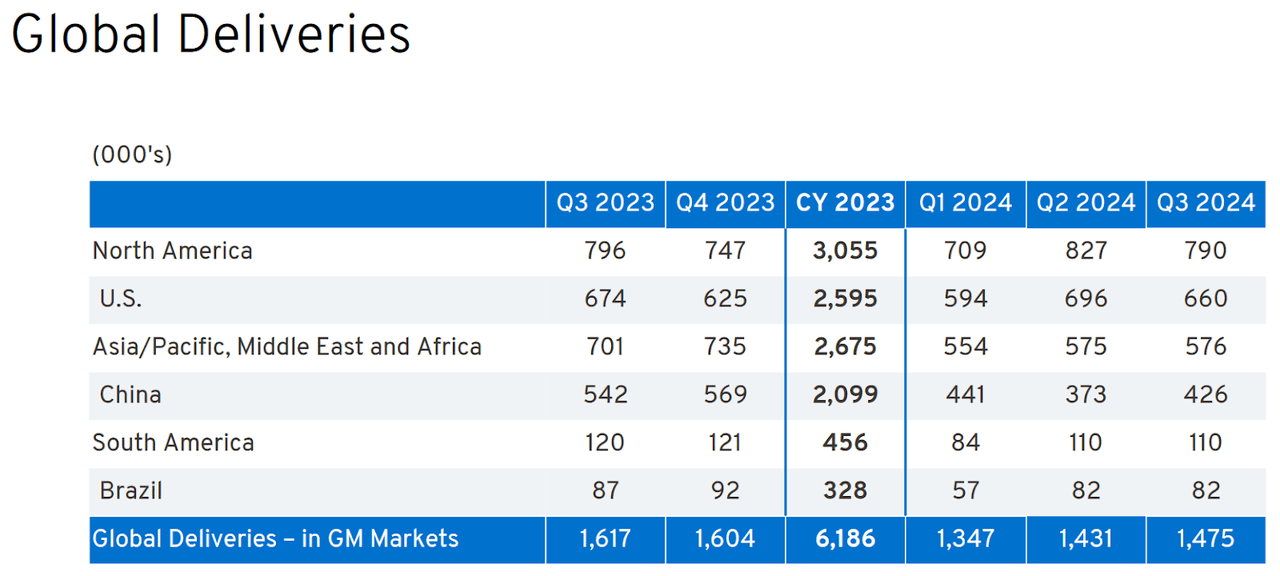
From a comparative valuation perspective, General Motors is trading with a very attractive forward PE ratio of just 5.388x and this is even lower than another undervalued industry competitor in Ford Motor Company (F), which currently trades at 5.949x forward earnings. Of course, both of these classic automobile stocks are trading far below the lofty valuations commanded by Tesla, Inc. (TSLA) at 94.52x.
GM: Comparative Price to Earnings Valuations (YCharts)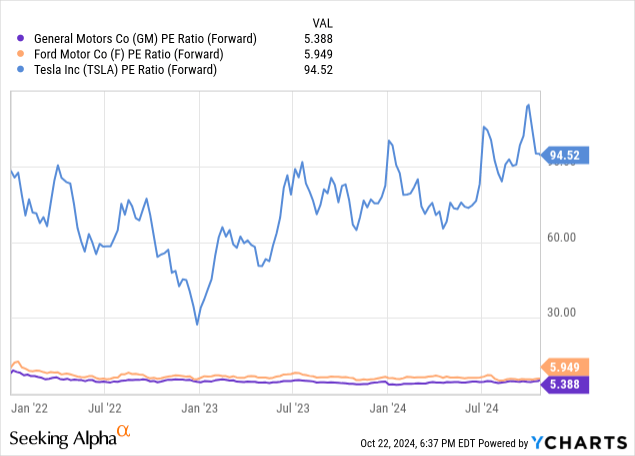
Overall, this picture does not change very much if we are assessing GM’s comparative valuation based on forward price-sales metrics. In this case, there are only two major industry competitors in this group that are trading at levels that are cheaper than General Motors (with a forward PS figure of 0.339x). Interestingly, these alternatives would be Ford (at 0.252x) and Honda Motor Co. (HMC) at 0.337x – and I have recently covered these particular aspects of Ford in a more in-depth way in my article “Ford: It’s Time To Buy, Again”. However, we can also see that Toyota Motor Corporation (TM) is much more expensive at 0.713x and Tesla, once again, is trading at significantly higher valuations with a 6.958x forward price-sales ratio.
GM: Comparative Price to Sales Valuations (YCharts)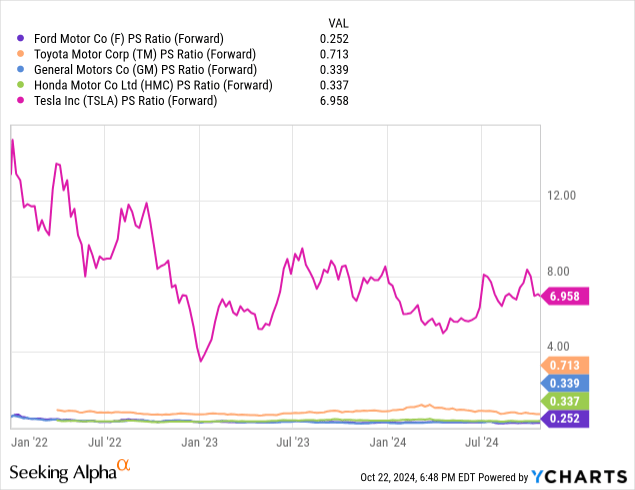
Last, General Motors’ price-book value ratio (0.88x) also places the company within the bottom half of this industry grouping. Based on this metric, the only other company with a lower valuation is Honda Motors at 0.575x. At the same time, Toyota (at 1.006x), Ford (at 1.015), and Tesla (which is still extremely elevated at 10.47x) are all trading with higher price-book valuations at the moment. As a result, we can see that General Motors remains attractively valued compared to the industry peer group, even when using a broad set of valuation metrics.
GM: Comparative Price to Book Valuations (YCharts)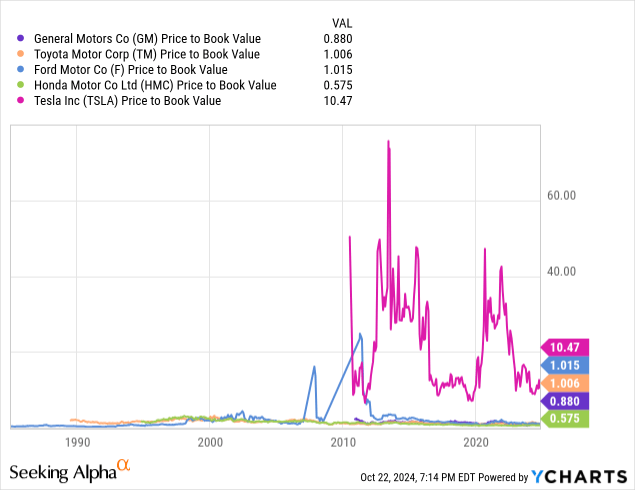
Given all of these factors, it seems clear that General Motors is currently in a strong position for outperformance within its industry group. However, similarly positive assessments can be made when we analyze the stock’s own price history. For example, GM’s recent rallies higher have actually sent share prices through an important double-top resistance zone on the longer-term time frames. In the weekly price chart below, we can see that this resistance region was formed by the stock’s price highs from July 15th, 2024 (at $50.50) and the stock’s August 26th, 2024 highs at $49.86. Of course, these price zones do not align perfectly. However, when we are dealing with these types of long-term time frames (such as the weekly charts), I will generally give 2% leeway when price patterns fail to align with exact measurements.
GM: Major Support and Resistance Levels (Income Generator via TradingView)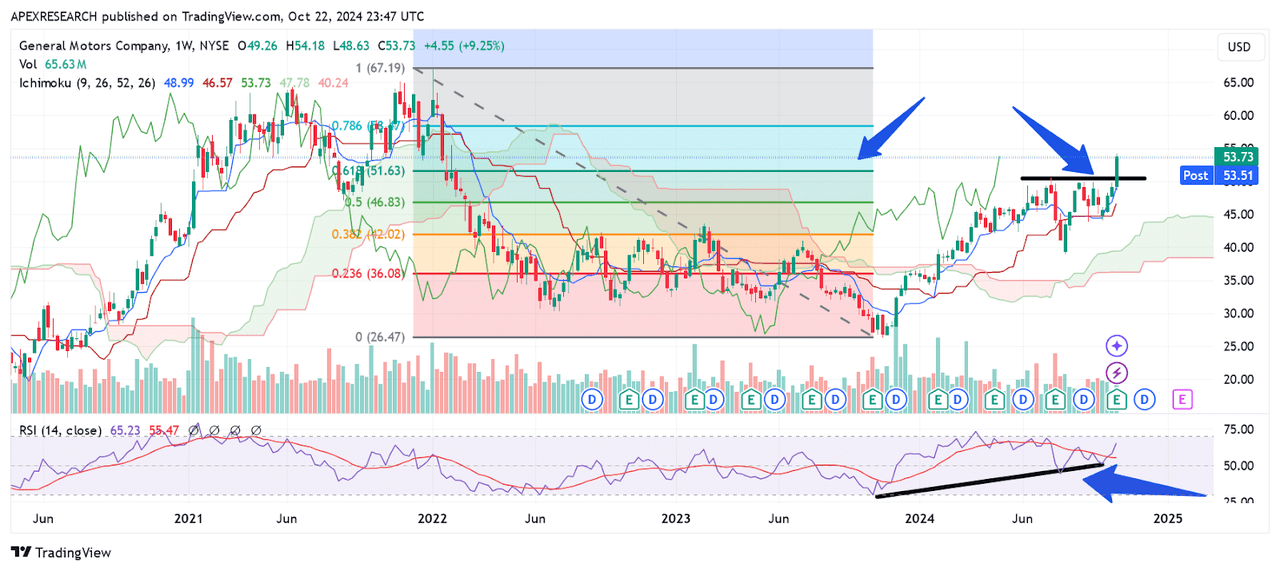
Additionally, this price region coincides with the 61.8% Fibonacci retracement of the stock’s decline from the January 2022 highs of $67.21 to the November 2023 price lows of $26.30 (which is located near $51.60. During the recent bull rallies, GM shares broke through both of these levels and posted new near-term highs at $54.18. Going forward, indicator readings in the relative strength index are currently showing positive momentum signals, but have not yet reached overbought levels. Ultimately, this suggests that the stock still has further room to move to the topside without becoming over-extended.
GM: Bearish Reversal Pivot (Income Generator via TradingView)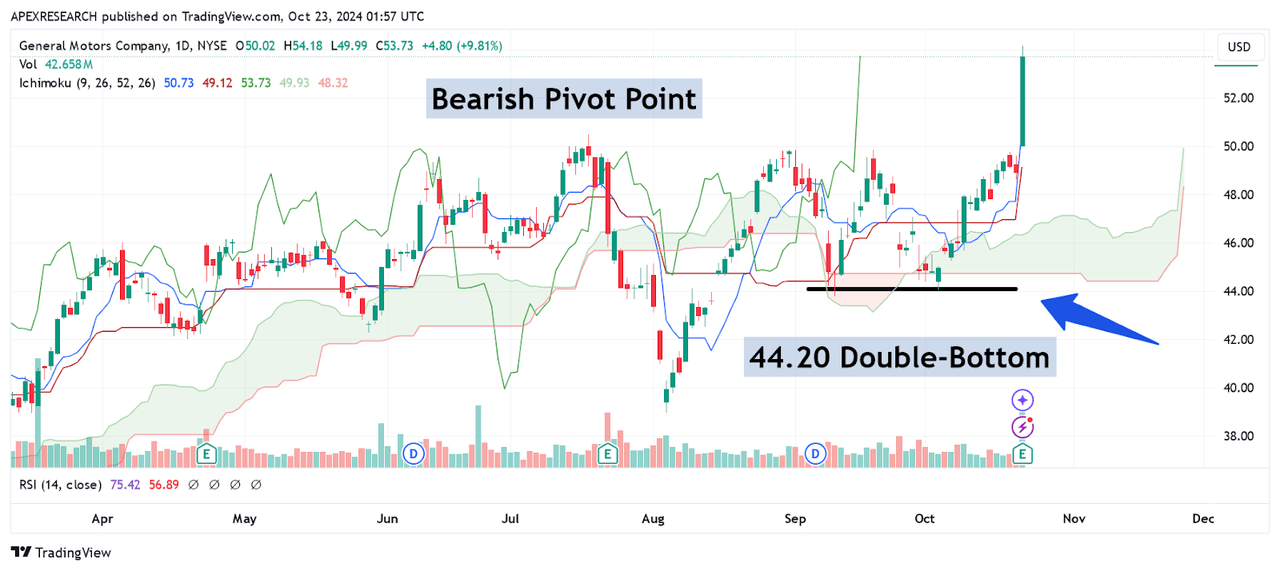
As we can see, there are currently several fronts on which to base a bullish argument for this stock. For investors that have been long GM for an extended period of time, the year 2024 likely feels like a tremendous validation. General Motors’ YTD performances have more than doubled the gains that have been generated by the S&P 500, and it should be noted that this benchmark index is already trading well above its annual averages. Of course, the central risk to current GM long positions would be a reversion to the mean type of scenario where a downside pullback erodes some of the returns that have been generated throughout the year. For these reasons, I have established my downside pivot point for my long trade, which currently rests at $44.20 (which is the double-bottom support zone outlined in the chart above). I am viewing this price level as my bearish pivot point because this area marks the price lows from September 11th, 2024, and October 3rd, 2024. If share prices were to breach this level to the downside, I believe that the next bearish target would then be seen at the August 5th price low at $38.96. In my view, these movements to the downside would ultimately invalidate the current uptrend and signal that a major top would then be in place above $54 per share.
Analyst’s Disclosure: I/we have a beneficial long position in the shares of GM either through stock ownership, options, or other derivatives. I wrote this article myself, and it expresses my own opinions. I am not receiving compensation for it (other than from Seeking Alpha). I have no business relationship with any company whose stock is mentioned in this article.
Seeking Alpha’s Disclosure: Past performance is no guarantee of future results. No recommendation or advice is being given as to whether any investment is suitable for a particular investor. Any views or opinions expressed above may not reflect those of Seeking Alpha as a whole. Seeking Alpha is not a licensed securities dealer, broker or US investment adviser or investment bank. Our analysts are third party authors that include both professional investors and individual investors who may not be licensed or certified by any institute or regulatory body.
