Summary:
- We integrate fundamentals into our methodology to provide a comprehensive market context, revealing high-probability price targets and key levels for Advanced Micro Devices, Inc.
- Lyn Alden’s fundamental view on AMD is neutral, highlighting the importance of clear invalidation points for risk management in a volatile stock.
- Our analysis method helps us track market sentiment and project price movements, as seen in “Fibonacci Pinball.”.
- Current analysis suggests a bearish setup for AMD, with specific price levels guiding potential shifts in stance and risk management.
MarcinHaber/iStock via Getty Images
By Levi at Elliott Wave Trader; Produced with Avi Gilburt.
Is it audacity or something else that would have us present articles showcasing what many consider “technical analysis” on a fundamentals-centered site? Well, to be clear, we do use fundamentals in our analysis. Lyn Alden, one of the finest fundamentals analysts in the field, is our lead. But we also seek the synergy between fundamentals and, lacking a better description, “technicals.”
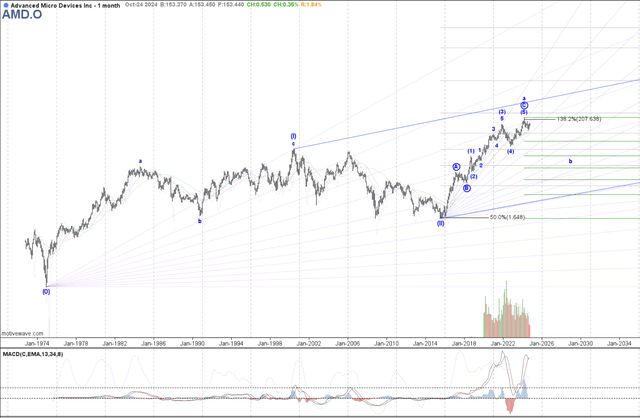
One key component to this type of analysis we provide is the ability to show current context, especially in the big picture. We’re going to do this in AMD and reveal what the probabilities are showing us. Here’s a quick hint: it’s not bullish.
Furthermore, please keep in mind that this methodology is not “technical analysis” as you are perhaps accustomed to studying about. MACD, stochastic readings, RSI, key moving averages both simple and exponential — yes, we are familiar with them all and more. However, they are linear tools in a non-linear universe — the markets. Take just a moment and familiarize yourself with our methodology.
This Methodology Provides Context
What do we mean by context? The literal definition is something like this:
“The surroundings, circumstances, environment, background or settings that determine, specify, or clarify the meaning of an event or other occurrence.”
Now, let’s take that and color in the literal lines to give this a bit more understanding when it comes to the markets. The Elliott Wave is based on the fact that markets are fractal in nature. These structures are self-similar at all degrees. This means that the smaller structure should agree with the larger structure and vice versa. In fact, this is a way that a technician can ‘check’ their own work by making sure the subwaves agree with the larger context.
What is perhaps even more powerful is that these larger structures help us identify high-probability price targets, and they also give us specific levels where we would need to shift our weight and even alter our opinion. How does this context help us with AMD here? Let’s place the fundamentals piece first.
The Current Fundamental Snapshot For AMD
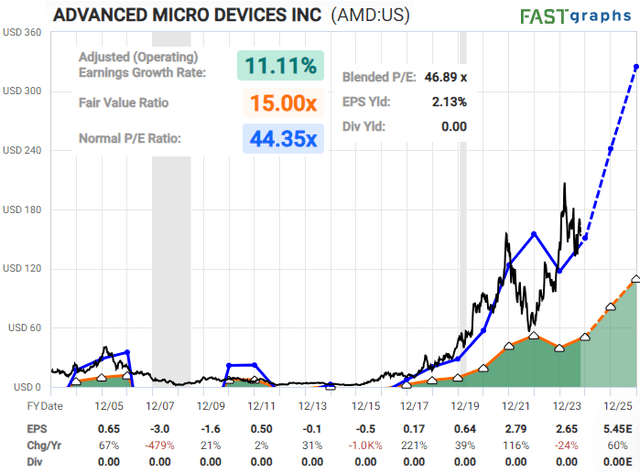
“I have no high-conviction view on AMD in either direction.
Consensus analyst expectations continue to forecast strong earnings growth ahead, so for risk management purposes, any attempts at shorts should ideally come with clear invalidation points.
If the stock were to have a significant correction as Zac’s technicals suggest, I’d be potentially interested in longing it at that point. With a stock this volatile, that’s entirely possible.” — Lyn Alden.
What Is All This Sentiment “Nonsense”?
We’ve seen our work called “hocus-pocus,” “mumbo-jumbo,”
“reading tea leaves” … and a few other choice phrases. But what the detractors leave out is the results. Perhaps we mock what we do not understand?
Here is a brief excerpt from an article that Avi Gilburt wrote regarding sentiment (crowd behavior):
“Elliott theorized that public sentiment and mass psychology move in 5 waves within a primary trend, and 3 waves within a counter-trend. Once a 5 wave move in public sentiment has completed, then it is time for the subconscious sentiment of the public to shift in the opposite direction, which is simply the natural cycle within the human psyche, and not the operative effect of some form of ‘news’.
And, in 1940, Elliott publicly tied the movements of human behavior to the natural law represented through Fibonacci mathematics. Therefore, these primary trend and counter-trend movements in the market generally adhere to standard Fibonacci extensions and retracements.”
Now, before you throw shade at the light, just let this marinate for a minute. It was these very movements that helped in the development of what we lovingly call “Fibonacci Pinball.” Basically, this is the seemingly orderly movement of a stock or market as its structure unfolds before us.
And, we see this “Pinball” displayed day after day in our trading room. In fact, we will track the Elliott Wave structure live and show our members key turning points, resistance, and support levels throughout the day. It is not a one-off. This has become our preferred way of tracking and trading the markets. Why? Because it works!
Not all paths will play out as illustrated. We view the markets from a probabilistic standpoint. But at the same time, we have specific levels to indicate when it’s time to step aside or even change our stance and shift our weight.
The Structure Of Price Speaks About AMD
As of late, we have been keenly focused on the VanEck Semiconductor ETF (SMH) and several of its components. One chart that is showing a clear bearish setup currently is Advanced Micro Devices, Inc. (NASDAQ:AMD). Now, keep in mind Lyn’s comments above about any that would initiate a short position. We will heed that counsel and share the current Wave Setup for the readership.
StockWaves StockWaves StockWaves StockWaves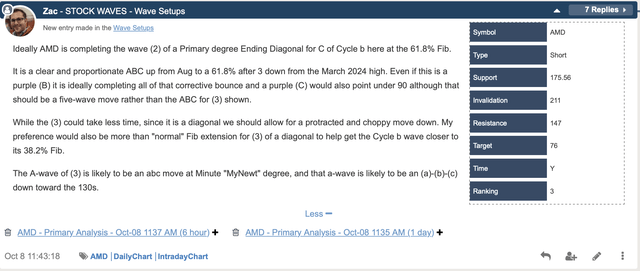
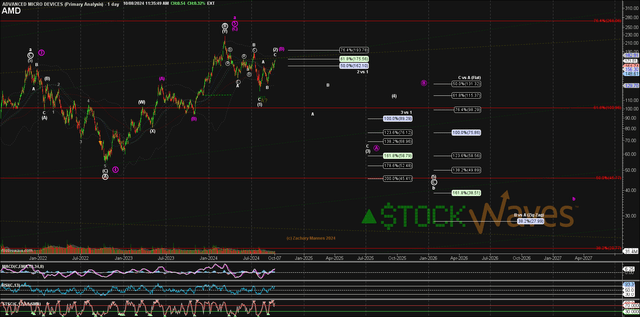
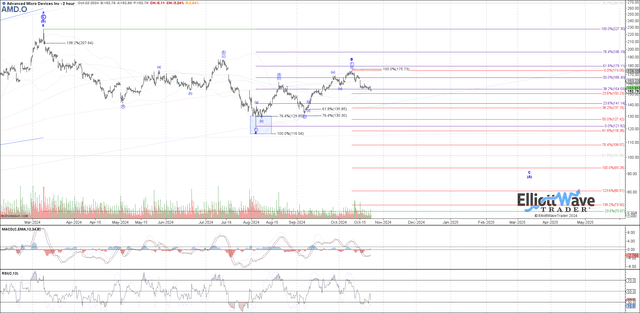
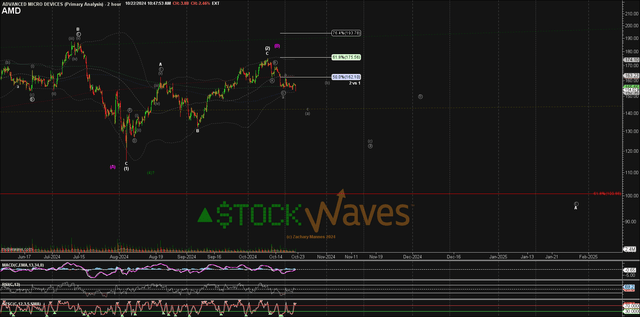
Note that the parameters shown in the setup have clear levels that further validate it or show where it would be nullified for the present. The basic caveat that Zac shared today was that “over 176 could lead to further extension higher toward 194+.”
Conclusion
We have specific price levels to provide guidance along this likely bearish path. Can it invalidate? Of course? It’s OK to be wrong; just don’t stay wrong. Not all setups are certainties, just as projections are not prophecies.
Yes, there are nuances to the analysis. Once familiar with our methodology, our members discover a powerful ally on their side to provide guidance and risk management in their trading/investing.
There are many ways to analyze and track stocks and the market they form. Some are more consistent than others. For us, this method has proved the most reliable and keeps us on the right side of the trade much more often than not. Nothing is perfect in this world, but for those looking to open their eyes to a new universe of trading and investing, why not consider studying this further? It may just be one of the most illuminating projects you undertake.
(Housekeeping Matters)
If you would like notifications as to when our new articles are published, please hit the button at the bottom of the page to “Follow” us.
Analyst’s Disclosure: I/we have no stock, option or similar derivative position in any of the companies mentioned, but may initiate a beneficial Short position through short-selling of the stock, or purchase of put options or similar derivatives in AMD over the next 72 hours. I wrote this article myself, and it expresses my own opinions. I am not receiving compensation for it. I have no business relationship with any company whose stock is mentioned in this article.
Seeking Alpha’s Disclosure: Past performance is no guarantee of future results. No recommendation or advice is being given as to whether any investment is suitable for a particular investor. Any views or opinions expressed above may not reflect those of Seeking Alpha as a whole. Seeking Alpha is not a licensed securities dealer, broker or US investment adviser or investment bank. Our analysts are third party authors that include both professional investors and individual investors who may not be licensed or certified by any institute or regulatory body.
STOCK WAVES: Where fundamental analysis meets technical analysis for highest-probability investment opportunities! Get leading Elliott Wave analysis from our team, along with fundamental insights and macro analysis from top author Lyn Alden Schwartzer.
“Stockwaves is my bread and butter, and that’s only catching maybe 10% of the charts they throw out! I had 7-10x+ trades with SW last year, and dozens more that were “slackers” (LOL) with “only” 3-4-5x returns. Amazing!” (Nicole)
Click here for a FREE TRIAL.

