Summary:
- Alphabet’s Q3 revenue rose 15% to $88.3 billion, surpassing expectations, with Google Cloud and advertising leading gains.
- Cloud revenue jumped 35% to $11.35 billion, marking Alphabet’s second-largest segment, driven by strong AI demand.
- Operating income increased 34% to $28.5 billion, with operating margins improving from 28% to 32%, reflecting cost efficiencies.
- Traffic Acquisition Costs rose 8.5% year-over-year to $13.7 billion, reflecting Alphabet’s investment in driving platform traffic.
- AI-focused capital expenditures surged 71.9% to $13.06 billion, which could limit near-term profitability despite growth in AI segments.
400tmax
Investment Thesis
Since our last bullish coverage, Alphabet Inc. (NASDAQ:GOOG) has risen by 7%, earning the hold rating as its advertising and Cloud segments support long-term stability, but rising costs limit near-term gains. Google Search, YouTube, and Cloud revenue remain robust, yet growing Traffic Acquisition Costs (TAC) and heavy AI CapEx weigh on margins.
Alphabet appears fairly valued with a forward P/E of 21.21 and PEG of 1.25, limiting upside. While Alphabet’s strong revenue streams support a solid hold, its elevated cost base and high valuation suggest muted short-term potential.
Alphabet’s AI Promise: 8 Quarters Later, Is Innovation Delivering More Than Just Words?
In the opening statements of the Q3 earnings call, Alphabet’s CEO mentioned:
Our commitment to innovation as well as a long-term focus and investment in AI are paying off and driving success for the company and for our customers.
The statement feels repetitive, as eight quarters have passed since the launch of ChatGPT (Q4 2022) and the onset of the AI race. The real insight into AI CapEx spending and its returns lies in the financial performance rather than in statements from top management.
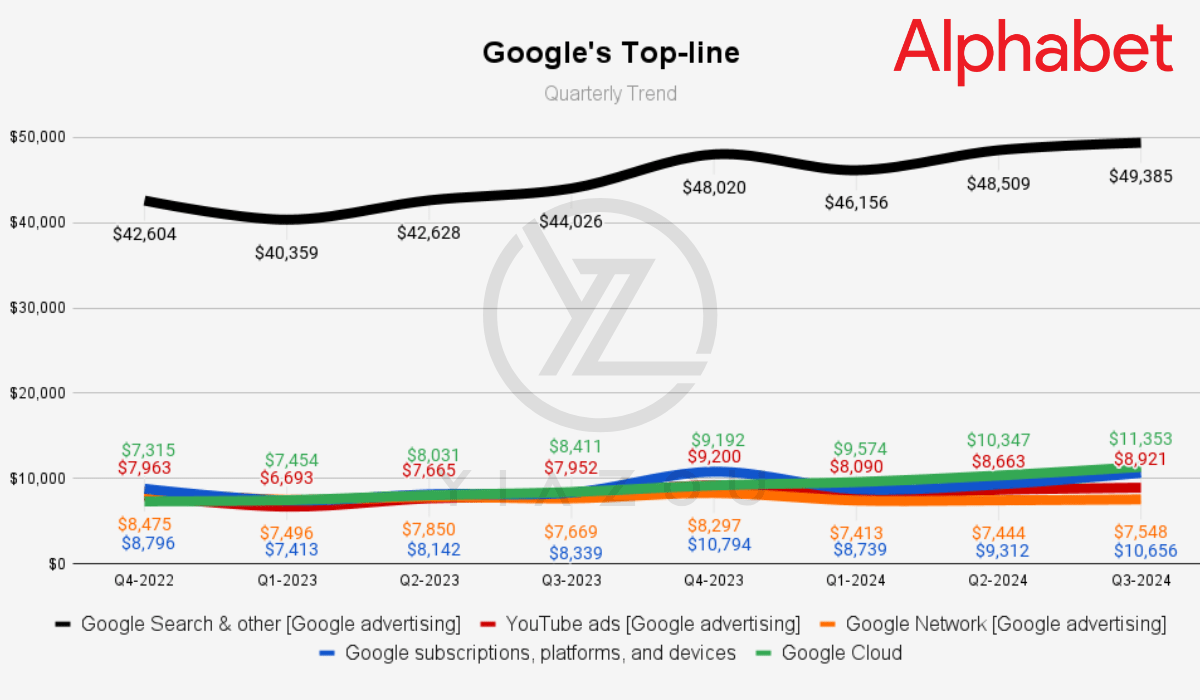
To begin with, Alphabet’s core revenue engine, Google Advertising, consists of Google Search, YouTube ads, and Google Network. Each segment shows moderate growth with stability based on Alphabet’s market lead. Google Search & Other revenue rose to $49.4 billion in Q3-2024, with a 16% increase since Q4-2022.
Aside from a slight decline between Q4-2022 and Q1-2023, quarter-over-quarter growth is primarily stable. This drop, about 5.3%, connects to seasonal trends. Google Search’s stable, upward revenue trend (15.9% in Q3-2024 over Q4-2022) marks Alphabet’s reliable capacity to maintain advertiser demand and retain target audience interest in its digital ads ecosystem.
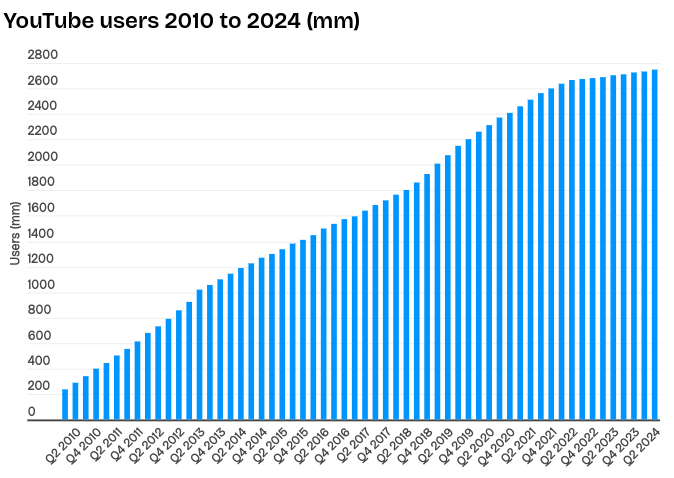
Moreover, YouTube ads show consistent recovery and growth at $8.9 billion in Q3-2024, about a 12% rise since Q4-2022. Although the revenue growth from Q4-2022 to Q4-2023 saw a 15.6% increase, growth in Q3 2024 marked a stable revenue gain over eight quarters. A drop in Q1-2023, almost 16%, briefly slowed growth but did not deter its overall upward path.
By Q3-2024, YouTube ad revenue had hit an eight-quarter peak. This trend in YouTube ad revenue points to Alphabet’s growing strength in video ads against Reels and TikTok, based on an expanding base of users and adapting to shifting viewer habits and advertiser goals.
businessofapps.com
In contrast, Google Network’s revenue dropped 10.9%, fluctuating around $7.5 billion. There is slight variation here, with changes below 2% each quarter. This segment marks Alphabet’s maturity in this area but lacks sharp growth potential. Google Network’s drop in revenue over the midterm balanced out other ad segments’ revenue uplifts, bringing a flatter revenue trend (+11.5% over the last 8 quarters) within Alphabet’s ad portfolio.
For instance, the Google subscriptions, platforms, and devices segment has grown revenue by 21.2% over the last eight quarters, and the total revenue of the Google Services segment, which encompasses all advertising and direct-to-consumer platforms, points to Alphabet’s slightly flatter revenue growth.
Additionally, Google Services revenue rose from $67.8 billion in Q4-2022 to $76.5 billion in Q3-2024, marking a 13% gain over eight quarters. This growth is largely supported by a sequential jump of 12.2% between Q3-2023 and Q4-2023, reflecting a strong Q4 season. This boost in Google Services marks Alphabet’s capacity to keep users engaged through its search and ad products.
In short, Google’s comprehensive ecosystem of ad services enables stable revenue flow across multiple channels, benefiting GOOG stock with Alphabet’s growth-focused targets. On the other hand, Google Cloud shows relatively sharp revenue growth and consistently expands its revenues by double digits. Starting at $7.3 billion in Q4-2022, Google Cloud revenue rose to $11.3 billion in Q3-2024, marking a 55% increase over eight quarters.
This rapid rise suggests Alphabet’s lead within the competitive cloud sector. The Cloud segment grew constantly quarter-over-quarter, including a 10% increase between Q1-2023 and Q2-2023. Alphabet’s expansion in cloud revenue marks its focus on building AI infrastructure that boosts enterprise clients’ tech demands (in data analytics, AI, and machine learning).
Alphabet’s consolidated revenue (covering all segments) is the cumulative strength of advertising, subscriptions, platforms, devices, and the Cloud. Alphabet’s consolidated revenue grew 16.1% over eight quarters, rising from $76.05 billion in Q4-2022 to $88.27 billion in Q3-2024. While seasonal patterns lead to Q1 2024 dips, the midterm revenue pattern remains sharply upward, with a major increase of 12.5% occurring between Q3-Q4-2023. This reflects Alphabet’s steady gains across Google Search, YouTube, and Google Cloud, marking its multi-segment solid model.
Yiazou
Rising Costs and High Valuations: Can Alphabet’s Growth Justify Its Price Tag?
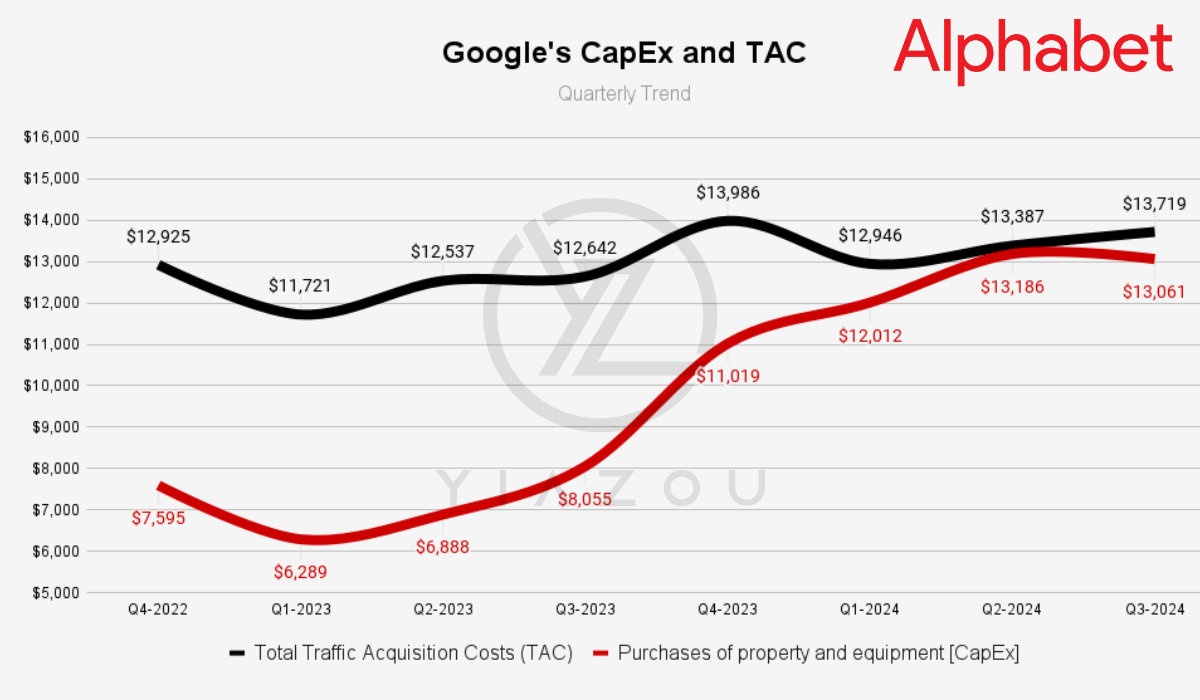
On the downside, Alphabet’s TAC, which reflects expenses for securing traffic on its platforms, has been rising steadily, impacting Alphabet’s core advertising profit margins. From Q4-2022 to Q3-2024, TAC increased, hitting $13.72 billion in Q3-2024 compared to $12.93 billion in Q4-2022 (+6.1%).
The year-over-year (YoY) comparison between Q4-2022 and Q4-2023 shows an increase of around 8.2%, while Q2-2023 to Q2-2024 saw a 6.8% rise. Higher TAC may signal an over-reliance on paid traffic. Even if it is growing slower than the ad revenue, TAC growth may lead Alphabet to face constraints on its margins, reducing the potential for substantial value growth because it is happening after massive CapEx spending on AI.
In detail, Alphabet’s CapEx has seen a considerable rise. It stood at $7.60 billion in Q4-2022 and hit $13.06 billion in Q3-2024, a sharp increase of over 71.9%. This rapid upward trend reflects heightened spending on AI infrastructure. CapEx has exceeded $12 billion for three consecutive quarters, marking a stable and high investment level.
However, a higher CapEx without proportional growth could indicate a decline in return on these investments. In its current state, CapEx growth, 72% over the last 8 quarters, has surpassed Alphabet’s fastest-growing segment (Google Cloud). This may bring valuation challenges if Alphabet cannot boost revenues to match this capital outlay, putting midterm financial strain on its resources.
Yiazou
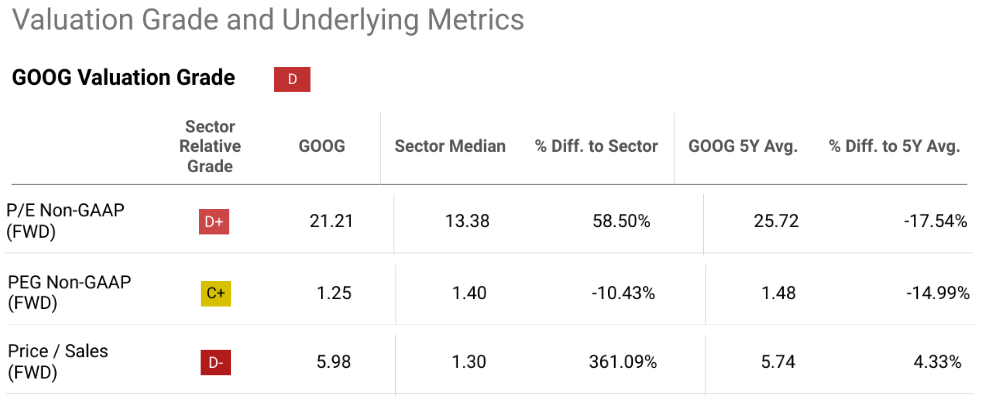
Currently, Alphabet’s valuation metrics mark potential overvaluation risks against its sector average. Its forward P/E ratio is 21.21, 58.5% above the sector median of 13.38. Yet Alphabet’s premium suggests the market already prices in considerable growth that may not materialize based on recent consensus revenue revisions.
In the same context, the forward PEG ratio at 1.25 is 10.43% lower than the sector average of 1.4, signaling limited room for substantial future growth. Furthermore, considering top-line growth, Alphabet’s forward Price/Sales ratio stands at 5.98, marking a 361.09% premium over the sector’s 1.3. These elevated valuations may deter stock prices, especially if revenue growth slows, adding risks to Alphabet’s stock price stability.
For more accuracy, comparisons to Alphabet’s averages over the past five years point to some positives regarding stock price growth projections. Its forward P/E is lower by 17.54% from its five-year average of 25.72, indicating undervaluation in Alphabet’s stock based on projected earnings growth. But again, the forward PEG ratio is down 15%, now at 1.25 against its five-year average of 1.48. This suggests that the street is cautious about Alphabet’s ability to maintain growth rates over time.
Lastly, Alphabet’s forward price/Sales ratio represents a fair valuation against the five-year average of 5.74. This leveling off in valuation could imply limited near-term stock appreciation unless revenue growth gains a boost over CapEx growth.
seekingalpha.com
Takeaway
GOOG remains a solid long-term hold due to its consistent revenue from advertising and strong growth in the Cloud. While Alphabet’s AI investments and cloud expansion underpin its competitive edge, rising TAC and significant CapEx in AI infrastructure weigh on profit margins. High valuation metrics further suggest limited short-term upside. However, Alphabet’s robust revenue streams and commitment to innovation support a stable hold for investors prioritizing steady, long-term gains amidst evolving market conditions.
Analyst’s Disclosure: I/we have no stock, option or similar derivative position in any of the companies mentioned, and no plans to initiate any such positions within the next 72 hours. I wrote this article myself, and it expresses my own opinions. I am not receiving compensation for it (other than from Seeking Alpha). I have no business relationship with any company whose stock is mentioned in this article.
Seeking Alpha’s Disclosure: Past performance is no guarantee of future results. No recommendation or advice is being given as to whether any investment is suitable for a particular investor. Any views or opinions expressed above may not reflect those of Seeking Alpha as a whole. Seeking Alpha is not a licensed securities dealer, broker or US investment adviser or investment bank. Our analysts are third party authors that include both professional investors and individual investors who may not be licensed or certified by any institute or regulatory body.
