Summary:
- Assessing TAMs, market share, margins and multiples can help investors maintain a “big picture” view of Amazon’s prospects.
- I do so across three of Amazon’s main business lines, via a bear and bull case scenario.
- Even in a reasonable bear case scenario, Amazon represents a decent opportunity for investors, with the bull case offering incredible upside.

hapabapa
Amazon’s (NASDAQ:AMZN) main business lines are brimming with potential. Ecommerce, cloud, advertising and subscriptions are each wonderful businesses in dominant positions. As I did in my first article on Nvidia (NVDA), I will execute some thinking and basic math on Amazon’s markets, market shares, margins and multiples to arrive at a conservative market capitalization of $8.4T in ten years, which I consider my bear case. I will also execute the bull case, which you will find at the end of the article.
Because I executed this analysis on three of Amazon’s business segments, sequencing below is complex. Keep in mind that the final formula we will get to will remain:
10-year TAM x Market Share x Margin X Multiple = Ten-year Market Capitalization
These forward figures are estimated based on bull or bear case thinking. How I come to the bear and bull case for each of the four sections is outlined below.
Tangible Addressable Market
Below are the suggested 10-year TAMs for Amazon’s main business lines.
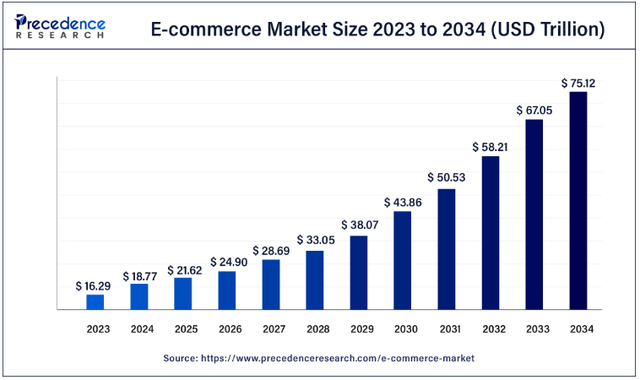
Ecommerce TAM (Precedence Research)
Precedence Research expects worldwide ecommerce TAM to be $75.12T in 2034. Extrapolating a year further, this could be a TAM of $80T, indicating a CAGR of 15.6%.
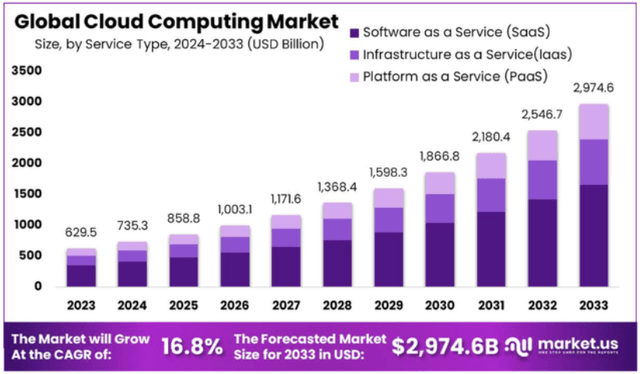
Cloud TAM (market.us)
Cloud TAM is expected to be $2.975T in 2033. Pushing that to 2035 at a 12% rate, the 2035 TAM could be $3.731T.
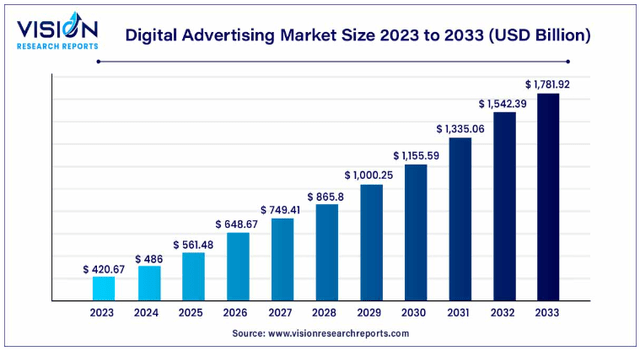
Digital Advertising TAM (Vision Research Reports)
For advertising, Vision Research Reports forecasts a TAM of $1.782T by 2033. Extrapolated to 2035 at 10%, below the 15.53% used annually by Vision Research Reports, that figure becomes $2.156T.
Bear Case ($52.67 Trillion by 2035)
- Ecommerce – Taking a more conservative view than 15.6% growth sourced above, I’ll assume 10% ecommerce growth to 2035, or an ecommerce TAM of $48.7T.
- Cloud – Instead of the 16.8% CAGR sited above, I’ll assume a 12% CAGR to 2035, resulting in a TAM of $2.284T.
- Advertising – I’ll assume growth slows to 12% from the projected 15.53% by Vision Research Reports. This gets us to a TAM of $1.689T in 2035.
Total TAM comes to $52.67T across the main three segments.
Bull Case ($85.89 Trillion by 2035)
- Ecommerce – As estimated by Precedence Research, $80T.
- Cloud – As estimated by market.us, $3.731T.
- Advertising – As estimated by Vision Research Reports and extrapolated at 10% to 2035, $2.156T.
Total TAM comes to $85.89T across the three segments.
Market Share
Bear Case (Weighted Market Share of 3.35%)
- Ecommerce – If Precedence Research’s work is to be believed, the TAM for worldwide Ecommerce will be $21.62T in 2025, next year. I annualized Amazon’s ecommerce revenues from its recent quarter, subtracting out cloud, ads, subscriptions and physical stores. It resulted in $397B, which I consider to be ecommerce revenue only. This includes third-party seller services, which is not strictly the sale of products, but the sale of services in the ecommerce industry. $397B/$21,620B comes to a market share of 1.84%. Despite Amazon’s expansion internationally, including in high-growth areas like Brazil, there is also fierce competition from PDD Holdings (PDD), MercadoLibre (MELI), Sea Ltd. (SE) and others. I will assume this market share grows to 2% by 2035 as the bear case.
- Cloud – Amazon reported earnings recently and demonstrated its AWS segment maintained its market share at 31%. Over a ten-year period to 2035, it is difficult to unknowable which of the main cloud providers will steal share from each other, but Microsoft’s share continues to grow. AWS has hovered in the 30-35% range, dipping downwards in the last 12 months. To be conservative, I’m going to assume that AWS loses market share slowly towards a 28% market share in cloud by 2035.
- Advertising – Amazon is cited below at 8% of global digital advertising market share. I’m going to assume just 9% market share in 2035, despite the strong market share growth Amazon has experienced in the last seven years.
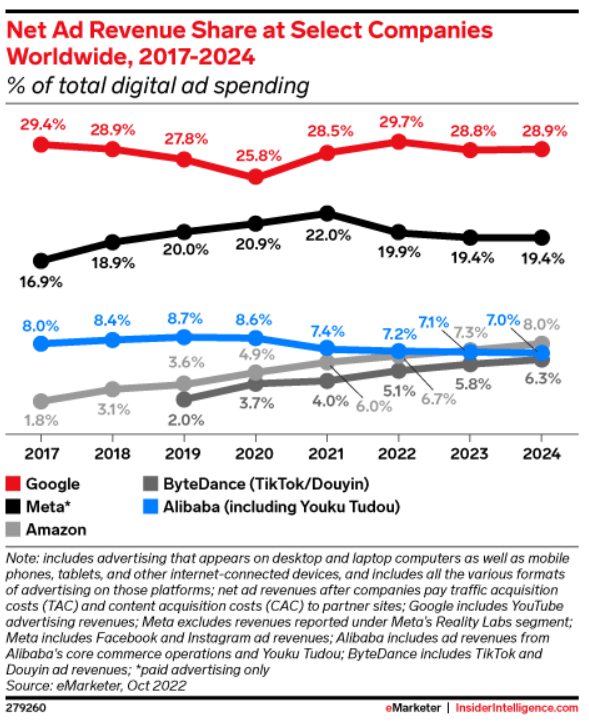
Global Digital Advertising Market Share (theb2bhouse)
Market shares of 2%, 28% and 9%, weighted by the bear case TAMs presented in the last section (48.7T, $2.284T and $1.689T), give us a weighted total market share of 3.35% of the bear case TAM of $52.67T.
Bull Case (Market Share of 5.37%)
- Ecommerce – Amazon strategy works, and global ecommerce market share grows from 1.84% to 4% over the next decade.
- Cloud – AWS stops the bleeding market share, gaining more quality clients such as governments, and maintains its market share at the current 31%.
- Advertising – Advertising market share continues its market share growth trend to 12% by 2035.
Market shares of 4%, 31% and 12% weighted by the bull case TAMs presented above ($80T, $3.731T, $2.156T) give us a weighted total market share of 5.37%.
Margins
Bear Case (Margins of 19.97%)
- Ecommerce – Current margins for Amazon’s ecommerce division, calculated via its Q3 earnings report, were 5.3%. Margins remain at a flat 5% in 2035.
- Cloud – As AWS loses some of its current market share, pricing power slips, hurting margins. Current margins are calculated at 38%, and remain stable there into 2035. I do not expect margin compression in the long term because Amazon’s cloud customers include governments and large corporations, and the triopoly of cloud offerings, including Google (GOOGL) and Microsoft (MSFT), will continue to give each pricing power.
- Advertising – similar to other large online advertisers, operating margins will be high. Google Search margins are in the 42-45% range according to its recent report, while Meta Platforms’ (META) operating margin was 43%. Likewise, I’ll allocate a 40% operating margin for Amazon’s ad business.
On a weighted basis, the bear case margin comes to 19.97%.
Bull Case (19.00%)
- Ecommerce – Current margins for Amazon’s ecommerce division, calculated via its Q3 earnings report, were 5.3%. Given Amazon’s ecommerce dominance and 10% growth internationally which just turned profitable this year, I can see margins growing to 7.5% in 2035.
- Cloud – As AWS is the largest cloud provider, there is reason to believe that cloud services maintain pricing power. I believe margins could grow to 45% in the long term to 2035.
- Advertising – again similar to other large online advertisers, current investments at Amazon are extremely high, owing to the need for large data centers with GPUs to service Amazon’s ads, as well as its cloud growth. Since current margins are already 38% with such steep investments, should investments slow once a critical mass of compute is reached, a 45% margin is well within reach.
On a weighted basis, the bull case margin comes to 19%. Not that this is lower than the bear case margin due to the effect of a larger base of lower-margin ecommerce revenue in the bull case compared to the bear case.
Multiples
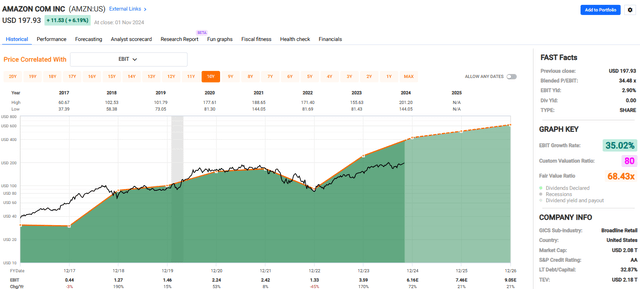
Amazon has averaged 68.43x operating earnings (EBIT) for the last eight years.
Amazon (FastGraphs)
Despite the above casting Amazon in an undervalued light, most of its valuation historically has been due to Amazon’s potential. In the next ten years, my bear and bull cases are discussing capitalizing on such potential.
That potential exists in both revenue growth and a slowing of Amazon’s huge R&D investments. Amazon’s forward R&D+EBIT/EV valuation comes in at 10.4% at a share price of $197. Decoded, this means if Amazon cut all R&D, and paid out all R&D and EBIT earnings, your yield would be 10.4% on a pre-tax, pre-adjustment and enterprise value basis. This is a multiple of 9.6x these earnings. Again, this is a little below the long-standing valuation which would be around at 7% forward R&D+EBIT yield.
Note that the work of teasing out how much R&D was spent on each business line is full of guesswork with a large potential for error. I normally prefer to value companies based on forward (R&D+EBIT)/EV, a key element in my Five Factor Model. This is possible at the company level, but not at the segment level. Since the segment margin work had to be done at the EBIT level due to R&D breakdown ambiguities, I will apply multiples at the EBIT level instead.
Bear Case (20x EBIT)
I place the bear case at 20x EBIT, compared to the current 35x. In the long run as growth slows and some of the market shares and margins outlined above deteriorate, EBIT is worth far less than historically. This is a classic example of growth realized and multiples falling.
Bull Case (40x EBIT)
In the bull case where ecommerce, cloud and advertising all excel, this business would be worth closer to 40x EBIT. This would represent stable valuations with expected growth realized.
Putting It Together
This part is simple. The formula is:
10-year TAM x Market Share x Margin X Multiple = Ten-year Market Capitalization
In both bear and bull cases, we are going to add in Amazon Prime subscription revenues. In the bear case, last quarter’s 11.278B annualizes to $45.1B and grows at 5% (under the current 11%) annually to $73.48B in 2035. In the bull case, it grows at 8% to $97.4B in 2035.
Bear Case
($52.67T x 3.35% x 19.97% + $73.48B) x 20 = Ten-year market capitalization of $8.44T
To my eye, we have a low downside risk where a bear case would give us a 4x on our investment in a decade, given Amazon’s enterprise value is currently only $2.11T. That is an 14.9% CAGR (compound annual growth rate).
Bull Case
($85.89T x 5.37% x 19.00% + $97.4B) x 40 = Ten-year market capitalization of $38.97T
The above would be a case where every aspect of the business executes perfectly – where TAM growth, market share gains, margin improvements and multiples all play out in the “ideal” bull case. But I should also mention that levels I’ve chosen for market growth, market share, margins and multiples in the bull case are not far off current figures. This means that despite the 10-year market capitalization looking far off, it may not be. The bull case comes to an amazing 18x on today’s share price, despite lower valuations than historically.
Looking at the bear and bull cases, we can see that we have limited downside risk in the long term, compared with quite positive upside potential over the same period.
Risks
I’m going to detail four main risks associated with my thesis.
1) The bear case I have chosen is reasonable, but not extreme. Since investing is predominantly about not losing money, creating an extreme bear case may prove there are vulnerabilities in my more moderate bear case. As such, if any of Amazon’s business lines perform below my bear case scenario, there could be downside risk to the valuations, margins and market share, and ultimately, the share price target.
2) The TAM growth is predicated on presumptions from various forecasts from Precedence Research, market.us and Vision Research Reports. Should these forecasts be too optimistic, it could take years longer for both bear and bull case targets to be reached, hurting returns.
3) Structural – Amazon is always going to be a target of data breaches, cybercrime, and other hacker-based attacks. These attacks have been shown to cause serious damage. Hopefully readers have not forgotten when a cyberattack on the UK’s health system shut the entire thing down, locking records and processes for everyone, before a young counter-hacker solved the problem. This will always be an ongoing threat to Amazon.
4) Taxation – Amazon’s delivery vehicles use our road systems extensively, yet the company pays less tax as a percent of revenue than we do as consumers. This has been a gripe for years, with some jurisdictions looking to ecommerce to pay for the wear and tear caused by delivery trucks and shipping. This could become internationally popular, which would cause a serious dent in Amazon’s bottom line.
Conclusion
As investors, we can often get buried in the details of quarterly reports, news pieces, and drama. Taking a step back to look at where TAMs could be in ten years, and where market share, margins and multiples could be in a bear and bull case scenario helps us identify opportunities by going back to these basics.
While these elements are not the only pieces of the equation I prefer for a successful investment, they can help steer us in the correct direction on where fundamentals are like going, bounded by a reasonable bear and bull case.
This analysis demonstrates that even in a bear case, there is plenty of upside for Amazon shareholders. The bull case demonstrates that, should Amazon’s business lines develop wonderfully, investors would likely receive a magnificent return similar to the previous decade. With limited downside and notable upside, I rate Amazon a Strong Buy.
Analyst’s Disclosure: I/we have a beneficial long position in the shares of AMZN either through stock ownership, options, or other derivatives. I wrote this article myself, and it expresses my own opinions. I am not receiving compensation for it (other than from Seeking Alpha). I have no business relationship with any company whose stock is mentioned in this article.
Seeking Alpha’s Disclosure: Past performance is no guarantee of future results. No recommendation or advice is being given as to whether any investment is suitable for a particular investor. Any views or opinions expressed above may not reflect those of Seeking Alpha as a whole. Seeking Alpha is not a licensed securities dealer, broker or US investment adviser or investment bank. Our analysts are third party authors that include both professional investors and individual investors who may not be licensed or certified by any institute or regulatory body.
