Summary:
- Alphabet’s Q3 2024 results show a 15% revenue increase, driven by strong Google Services and 35% growth in Google Cloud, boosting net income.
- Google’s robust balance sheet, with over $110 billion in cash and minimal long-term debt, underscores its financial strength and future borrowing capacity.
- Waymo, Alphabet’s autonomous driving unit, is valued at over $45 billion in PE funding rounds, generating real revenue with 150,000 paid trips weekly, enhancing Alphabet’s diversified portfolio.
- With a projected 20.88% GAAP EPS growth rate for FY 2025 for high end estimates, I set a conservative price target of $210, aligning with Wall Street estimates.
Boy Wirat
A how-to guide on evaluating Google stock with the PEG ratio
I had been meaning to put a spreadsheet together for some time to express my thoughts on why PEG ratio valuations for stocks consistently growing earnings at 20%-25% per year is one of the strongest value indicators to hunt for.
Peter Lynch popularized PEG ratio valuations in his two excellent books, One Up on Wall St and Beating The Street. He argued that he’d rather have a P/E ratio of 20 stock growing earnings at 20% per year than a P/E 10 stock growing earnings at 10% or less per year.
After their recent earnings and forward analyst estimates, Google (NASDAQ:GOOGL)(NASDAQ:GOOG) fits into that category of a P/E 20 growing at 20% [or very capable of growing at 20%].
The first thing we have to do to visualize this is turn a ratio into a yield or percent to see our compounded growth rate over time. A P/E of 10 is simply a 10% yield if we inverse the P/E to E/P [earnings divided by price], the easy trick to producing a yield from a ratio is dividing 1 by the ratio.
The PEG ratio tells us a value of 1 or less is a good deal. In this instance, we merely need to find the forward estimated earnings growth rate, drop the percent sign and use that as our multiplier. The FWD earnings per share estimate would be our multiplicand. Multiply these two out and presto! That is equivalent to a PEG ratio of 1. Anything cheaper than that price should be a great value.
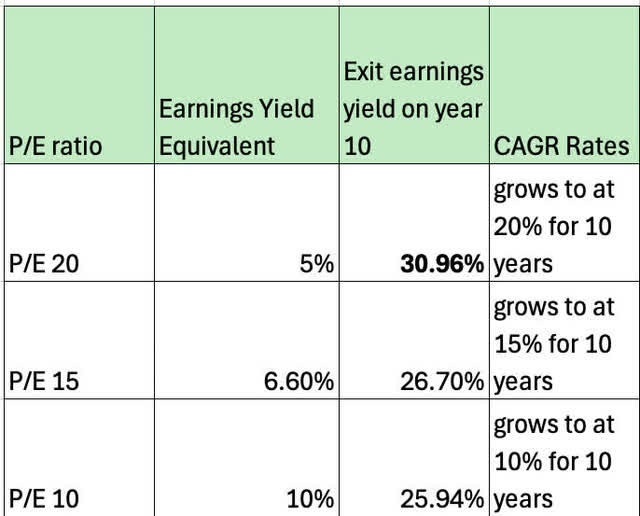
Below shows that a stock trading at 20 times earnings [an earnings yield equivalent of 5%] grows to an earnings yield on cost of almost 31% by year 10 where a 10 P/E growing at 10% only grows into about 26%. So in this instance, it’s hard to claim that the lower P/E stock is the better value in the long run.
Lynch advised to stay away from hot names expecting more than 25% growth for long periods of time. This 20-25% growth rate assumption was his favorite pile to pick through, as this growth rate is reasonably sustainable for great companies and can produce superior results to lower P/E stocks over time that have tepid growth rates.
Google is a strong buy and exactly the type of Goldilocks growth rate at a reasonable price that we should be hunting for. Yes, the stock does have some risks from the FTC, exploring a break up of this labeled monopoly. I personally would love to own this in “sum” or “in parts” and will remain patient.
First off, let’s review the latest earnings print.
Google’s recent earnings review
Alphabet Announces Third Quarter 2024 Results MOUNTAIN VIEW, Calif. – October 29, 2024 – Alphabet Inc. [NASDAQ: GOOG, GOOGL] today announced financial results for the quarter ended September 30, 2024.
• Consolidated Alphabet revenues in Q3 2024 increased 15%, or 16% in constant currency, year over year to $88.3 billion reflecting strong momentum across the business.
• Google Services revenues increased 13% to $76.5 billion, led by strength across Google Search & other, Google subscriptions, platforms, and devices, and YouTube ads.
• Google Cloud revenues increased 35% to $11.4 billion led by accelerated growth in Google Cloud Platform (GCP) across AI Infrastructure, Generative AI Solutions, and core GCP products.
• Total operating income increased 34% and operating margin percent expanded by 4.5 percentage points to 32%. • Net income increased 34% and EPS increased 37% to $2.12.
Services continue to grow
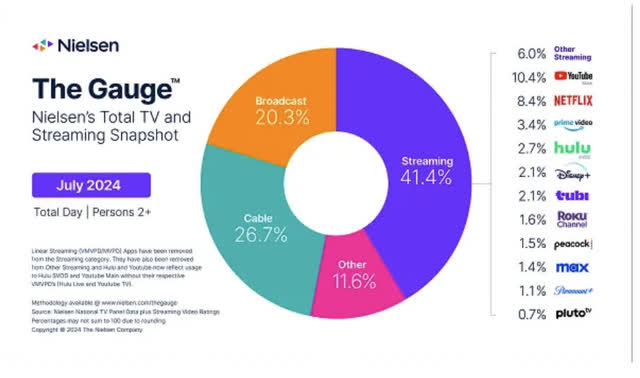
At a 13% clip, the subscription based services for Google are ramping up. Let’s remember, Youtube is the biggest streaming platform at over 10% of the U.S. streaming market share:
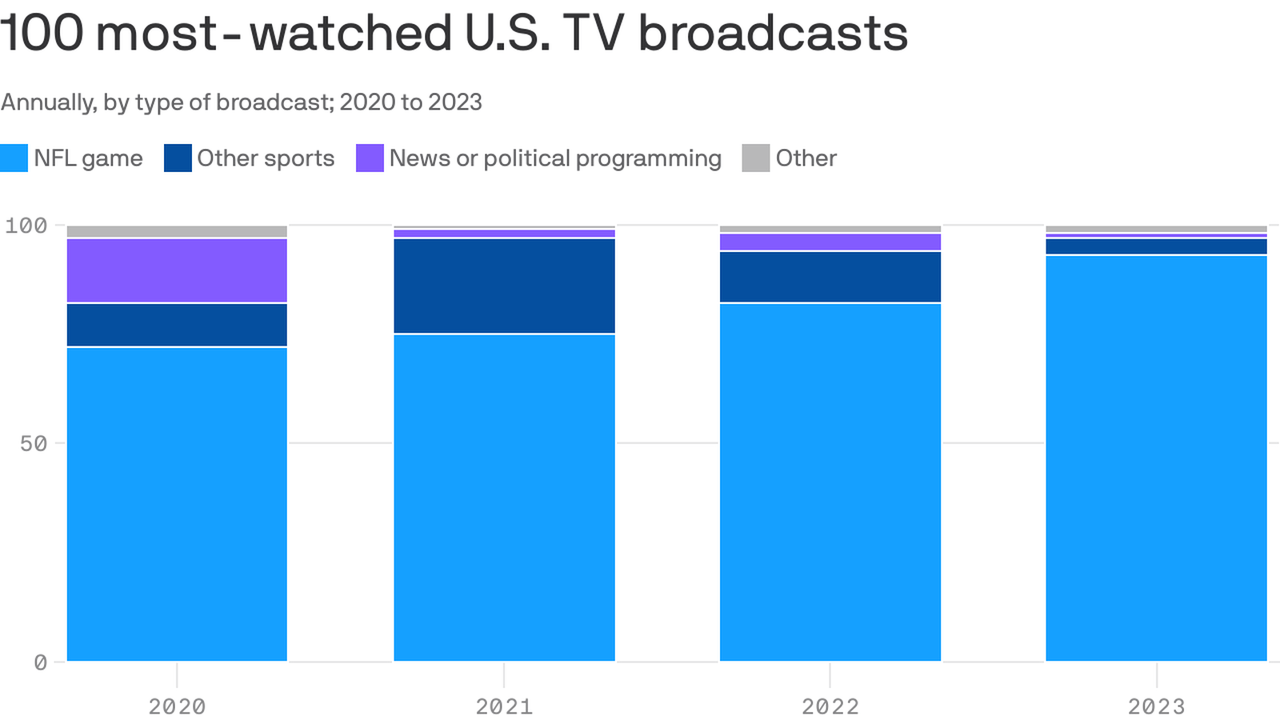
While many of us think of YouTube as a free and open-source platform for content creators, the subscription-based YouTube service is going to compete with the other paid streamers. The service is a consolidation of many different cable channels, their movie database, live sports, and the NFL Sunday Ticket. The 7-year $2 Billion/per annum deal with the NFL is a big reason to be bullish on YouTube as the NFL has become the most popular sports league in the U.S. by far.
Earnings beat top and bottom
Google beat Q3 2024 top and bottom line expectations and had great cloud revenue growth. As the CAPEX race heats up for who can be the top dog in AI and data center expansion [at NVIDIA’s (NVDA) delight], Google is spending, and cloud revenue is responding:
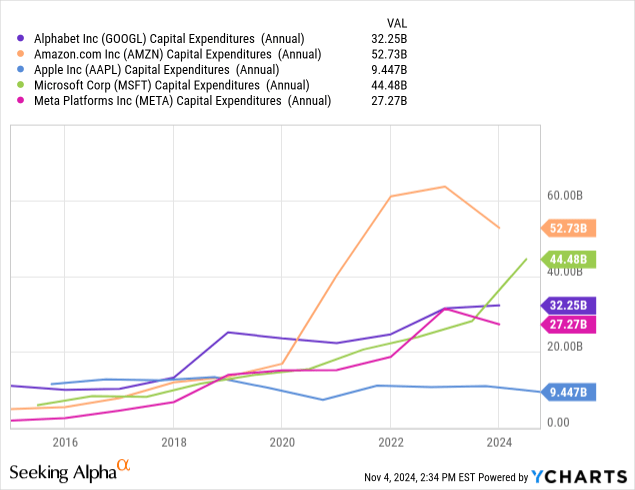
With this segment of the Mag 7 being the most relevant cloud and data center investors, Google is right there in the race with Microsoft (MSFT) and Amazon (AMZN).
Cloud market share keeps growing
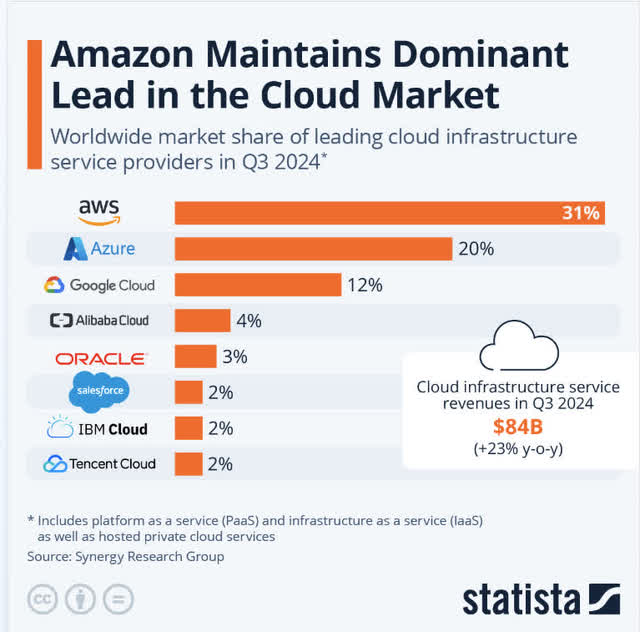
Although AWS has a healthy lead in Q3 2024, Google Cloud is growing and it seems ever more evident that these big 3 [Azure, AWS, and Google Cloud], are pulling away simply due to their balance sheets and ability to outspend competition. These 3 have a few of the best balance sheets you’ll ever find. In fact, I’d say after browsing them all, I believe Google has the strongest.
Ycharts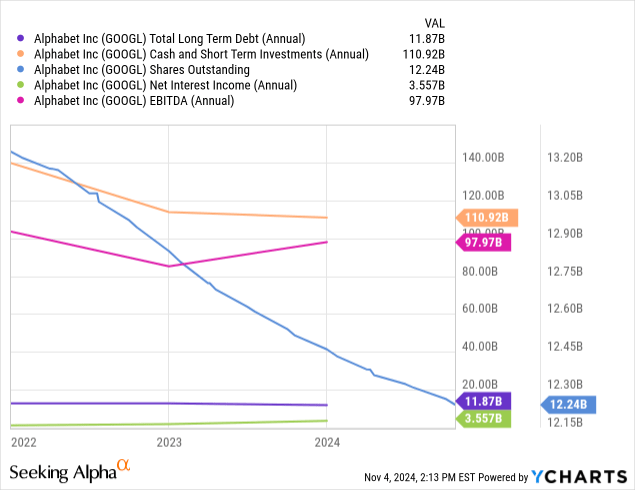
While I normally save the balance sheet for last, this balance sheet is one of the selling points of Google stock. Shares outstanding are distinctly down and to the right. Cash and short-term investments are over $110 Billion USD. Total long-term debt is only $11.87 Billion USD [basically one-tenth of their cash and short-term investments] and EBITDA is about 9 X greater than long-term debt. Just for reference, Johnson and Johnson (JNJ) aims to keep EBITDA at about 1 X long-term debt to maintain their vaunted AAA credit rating.
In the case of Google, they could take on another $85 Billion in leverage without crossing that 1 X EBITDA ratio. While there are other factors that Google has not met to get an AAA like Johnson and Johnson or Microsoft, their future ability to borrow is not something to be ignored unless the company and EBITDA are split into various pieces.
Finally, the green line shows that Google is raking in $3.2 Billion+ in net interest income. Not a typo, they do not have an interest expense line, they have income like a bank. Higher rates for longer only pad companies like Google’s balance sheet.
Reflexive patterns
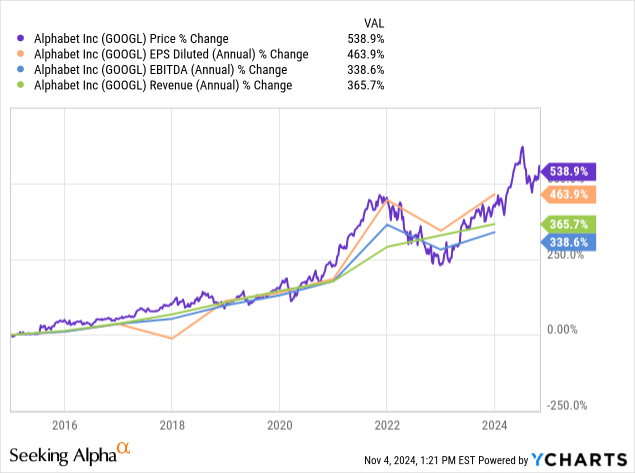
The biggest of the “hard asset light” Mag 7 is hard to measure up against the reflexive patterns of price growth versus profitability metrics as there could be a lot of non-GAAP add-backs depending on which analysts you ask. While price appreciation remains a bit ahead of EPS, EBITDA, and revenue growth, these items don’t deter me as the company is expected to have steady growth ahead. This isn’t dirt cheap like it was in 2022/23 where you see the purple price line dip below profitability, but everything remains closely on track considering forward growth.
Waymo valuation
Now valued at $45 Billion in the private equity markets as per electrek:
After getting a hefty $5.6 billion in fresh capital last week, Alphabet’s autonomous driving unit Waymo is now reported to be valued at more than $45 billion.
Automotive News reported that the latest round of financing led by Google-owned Alphabet included outside investors. Alongside an expanded partnership with Uber, the influx of cash will help the company expand its Waymo-One robotaxi service in San Francisco, Los Angeles, Phoenix, and beyond, delivering more than 150,000 paid trips each week.
As Tesla (TSLA) recently regained its footing after CEO Elon Musk re-stated his “robo taxi” vision of Tesla’s future, Waymo seems to be really putting the pedal to the metal with 150,000 paid trips each week already ongoing. Waymo also does not need to be linked up with any specific vehicle [ the tech can be retrofitted onto a variety ofvehicles] and runs on lidar tech versus a multitude of cameras. This is an under-talked-about valuable piece of Google that is finally generating revenue.
Breaking down the Mag 7 by EV/EBITDA
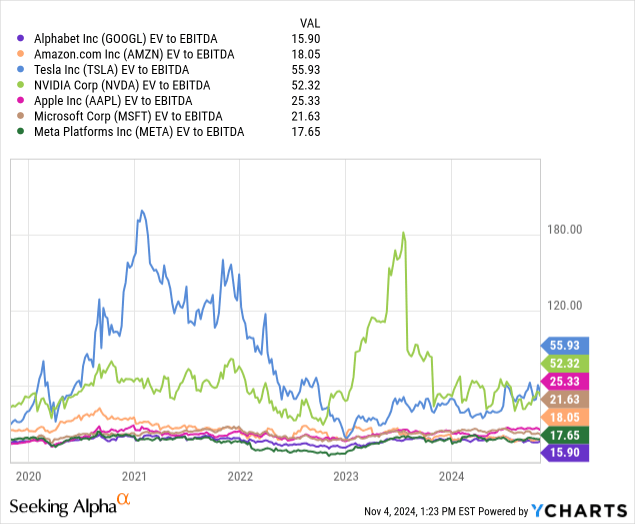
I’ve brought this chart up in a couple of portfolio articles:
- If I Had To Invest $150,000 Right Now, Here’s What I Would Buy
- Trump Vs. Harris: Top Stocks To Buy Or Avoid For The November 2024 Election
Using EBITDA as a proxy for cash flow, three of the Mag 7 are clearly undervalued with respect to the others. They are also the 3 [Google, Amazon, and Meta], that do not rely on a durable good products [or at least less so] to generate their earnings and growth. Durable goods like phones, cars, GPUs, and laptops, have a durable lifespan of at least 3 years, so that creates some cyclicality as a consumer will not need a new one until the old one is useless.
These 3 companies have remained in this slot of under 20 X EBITDA since the tech crash in 2022 and remain good deals. Google is the cheapest of the lot at 15.9 X EBITDA.
Forward earnings outlook
I don’t hide the fact that I am a Google bull. Usually, for these IP-heavy Mag 7 names I like to run a visualization of the company’s operating earnings backing out Research and Development expense [R&D] because as some have argued in the past, it might not be a necessary near-term expense to companies that don’t have a short cycle demand for their products to improve. Examples of short-cycle demand would be biotech and semi-conductors where they have to continually improve and face steep competition.
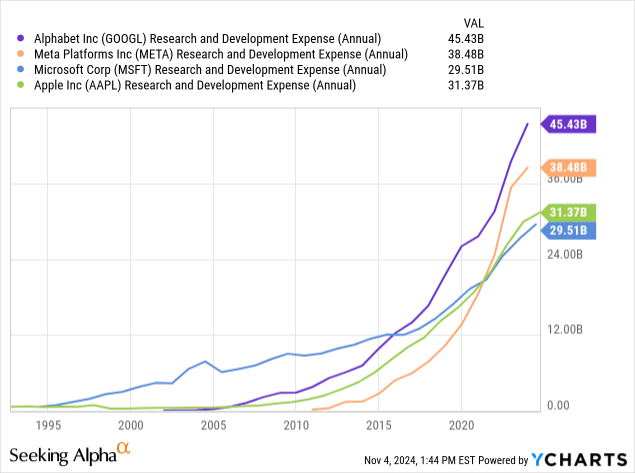
I’ve left Amazon (AMZN) off the list as they don’t break out this expense and Ycharts doesn’t pick up their known to be market-leading R&D, but these are the rest of the big spenders above.
Most of the Mag 7 are near-monopolies in their own right and are self-funding with very little debt.
R&D expense is often seen as a luxury for these companies to tinker with.
Earnings estimates for Google
Getting back to earnings estimates, bulls in the high column on the right, for which I am a part of, estimate a 20.88% growth rate in GAAP EPS between FY 2024 and FY 2025 [$8.33 2024 to $10.07 2025].
Valuation
As mentioned, with a simple PEG ratio analysis, this 20ish percent type growth rate is right in the sweet spot for what Peter Lynch recommended. In this case, I will use the following values for my price model:
- 20.88 as my multiplier.
- 2025 estimated high end GAAP EPS $10.07
- 20.88 X $10.07 = $210.26 price target.
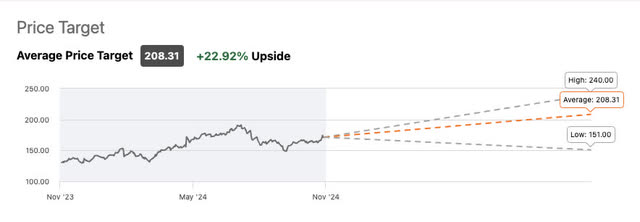
Looking at Wall St. Estimates, my price target fits right into the average near $208. $240 on the high end would be factoring in the market pricing this on non-GAAP metrics with I’m also ok with because of their unique expensing capabilities, but to be conservative, $210 is what I’m sticking to.
Risks of a break up & summary
Early October quotes from US government attorneys entailed the following:
“For more than a decade, Google has controlled the most popular distribution channels, leaving rivals with little-to-no incentive to compete for users,” the antitrust enforcers wrote in the filing. “Fully remedying these harms requires not only ending Google’s control of distribution today, but also ensuring Google cannot control the distribution of tomorrow.”
The search engine is the target of the FTC. A real risk here is the company being subdued in litigation for years similar to Microsoft when it was also sued for being a PC monopoly in the 1990s. This is one of the few companies that I would hold onto any spun-off parts if Google was forced to do so as I believe each part could be the best or close to the best at what they do. That is a risk I’m willing to take but other investors looking for Google to take off before they are out of the FTC’s crosshairs may lose patience.
For a patient investor like me, this latest earnings report displaying continued growth in all the right areas continues to make this a strong buy in my opinion.
Analyst’s Disclosure: I/we have a beneficial long position in the shares of GOOGL, GOOG, AAPL, AMZN, MSFT, META, XOM either through stock ownership, options, or other derivatives. I wrote this article myself, and it expresses my own opinions. I am not receiving compensation for it (other than from Seeking Alpha). I have no business relationship with any company whose stock is mentioned in this article.
The information provided in this article is for general informational purposes only and should not be considered as financial advice. The author is not a licensed financial advisor, Certified Public Accountant (CPA), or any other financial professional. The content presented in this article is based on the author's personal opinions, research, and experiences, and it may not be suitable for your specific financial situation or needs.
Seeking Alpha’s Disclosure: Past performance is no guarantee of future results. No recommendation or advice is being given as to whether any investment is suitable for a particular investor. Any views or opinions expressed above may not reflect those of Seeking Alpha as a whole. Seeking Alpha is not a licensed securities dealer, broker or US investment adviser or investment bank. Our analysts are third party authors that include both professional investors and individual investors who may not be licensed or certified by any institute or regulatory body.

