Summary:
- Meta has a mixed short and intermediate-term outlook but remains in a strong long-term uptrend, supported by technical charts and moving averages.
- Despite strong recent earnings, Meta’s growth is modest by historical standards, and valuation multiples suggest the stock is moderately overvalued.
- Technical indicators show potential near-term weakness, with concerning signals in the Bollinger Bands and MACD, suggesting caution for short-term investors.
- Given the mixed technicals and high valuation, I rate Meta stock as a hold, with long-term potential but limited near-term upside for Zuckerberg’s net worth.
chaofann
Thesis
Back in early October, Mark Zuckerberg became the world’s second richest person as he overtook Jeff Bezos, with his net worth soaring to $206 billion. Can Meta Platforms, Inc. (NASDAQ:META) stock potentially push Zuckerberg’s wealth further and make him the world’s richest person? In the technical analysis below, I determine that Meta stock has a slightly positive but overall mixed outlook in the short and intermediate terms. The long term is much more certain as charts, moving averages, and key indicators show that the stock is in a relentless uptrend. In terms of the fundamentals, Meta’s recent earnings release was strong, but growth was still not that impressive by historic standards. In addition, I determine that valuation multiples are a bit high considering its modest growth and I conclude that the stock is moderately overvalued. Now back to the question. I believe in the long term, Zuckerberg still has a strong shot at becoming the world’s richest person, but in the near term, Meta’s mixed technicals and moderately overvalued stock will make it hard for him to dethrone Elon Musk at the top. Therefore, I initiate a hold rating on Meta stock.
Daily Analysis
Chart Analysis
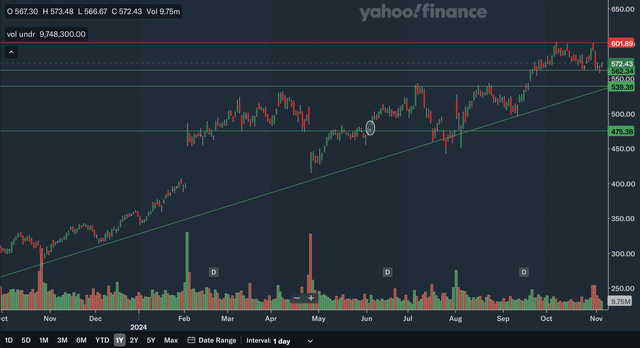
The daily chart is an overall positive one for Meta. The stock remains in a short-term uptrend with many support levels underneath. The only resistance identified is at the psychologically significant 600 area and that line has already been resistance three times in the past month or so. As for support, the nearest area would be in the low 560s as that line has been solid support since late September. Moving down, there is also support at around 540 as that area was resistance multiples times during the year until the stock finally broke out in September. The uptrend line would be the next level of support, and it is also nearing 540 and rising fast. Lastly, there is also distant support at around 475 as that line represents an upside gap that may be support. Although the stock briefly filled this gap, it was a false breakdown and the stock very quickly bounced back and so this support is still likely intact. Overall, I believe this daily chart reflects a strong near term outlook for Meta, as the only negative is the resistance at 600.
Moving Average Analysis
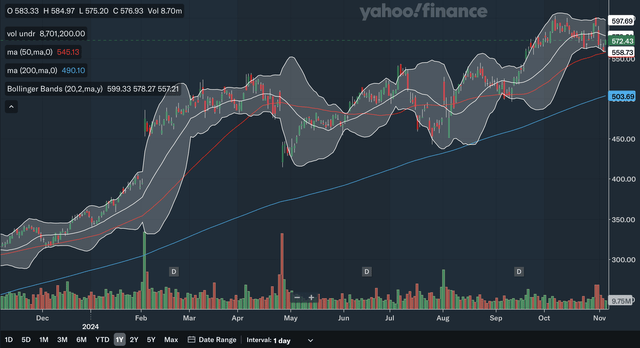
There has been no crossovers between the 50-day SMA and the 200-day SMA in the past year, and the 50-day SMA has stayed on top the entire time. After the gap narrowed in August and September, the 50-day SMA has pulled away a bit recently, showing a resurgence of bullish momentum. The stock currently trades modestly above the 50-day SMA. For the Bollinger Bands, the stock hit the lower band lately, showing it was oversold. However, the concerning sign here is that the stock was not able to hold above the 20-day midline that should have acted as support as we are in an uptrend. This could potentially signal that the uptrend is weakening. In my view, these MAs generally still reflect a positive picture, but investors should monitor the Bollinger Bands to see if the stock can regain the midline as an indication of strength.
Indicator Analysis
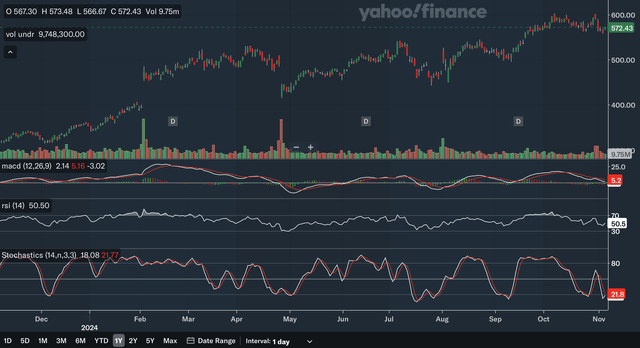
The MACD crossed below the signal line back in early October and recently bounced off and failed to cross above it, a bearish indication. There is also some negative divergence with the MACD. As the stock made new highs recently, the MACD was not able to record a higher reading than back in February of this year, casting doubt on the validity of the recent bull run. For the RSI, it is currently at 50.5 after being below 50 recently. The 50 level is an important level as it shows whether the bears or the bulls have more control, and so Meta flirting with the line could mean danger for the stock. The RSI too shows a bit of the negative divergence discussed above as it too failed to break the February peak recently. Lastly, for the stochastics, the %K is below the %D which is bearish, but the improving trajectory of the %K could mean that a bullish crossover could soon occur. In my view, as a whole, these indicators show that there are some near term weakness in Meta stock and the uptrend could be in trouble as negative divergence signs appear.
Takeaway
There are some mixed signs in the daily analysis. I would say the stock has a slightly positive short term technical outlook as there are concerning signs of weakness despite the stock remaining in an uptrend. The chart is relatively positive, but the worrying signals in the Bollinger Bands and the other indicators should be red flags for investors.
Weekly Analysis
Chart Analysis
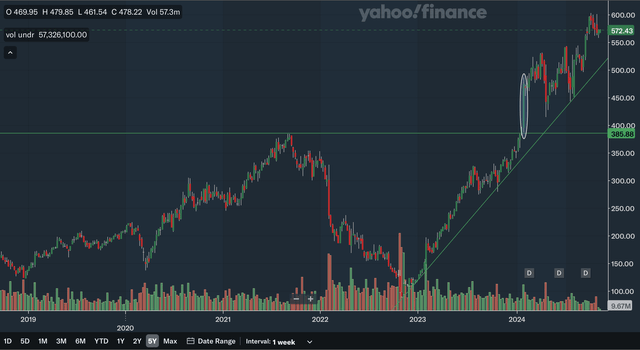
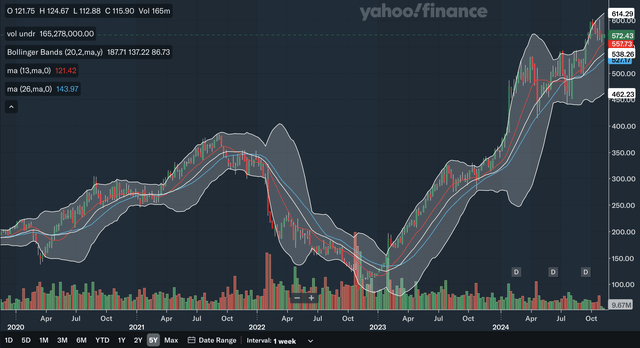
The weekly chart is a relatively simple one. The stock remains in an intermediate term uptrend that dates back to late 2022. There are no areas of resistance to speak of. The nearest support level would be the uptrend line that is currently nearing 525 and sloping upward quickly. We also have support at around 385. This area was key resistance back in 2021 and this year a major upside candle occurred as the stock crossed above this line, showing that this level is highly significant and would be support if the stock slumps. I believe this weekly chart is a bullish one, as there is really not much to complain about here.
Moving Average Analysis
The 13-week SMA crossed above the 26-week SMA back in early 2023 and the stock has surged since then. Earlier in the year, the gap between the lines narrowed to the point that a crossover nearly took place. The gap has widened since then, showing that bullish momentum has returned to the stock. Meta currently trades a bit above the 13-week SMA that is providing support at 557 and still rising. As for the Bollinger Bands, the stock recently rose above the upper band, showing it was a bit overbought and was due for a pullback. The 20-week midline is currently at 538 and should be support as this intermediate term uptrend continues. The stock did drop below this midline during the middle of the year, reflecting the relative weakness during that period. In my view, these MAs confirm that the intermediate term uptrend is strong.
Indicator Analysis
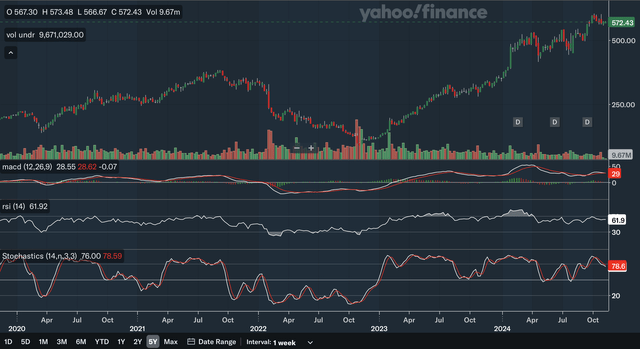
Currently, the MACD is virtually at the same level as its signal line after being above it recently, showing that a bearish crossover could occur. The even more worrying sign is the major negative divergence on the weekly chart. The stock made a new high in October that far exceeds the peak early in the year, but in October, the MACD was far below levels seen back then. The RSI also shows this significant divergence, as the stock did not even enter the 70 zone during its latest rally to all-time highs. The RSI is currently at 61.9 and has not dropped below 50 this year, meaning that the bulls have been relatively in control. Lastly, for the stochastics, the %K crossed below the %D line within the overbought 80 zone in early October and recently failed to cross back above, a highly bearish indication. Overall, similar to the daily indicators, there are many red flags here as there are both nearer term bearish signals as well as longer-term negative divergence that should make investors question Meta’s bull run.
Takeaway
Again, the three analyses had mixed signals, but I would still say that it was slightly in Meta’s favour. The chart shows that the stock remains in a strong uptrend, while the MAs and Bollinger Bands were also bullish. However, the indicator analysis was concerning as there were highly bearish signals present. Investors should practice high caution even if the intermediate term as a whole is still positive.
Monthly Analysis
Chart Analysis
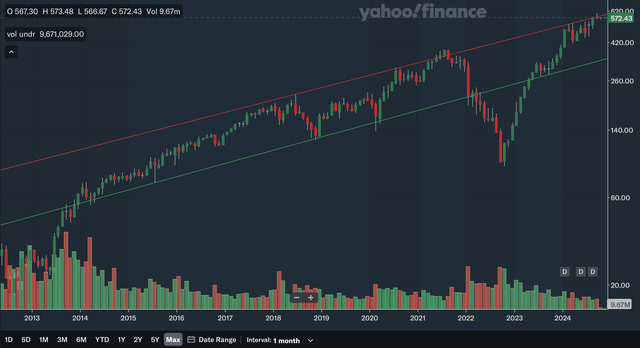
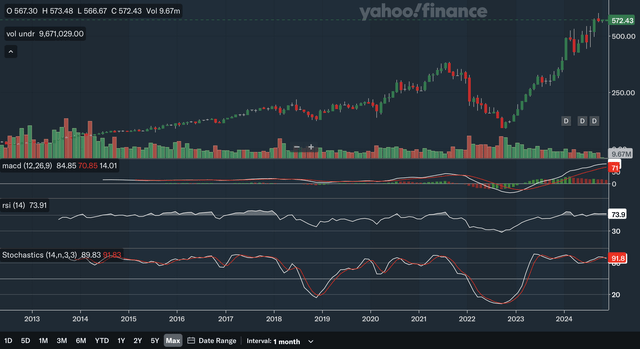
Note that the above chart is in a logarithmic scale to better show Meta’s long-term trend. As you can see, the stock remains in an upward channel. The bottom channel line dates back to 2014 and despite the breakdown in 2022-2023, this line seems to be an important level as it acted as support in the second half of 2023. The upper channel line dates back to 2018 and the stock has not had a successful breakout over this line as of now. The stock is currently right at the upper channel line and so the stock may either break out or pullback in the near future. However, even if the stock was to remain bound within this upward channel, it could still have room to run since the channel is rising quite quickly. In my view, this chart is worthy of monitoring for investors since whether the stock can breakout or not may be of significant consequence.
Moving Average Analysis
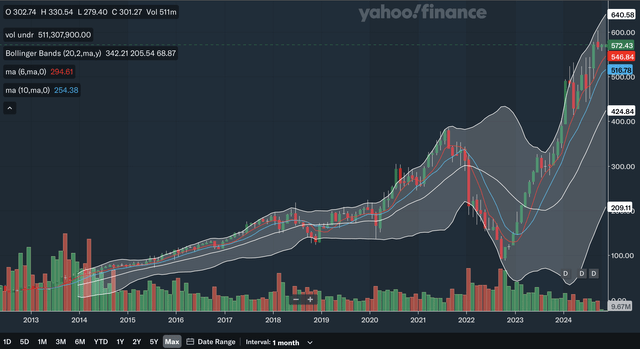
The 6-month SMA had a bullish crossover with the 10-month SMA back in early 2023 and has remained above ever since. The gap between the two lines had narrowed on two occasions and right now, the gap is at a moderate size, indicating average levels of bullish momentum in recent months. The stock is also moderately above the 6-month SMA, with the SMA currently at 546. For the Bollinger Bands, the stock has remained consistently in the upper quarter of the bands since mid-2023. This demonstrates that the bullish momentum has been sustained and that the bulls have been relentless. The midline offers distant support as it is only at 424. From my analysis, the monthly MAs’ strength supports the long-term uptrend and could make the case for a channel breakout as discussed in the chart analysis.
Indicator Analysis
The MACD had a bullish crossover with the signal line back in early 2023. The gap between the lines has been healthy, despite slightly narrowing as of late. A bearish crossover could occur in the distant future but is not a major concern right now. There is also no negative divergence with the monthly MACD as it is currently at an all time high for Meta. For the RSI, it is currently at 73.9 and has been above 70 basically YTD, indicating that the bulls have been relentless. There is some negative divergence with the RSI but to a much lesser degree than in the daily and weekly analyses. The current RSI is a minor amount below the RSI peak of early this year but this signal is not too concerning in the grand scheme of things. Lastly, for the stochastics, the %K just crossed below the %D and that could be a bearish signal but note that there were multiple bearish crossovers this year, but the stochastics never managed to fall below the 80 mark. This indicates that the bullish momentum has been sustained and that the bearish crossovers were generally weak signals. In my view, these monthly indicators are much stronger than their daily and weekly counterparts and signals that the long term is still very bright for Meta stock.
Takeaway
Unlike the daily and weekly analyses, the monthly analysis is overwhelmingly positive, as all analyses points toward a strong long-term technical picture for Meta. The chart shows we are in a strong upward channel and the stock may even be nearing a breakout that would see the stock enter an accelerated uptrend. The MAs were strong and confirm the uptrend, while the indicators were actually bullish for the monthly charts.
Fundamentals & Valuation
Earnings
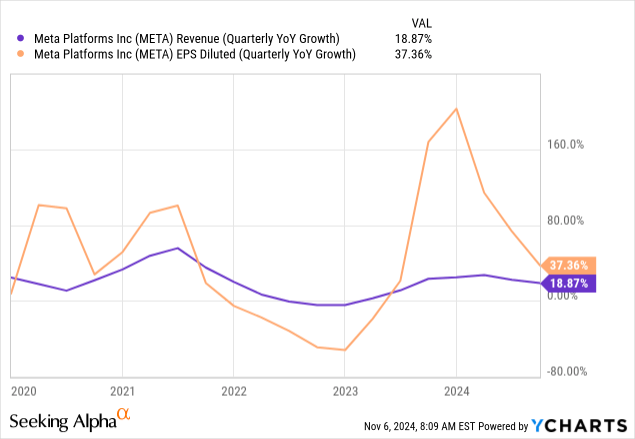
In late October, Meta reported its 2024 Q3 earnings and the results were generally strong. They reported revenues of $40.589 billion, up 19% YoY and an EPS of $6.03, up an impressive 37% YoY. Both of these figures beat expectations as revenue beat by $159.52 million and EPS beat by $0.74. However, as you can see in the chart above, although growth rates remain satisfactory, they have receded significantly from the end of last year. Both revenue and EPS are growing at what seems to be slightly below average levels currently. Other highlights in their earnings include their operating margin being 43%, up from 40% in the prior year period and a total Family Daily Active People of 3.29 billion in September, up 5% YoY. Overall, in my view, earnings were resilient, but their growth has not been that extraordinary.
Valuation
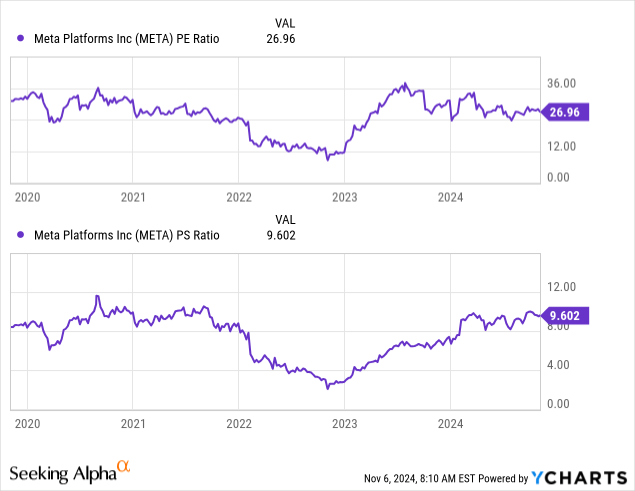
Currently, the P/E and P/S ratios for Meta are relatively on the high side after significantly rebounding from 2022 lows. The P/E ratio is currently at around 27 after being under 12 in 2022. The P/S ratio is currently at 9.6 after falling near 2.0 in 2022 as well. Both of the ratios are, however, also a bit off the 5-year highs as the P/E remains below the 36 level seen in 2023 and the P/S remains below the near 12 level seen in 2020. If you look closely at the EPS and revenue chart above and compare it to the valuation multiple charts, you can see that the valuation multiples have generally moved with the growth rates. However, while current growth rates look like they are slightly below the average of the past five years, the P/E and P/S ratios are currently at an average or slightly over the average of the past five years. Therefore, I believe Meta stock is moderately overvalued at current levels, as the current growth rate does not justify the valuation multiples being at this level. Seeking Alpha currently has a D valuation rating for Meta stock, confirming my analysis that it is overvalued.
Conclusion
The short-term and intermediate term technical pictures are quite mixed, and so shorter term investors may not see a favourable risk/reward at current levels. The long term is much brighter as the analyses converge to the result that Meta is in a strong uptrend. For the fundamentals, their latest results beat expectations and showed satisfactory growth, but with valuation multiples at a relatively high level, I believe the stock is moderately overvalued relative to its growth. Since the technicals themselves are mixed and the stock is relatively expensive, I would say the stock is only a hold for now. Zuckerberg still has a shot at becoming the world’s richest person in the long run, but in the near term, Meta stock seems unlikely to propel him to the world’s net worth summit.
Analyst’s Disclosure: I/we have no stock, option or similar derivative position in any of the companies mentioned, and no plans to initiate any such positions within the next 72 hours. I wrote this article myself, and it expresses my own opinions. I am not receiving compensation for it (other than from Seeking Alpha). I have no business relationship with any company whose stock is mentioned in this article.
Seeking Alpha’s Disclosure: Past performance is no guarantee of future results. No recommendation or advice is being given as to whether any investment is suitable for a particular investor. Any views or opinions expressed above may not reflect those of Seeking Alpha as a whole. Seeking Alpha is not a licensed securities dealer, broker or US investment adviser or investment bank. Our analysts are third party authors that include both professional investors and individual investors who may not be licensed or certified by any institute or regulatory body.

