Summary:
- Amazon’s Q3 2024 results show strong revenue and profit growth, driven by AWS and its advertising business, indicating effective cost management and consistent profitability.
- Regression analysis reveals that consumer spending, inflation rates, and GDP growth significantly impact Amazon’s revenue, with a positive outlook for these economic variables in 2025.
- Technical analysis indicates a bullish momentum for Amazon’s stock, supported by rising moving averages and MACD, making it a buy for growth and momentum investors.
- Despite being above fair value, Amazon remains a hold for value investors, with potential premium gains for those with a high-risk appetite.
Jonathan Kitchen
Investment Thesis
On August 9, 2024, I published a bullish article on Amazon.com, Inc.(NASDAQ:AMZN) (NEOE:AMZN:CA) where I reiterated my buy rating for the stock following the sell-off that had presented a buying opportunity. Since that coverage, the stock has gained 19.89%, outperforming the S&P 500 by double digits.
Seeking Alpha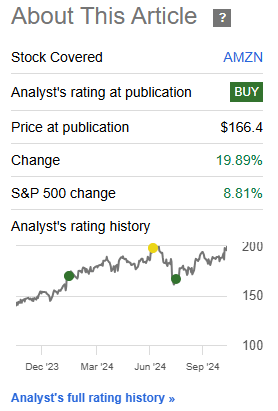
While Amazon’s MOAT discussed in my previous article remains intact as its long-term growth driver, in this follow-up coverage, I will dive deeper into the exact economic variables that will impact this company’s growth. In addition, I will reflect on the Q3 2024 performance and put it into perspective. Lastly, I will do a technical analysis to establish the outlook of this stock technically.
Given the scope of my analysis, I still find AMZN to be a good investment opportunity for growth and momentum-oriented investors. This is because, based on a regression analysis, the economic climate points out a bright growth outlook for this company, and the technical analysis shows a strong bullish momentum. This justifies a buy decision for both growth and momentum investors. For value-oriented investors, AMZN is a hold at the moment, having mitigated the 15% margin of safety estimated in my previous analysis.
Q3 2024 Put In Perspective
AMZN reported its Q3 2024 results on 31, October 2024. From the results highlights, the company demonstrated a strong quarterly performance. To begin with, revenue came in at $158.9 billion, an 11% growth YoY. Its operating income and net income were $17.4 billion and 15.3 billion, marking a YoY growth of 56% and 55% respectively. On the other hand, its operating cash flow grew by 57% YoY to $112.7 billion on a TTM basis. In a nutshell, the company reported excellent results both in the top and bottom lines.
This impressive performance was primarily contributed by the solid growth in the company’s two major growth areas I conclusively discussed in my previous articles, the AWS and the new growth powerhouse, the advertising business. In the MRQ, AWS reported a double-digit growth of 19.2% and so was the case with the advertising segment which saw revenue growth of 18.8%. This implies that these two major growth areas are consistently fuelling Amazon’s top-line growth.
On the other hand, the massive growth in the bottom lines was realized through a combination of factors. That is, a strong revenue growth and effective cost control, as I will demonstrate shortly. Given this quarterly performance, let’s reflect on the last 7 quarters to put into perspective. In this analysis, I will consider revenue, expenses, and net income to assess the trajectory. Below is the raw data and graphical representation of the same.
Author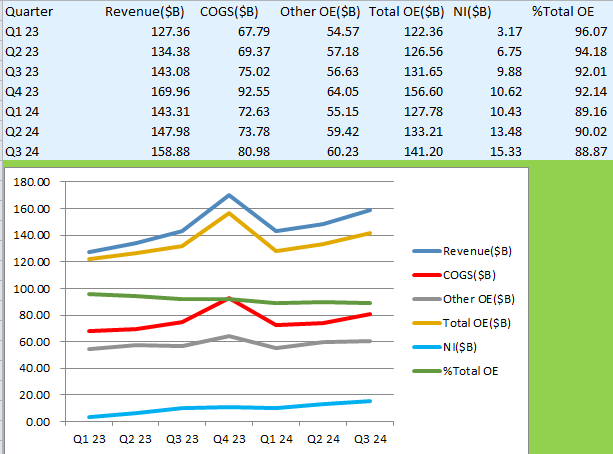
From the above analysis, there are key takeaways. First off, AMZN has been consistent in growing its revenues. Although Q1 2024 appears to have distorted what could have been a continuous QoQ revenue growth, it should be noted that it marked a revenue growth of 12.53%, perhaps making its revenue cycle cyclical and Q1 being its low season. I believe this can be attributed to the low consumer spending in the early stages after the December festivity, among other factors.
Secondly, although the cost of goods sold [COGS] appears to be increasing the sales growth, its slope is evidently lower than that of the revenue, speaking about the company’s effective cost control in relation to revenue generation. The cost management aspect is also affirmed by what appears to be a horizontally moving curve of the other operating expenses [other OE]. This implies that AMZN has kept its other OE relatively stable while increasing its revenues. This alludes to its effectiveness in cost management.
Most importantly, the test of cost control is clearly presented through computation and a plot of total operating expenses as a percentage of revenue, [% Total OE]. The company has managed to minimize its total cost as a percentage of revenue from as high as 96% in Q1 2023 to its lowest value in the MRQ of about 88.9% demonstrating that indeed the company has effectively managed its costs and that has been replicated in the consistently improving and upward sloping net income [NI] curve. In other words, the company’s profitability has been improving consistently over the last quarter, and this has resulted from its consistent revenue growth and effective cost management. In a nutshell, Q3 2024 is a story of continued growth which is gaining momentum.
To support this strong financial performance, I worked on its Economic value added [EVA], which sought to quantify AMZN’s residual wealth generated above the cost of capital. In other words, EVA assesses a company’s true economic profit, confirming whether or not the organization is creating value for its shareholders. It is calculated using the following formula:
EVA = NOPAT – (Invested Capital*WACC)
Where:
NOPAT is net operating profit after taxes.
WACC is the weighted average cost of capital.
In this analysis, I compare its EVA to that of BABA, one of its greatest peers, to establish which company has created the highest value for its shareholders in the TTM. I adopted WACC from value investing in this analysis, and below is the output.
Author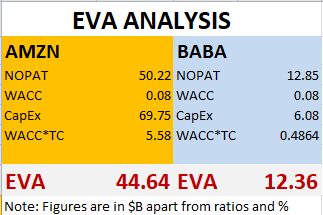
From the above results, both companies have a positive EVA meaning that they have created value for their shareholders. However, AMZN has the highest EVA at $44.64 billion implying that it has created $44.64 billion in value above its cost of invested capital. This value reflects the company’s good financial health and efficiency since it means that it is not only covering its cost of capital but also generating significant returns to its shareholders. With Amazon expected to spend $96.4 billion in CapEx in 2025, investors can only expect higher returns.
The Economics In AMZN Growth: Regression Model
1. Background
While I agree with other analysts that AMZN’s growth is steered by its impressive performance in AWS and advertising segment all under the umbrella of its MOAT, a fact we cannot run away from is that all discretionary stocks/companies’ growth is subject to the economic climate. This implies that Amazon’s intrinsic growth strengths are a function of the broader economic climate.
Given this background, I find three major economic variables that have been influencing AMZ’s growth in the past and that will keep influencing its future growth. These variables are consumer spending, inflation rates, and GDP growth. In this section, I will give an overview of how these variables affect discretionary companies’ performance where AMZN is not excluded then run a multiple linear regression model to establish how these variables have impacted Amazon’s growth and assess the outlook of the company based on the output of the model.
2. Introducing The Variables
Let’s begin with the first variable, consumer expenditure [CE]. CE is a major driver for growth in discretionary companies and, for that matter, retail companies like Amazon. These companies rely heavily on consumer expenditure for their revenue. When consumers have higher disposable income and are willing to spend, companies like Amazon experience significant growth in the top and bottom lines because of the higher sales volume which also sees fixed costs spread over a larger number of units sold, and vice versa.
Inflation rate is the next variable in my model. Inflation to a greater extent affects the purchasing power of consumers. When commodity prices go up, consumers tend to have a constricting purchase basket from the same budget line, something that leads to a slim budget for discretionary items as the consumer would prioritize essential commodities. Conversely, a lower inflation rate boosts the consumer purchasing power resulting in increased discretionary spending, thus a higher revenue growth for discretionary companies.
The last variable under consideration is GDP growth. When GDP grows, it leads to higher employment rates and wage growth. This implies that consumers have more disposable income, which boosts their discretionary expenditure. In addition, a growing economy strengthens consumer confidence. Basically, when consumers are optimistic about their future financial and economic status, they are more likely to spend on discretionary items.
In light of this background, I ran a multiple linear regression analysis to determine how these factors have been impacting Amazon’s growth over the last ten years. In my analysis, my dependent variable(Y-variable) was Amazon’s revenue, while the independent variables(X-variables) are three economic indicators discussed above. For the economic data, I obtained it from Macrotrends while for AMZN’s revenue, I got it from Seeking Alpha.
While a larger sample size is mostly admirable, I settled for 10 years data for several reasons. The first reason is data availability, whereby 10 years time frame is the maximum number of years I can easily access the financial data for Amazon from reliable sources like seeking alpha. Secondly, I opted for 10 years so as to maintain relevance to current trends. Thus, sample size captures more recent trends which are more relevant in current decision-making. Lastly, the other reason as to why I opted for a 10-year time period is to maintain the impacts of recent regulations and policy changes on the economy, something that can hardly be achieved through using older data.
3. Let’s Model This
Following the above introduction, I ran the model at a 95% confidence interval. My model assumptions are that the Y and X variables have a linear relationship and that the Y variable’s reaction to changes in any X variable is always independent of the other variables in the model. Below is the output.
Author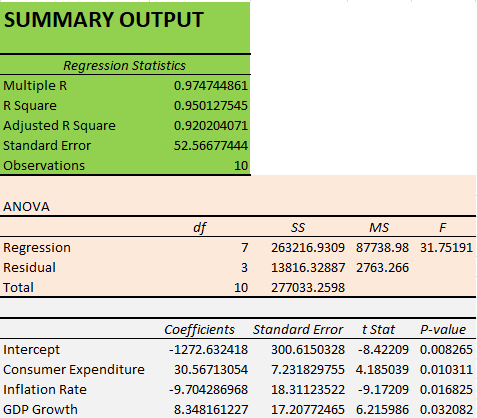
From these results, the model has an adjusted R square of 0.950 implying that it explains 95% of the variability in the dependent variable, thus making it a good fit for this analysis. This is so because a higher adjusted R square means that the model explains a greater percentage of the variation. Furthermore, all t-stat values are greater than 2 for positive correlation and greater than -2 for negative correlation and p-values are less than 0.05, implying that all variables are statistically significant and thus reliable predictors of the dependent variable.
Moving to the respective variables, consumer expenditure and GDP growth have positive beta coefficients, meaning that they have a positive relationship with revenue growth. This means that revenue increases with an increase in these variables. For inflation rate, the coefficient is negative, meaning that it has an inverse relationship with revenue growth for Amazon. This means that revenue decreases with an increase in inflation rates.
More precisely, the size of the coefficient marks its magnitude. The larger the value, the stronger the effect it has on the Y variable. Consequently, consumer expenditure has the highest magnitude while GDP growth has the lowest magnitude. This is to say, that consumer expenditure is the major determinant of Amazon’s growth. Notably, coefficients are expressed in the units of the Y variables per unit of the X variable. For instance, considering that my Y-variable is revenue ($), it follows that a coefficient of 30.57 for consumer expenditure(X-variable) implies that for every additional unit spent by consumers, Amazon revenue increases by about $30.57. The same applies to GDP and inflation rate, only that for inflation rate, revenue decreases with the respective magnitude due to the inverse relationship.
4. The Outlook
Given the above output, let’s assess the future projections to see what lies ahead for this company. According to the NIQ report, consumer spending is projected to grow by 6% in 2025 pointing out a bright outlook for Amazon’s main growth factor. On the other hand, according to the International Monetary Fund, global inflation is projected to decline from about 5.9% in 2024 to about 4.5% in 2025. This implies that the negative effect of this variable on Amazon’s revenue growth will decline, giving its growth trajectory an upward momentum. On the other hand, a lower inflation rate would translate to arguably lower running costs, thus improved profitability margins. Lastly, the IMF has projected a global GDP growth of about 3.2% in 2025, painting a bright outlook on this growth variable for AMZN in 2025.
In a nutshell, with AMZN’s major growth factors having a bright outlook and its major growth headwind subsidizing, AMZN has a promising growth outlook which would add to the current strong growth momentum discussed in the previous section. Consequently, I think this stock is a buy for growth-oriented investors.
Technical Analysis
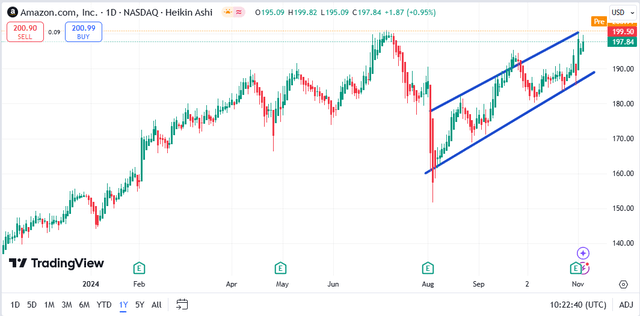
After what was a pullback from Amazon’s previous bullish rally, the stock has entered into an ascending channel, which is a bullish configuration.
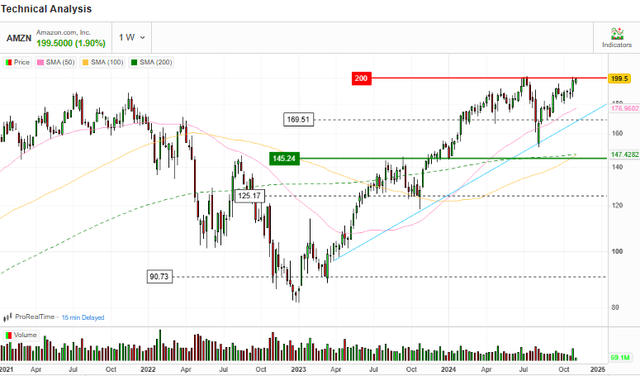
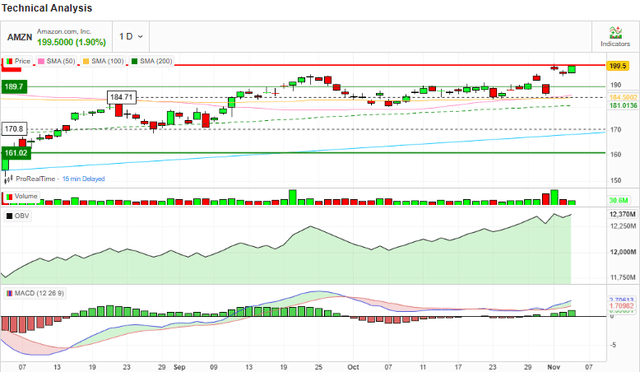
Several technical indicators show that the current bullish run is gaining momentum. First off, there is an apparent bullish divergence between the 50-day MA and 100-day MA with the former growing faster than the latter. Both are trending upwards and this shows that the upward trend has a strong momentum and is likely to continue.
In addition, the MACD is exhibiting a bullish divergence with its signal line, a confirmation of the growing upward momentum. This has been confirmed by the rising OBV. An upward-moving OBV signifies that the upward trajectory is gaining traction because the higher volume on up days outweighs the down days and thus the buyers are confident.
Based on this analysis, it is evident that this stock is in a strong upward momentum which justifies a buy decision for momentum-oriented investors.
Risks
In my previous analysis, I ran a DCF model, whereby I arrived at a fair value of about $187. Considering that the assumptions in that model haven’t changed significantly to affect my estimated fair value significantly, it then follows that this stock has exploited the estimated margin of safety. This implies that the current bullish run is happening above the fair price, where the stock is susceptible to market corrections and pullbacks. Potential investors should be aware of these risks before investing here.
Another risk if investing here is the company’s heavy CapEx in 2025. AMZN is expected to spend about $75 billion on CapEx next year. This would have an impact on its cash flow something that can affect its financial flexibility in the short-run. Further, if the company decides to finance this CapEx through debt, it could lead to higher interest expenses impacting its cash flow in the future.
Conclusion
In conclusion, Amazon is a good investment opportunity for growth-oriented investors, as shown by my regression model backed by the bright outlook. Technical analysis has also shown that this stock is in a strong upward momentum, making it a good pick for momentum investors. However, given that the stock is above the fair value, I believe this is a hold for value-oriented investors to capitalize on the premium gains from the anticipated future growth. Nevertheless, value investors with a high-risk appetite can still buy at this level to benefit from the potential premium gains. The bottom line is that AMZN is a decent buy for growth and momentum investors.
Analyst’s Disclosure: I/we have no stock, option or similar derivative position in any of the companies mentioned, and no plans to initiate any such positions within the next 72 hours. I wrote this article myself, and it expresses my own opinions. I am not receiving compensation for it (other than from Seeking Alpha). I have no business relationship with any company whose stock is mentioned in this article.
Seeking Alpha’s Disclosure: Past performance is no guarantee of future results. No recommendation or advice is being given as to whether any investment is suitable for a particular investor. Any views or opinions expressed above may not reflect those of Seeking Alpha as a whole. Seeking Alpha is not a licensed securities dealer, broker or US investment adviser or investment bank. Our analysts are third party authors that include both professional investors and individual investors who may not be licensed or certified by any institute or regulatory body.

