Summary:
- Northrop Grumman’s revenue per share has grown at 9.42% annually, since FY 2014; however, its gross profit margin and return on invested capital have shown concerning trends.
- The company pays a quarterly dividend of $2.06, with a current yield of 1.58%, and has room for future dividend growth.
- Recent earnings report showed a 13% increase in EPS and positive segment performance, leading to a 3% stock price rise.
- Valuation suggests NOC is trading at a 14% discount to fair value, making it a Buy with a long-term expected return of 34.12%.
Sundry Photography
Company Description
Northrop Grumman Corporation (NYSE:NOC) is a defense contractor that operates in four segments, Aerospace Systems, Defense Systems, Mission Systems and Space Systems. The company has a current market cap of just over $76 billion and employs a little more than 100,000 people. Over the past 35 years, the stock has had a total return of more than 15,000% resulting in a market-beating CAGR of 15.5%.
Quality
In my opinion, there are three important quantitative characteristics all high-quality businesses share. They are an increasing revenue stream, a steady gross profit margin, and a healthy return on invested capital.
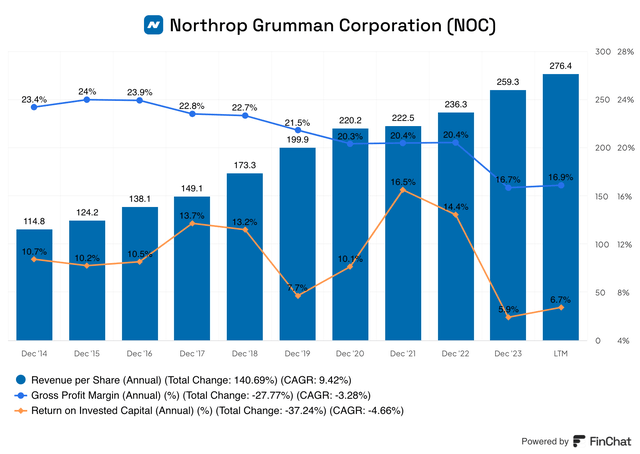
NOC’s revenue per share has grown at a consistent rate over the past decade of 9.42% annually. This has occurred via a combination of their revenue rising in total by about 64% since FY14 when compared to FY23, coupled with their shares outstanding decreasing from nearly 200 million in 2014 to about 145 million in the most recent fiscal year. Although revenue has been trending higher, the company has still had some years where total revenue dropped, albeit minimally, this is something investors should keep an eye on.
The company’s gross profit margin has slowly been trending lower over the past decade. What’s most alarming is that, up until FY 2023, Northrop had maintained a gross profit margin above 20%; however, in 2023 this dropped by about 20% from FY 2022 to just 16.7%. Although it was just one year where it dropped rather sharply, this metric has overall been trending lower. Ideally, NOC can work to improve their GPM in the coming years and get it back north of 20%.
The return on invested capital has fluctuated quite a bit over the past few years. From 2014 through 2018 this metric was fairly stable, between 10.2% (2015) and 13.7% (2017). In 2019, it dropped to 7.7% before climbing the next two fiscal years to 10.1% and 16.5%, respectively. Since its chart high of 16.5% in 2021 its ROIC has plummeted to just 5.9% in the most recent fiscal year. Hopefully, NOC can improve and stabilize its ROIC to a consistent and predictable level in the very near future.
Overall, these metrics are a mix between good and needs to improve. The company has grown revenue per share, even with some down years in total revenue, which is a positive. However, the GPM has been trending lower and their return on invested capital has been inconsistent at best. In my opinion, NOC has some work to do, but with some focus and discipline, the company should be able to improve some of their struggling metrics and provide shareholders with above-average returns.
Dividend
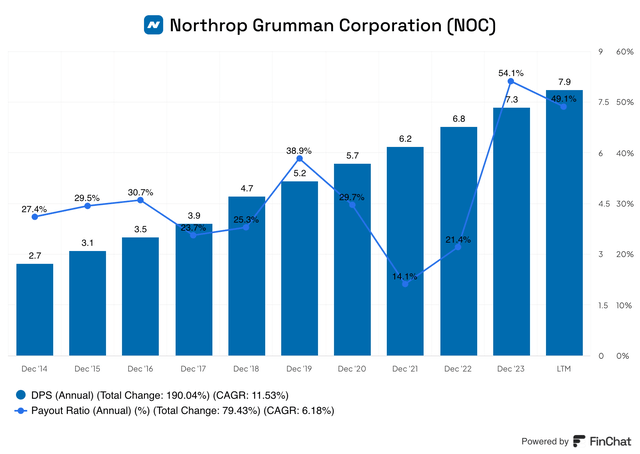
Northrop Grumman currently pays a quarterly dividend of $2.06 per or $8.24 annually, equating to a current yield of about 1.58%. Earlier this year, NOC raised its dividend 10.2% from $1.87 to the aforementioned $2.06. This increase was only slightly below the company’s 10-year average of 11.53%, but slightly above its 3-year and 5-year averages, which sit at 9.18% and 9.29% respectively. NOC has also been able to keep its payout ratio quite low over the past decade. From a low in FY 2021 of just 14.1% to a high in the most recent fiscal year of 54.1%, the company has sufficient room to continue its dividend growth well into the future.
Past Performance
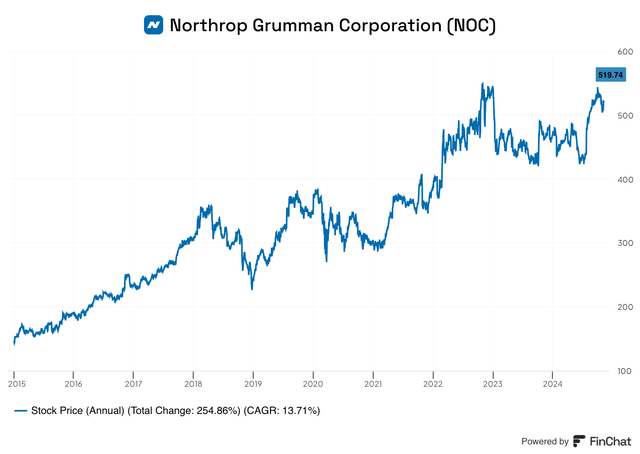
As previously mentioned, Northrop Grumman has a very healthy long-term CAGR of 15.5%. Over the past decade, the stock has performed slightly below that, returning a little more than 250% or a respectable 13.71% annually. In late 2022, the stock reached an all-time high near $556/share before dropping rapidly in early 2023 by nearly 20%. Following that decline, the stock fluctuated between approximately $430 and $490 per share, until August of this year when it surpassed $500 again for the first time since 2022. Over the past year, NOC has risen about 11% and currently sits at $520 a share. Although the stock is lagging the market over the past year, we will examine where the stock may go later in this article.
Earnings History
Approximately two weeks ago, Northrop Grumman announced their Q3 earnings with EPS of $7.00 which beat estimates by $0.94 on revenue of $10B, which missed by $170 million.
The earnings per share increased by 13% from the corresponding time period last year, where the company had an EPS of $6.18. This increase is mainly attributed to a 9% increase in net earnings, with a reduction in shares outstanding making up the remaining difference.
Segment results for the Aeronautics Systems were an increase in revenue of 4% to $2.878B, as well as a slight increase in the segment’s operating margin of 0.2% to 10.4%. The increase in revenue can be credited to higher F-35 production volume, which was a result of a variety of factors.
The Defense Systems portion of the business saw revenue increase by $34M to $2.084B for the quarter. Higher volume on the Sentinel program and certain ammunition programs led to this increase, which was also offset by a decrease in volume for a couple of training programs.
The Mission Systems section of the company saw the best increase in revenue of 7% from $2.628B in 2023 to $2.823B in 2024. Additionally, operating income also rose 1%; however, the operating margin dipped nearly 1% to 13.8%. This decrease in the operating margin was driven lower by net estimated contract earnings adjustments as well as changes in contract mix toward cost-type.
The final segment, Space Systems, saw revenue decrease 3% to $2.87B from $2.953B. Conversely, operating income surged 14% to $345M from about $300M, thanks to a higher operating margin rate of 12% which more than offset the sales decrease.
The company offered updated full-year 2024 guidance, which estimated revenue in the range of $41 to $41.4 billion. Management increased the low end of the company’s segment operating income to $4.525B from $4.5B. Additionally, the mark-to-market adjusted EPS range was also raised to $25.65-$26.05 from $24.90-$25.30. Lastly, management projects free cash flow for FY 2024 to be between $2.25B and $2.65B.
Overall, the earnings report was well-received by the market with the stock climbing roughly 3% following their release.
The full press release can be read here, and the investor presentation can be seen here.
Valuation
The last consideration as to whether or not NOC is a good investment right now is to determine if it is attractively valued today, and to do so, we can examine it from a free cash flow perspective.
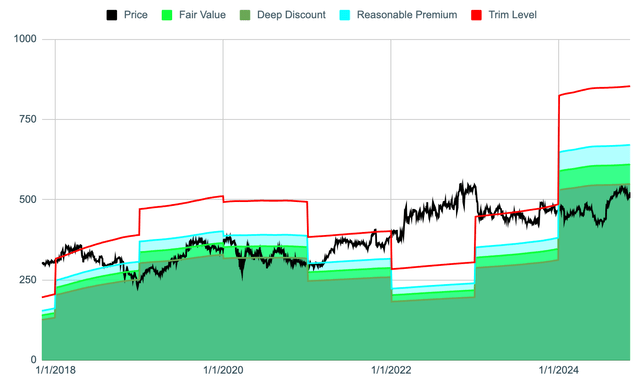
The custom valuation tool suggests Northrop Grumman is trading at an approximate 14% discount to its fair value. After the company’s free cash flow surged in 2018 and 2019 by 53% and 20% respectively, the company saw multiple years of declines from 2020 through 2022. In 2023, NOC saw a robust increase in FCF of nearly 50% and thus far in 2024 FCF sits at $23.51/share, and it appears the stock price hasn’t quite caught up yet.
As you can see from the chart, the valuation model rates Northrop Grumman as a buy, as it seems, the stock is possibly undervalued.
NOC currently has a long-term expected rate of return of 34.12%. The components of this estimate are as follows: a dividend yield of 1.58%, a return to fair value factor of 2.66%, and future estimated EPS growth of 29.89%. Northrop appears to be trading for an attractive valuation as of this writing, the main question to consider is whether or not the company has the ability to meet the growth rate estimated by analysts. In my opinion, the potential benefit outweighs the risk at this time, and investors should consider making room for NOC in their portfolios.
Analyst’s Disclosure: I/we have no stock, option or similar derivative position in any of the companies mentioned, and no plans to initiate any such positions within the next 72 hours. I wrote this article myself, and it expresses my own opinions. I am not receiving compensation for it (other than from Seeking Alpha). I have no business relationship with any company whose stock is mentioned in this article.
Seeking Alpha’s Disclosure: Past performance is no guarantee of future results. No recommendation or advice is being given as to whether any investment is suitable for a particular investor. Any views or opinions expressed above may not reflect those of Seeking Alpha as a whole. Seeking Alpha is not a licensed securities dealer, broker or US investment adviser or investment bank. Our analysts are third party authors that include both professional investors and individual investors who may not be licensed or certified by any institute or regulatory body.
