Summary:
- Tesla, Inc.’s Q3 earnings report and the presidential election outcome led me to upgrade my rating from SELL to HOLD.
- Q3 deliveries showed improvement, with Tesla producing its 7th million vehicles.
- In particular, Wright’s Law analysis indicates TSLA’s production data is converging to the trend line after a few years’ deviation.
Thitima Uthaiburom/iStock via Getty Images
TSLA’s catalyst: Q3 earnings and Trump win
My last coverage on Tesla, Inc. (NASDAQ:TSLA) was titled “Tesla: China Stimulus Already Priced In.” To provide a background, the article was published on October 1, 2024, when the stock was priced at a temporary peak of around $260 per share. The goal of the article was to caution investors about the impacts of China’s. The article rated the stock as a SELL and recommended profit taking at that price based on the following considerations:
Tesla, Inc. stock prices rallied in tandem with the China stock market, both advancing more than 20%, in the past month. China’s recently announced stimulus policies are the key driver for both in my view. However, the potential benefits from these policies for Tesla are overestimated and already priced in. At these price levels, TSLA investors are ill-prepared for the downside risks.
Since then, that stock did suffer sizable corrections (to prices as low as around $210). The corrections were finally reversed by two key events turned in my view: the release of its FY Q3 2024 earnings report (ER) and also the outcome of the presidential election. Given these events’ impact on TSLA, the goal of this article is to reexamine the stock, and you will see that this reexamination has led me to upgrade my rating to HOLD under current conditions.
As one of the most analyzed stocks on the Seeking Alpha platform, TSLA’s Q3 ER was examined by multiple articles shortly after the release. Therefore, I won’t cover too much of the basics that were discussed by other authors already (basic financials, new products, etc.). Instead, I will dissect the ER in an angle that has not been covered so far to my knowledge. I will focus on TSLA’s Q3 deliveries and analyze how its costs scale with production via Wright’s law, as detailed in the next section. Towards the end of the article, I will also provide my thoughts on the potential benefits and also uncertainties of the TSLA in the upcoming Trump administration.
TSLA stock: Q3 deliveries in focus
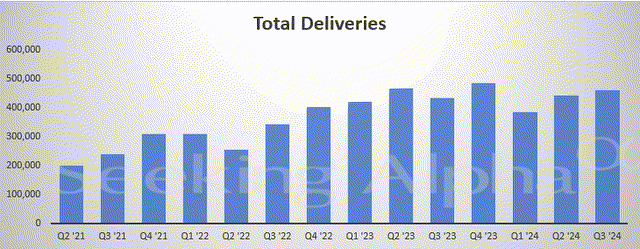
TSLA reported improved data on both production and deliveries in Q3 2024. In particular, CEO Elon Musk announced that the company has produced its 7th million vehicles in the past quarter. To wit, Tesla’s total deliveries have suffered some unevenness in the past 1~2 years, as illustrated by the next chart below. In Q2 ’21, its total deliveries reached 200,000 units, a significant milestone in my view. The company maintained an overall upward trend momentum through Q1 and Q2 of 2023, with deliveries peaking around the half million mark. However, starting in late 2023, the deliveries began to suffer setbacks as seen.
As argued in my earlier articles, the main headwinds are the overcapacity issues in the EV market (specially in its China market), the intense competition from China’s top EV manufacturers such as BYD (OTCPK:BYDDF) as examined in my last article, and also unfavorable commodity prices. The deliveries gradually improved in 2024 as seen.
Next, I will better contextualize the delivery data using Wright’s law.
TSLA stock and Wright’s Law
For readers new to the so-called Wright’s law, the following introduction quoted from ARK Invest should be sufficient for the remainder of my analysis.
The law states that for every doubling of cumulative units produced, the cost of production decreases by a constant percentage that has been observed to the in the range of 10-30%. Theodore Wright made this observation in the aircraft industry first. But the law has since been found to have broad applicability to other industries. As an example, the chart depicts the production data of Ford’s Model T between 1909-1923. The data (those dots) were fitted to Wright’s law. In particular, the slope of this line is ~15%, indicating that Ford’s Model T has been able to achieve a 15% reduction in costs per doubling of cumulative production.
Source: ARK Invest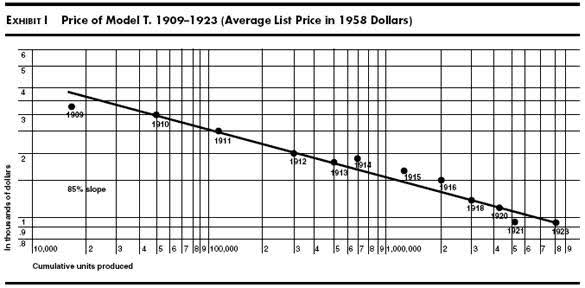
Just to be perfectly clear, I intentionally used “so-called” above, as it is an EMPIRICAL OBSERVATION made by Theodore Wright (1895 ~ 1970). The observation has been found to describe the cost reduction for a range of products. To make the prediction power of this observation more impressive, these products are way ahead of Wright’s time and include the likes of semiconductors and Li-ion battery cells.
Let me also cite two numbers from the chart above before moving on. These numbers will become handy as we examine TSLA’s delivery data via Wrights law. First, as mentioned, the slope is ~15% for Ford’s Model T, which again means that Ford model T was able to achieve a 15% reduction in average unit costs per doubling of its cumulative production. Second, also note that a total of around 8 million units of model T were delivered cumulatively between 1909 and 1923.
TSLA Q3 deliveries examined by Wright’s Law
The next chart below is the key result of my analysis of TSLA’s accumulative delivery data over the years. Given the accumulative nature and also multidimensional nature of the graph, I will walk you through the results step by step in this section. But in essence, it analyzed and presented in the same manner as the T model results above.
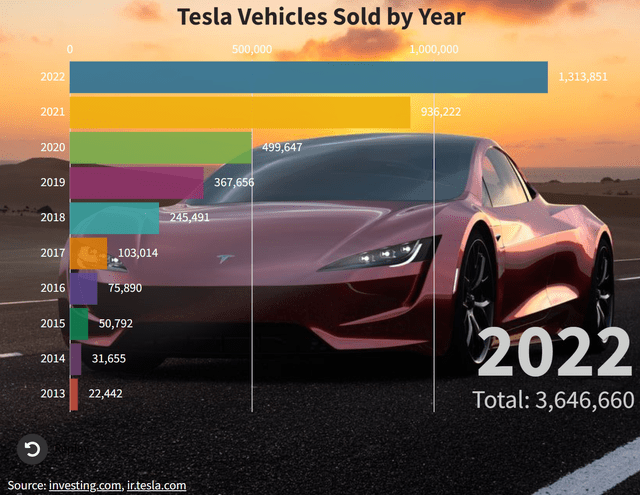
The y-axis shows TSLA’s average unit cost (i.e., cumulative production cost divided by cumulative number of vehicles delivered). The x-axis shows the cumulative number of vehicles delivered since 2013. I gleaned the delivery data between 2013 and 2022 from the investors’ slide below, based on data provided by TSLA’ investors relationship. For data after 2022, I gather them from TSLA’s quarterly delivery data (like those in the first chart used in this article).
Author Source: Investing.com and Tesla Investor Relations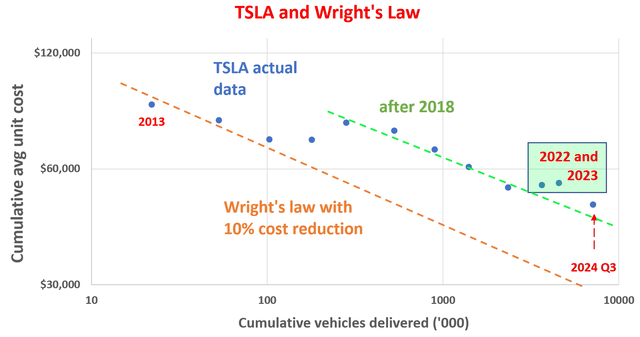
The most obvious observation is that TSLA’s data does not fit into the Wright’s as neatly as the T model data, despite an overall downward trend. The primary reason in my view was the introduction of the gigafactories. In the earlier years, the addition of each of these factories could materially change its cost structure. For these reasons, I grouped TSLA’s delivery data points into two batches and fitted each batch separately. As you can see, each data group fits well with Wright’s Law. The green line is based on data from 2018, when its production structure began to converge to what it is now.
For the data points before 2018, the fitting shown by the orange line has a slope of around 10%, an indication of a 10% unit cost reduction per accumulative production doubling (vs. 15% of model T as aforementioned). For the data points after 2018, the slope is more gradual and less than 10%. This is due to the maturing of its current manufacturing method, in my view. Finally, I want to draw your attention to the delivery data in the most recent 3 years. The delivery data points from 2022 and 2023 are highlighted in the green rectangle. As seen, for these two years, the delivery data noticeably deviated from the trend line, indicating decelerated production growth and also higher production costs.
The latest data point represents the TTM delivery data as of Q3 2024. As seen, the data point is still above the trend line. Given the cumulative nature of Wright’s law, there is quite a bit of inertia in the model, and it will take time to get back to the trend line even if the company is already improving its manufacturing efficiency. Thus, the fact that the data point is now moving toward, not further apart from, the trend line is already a good reflection of TSLA’s technological and logistical leadership in my mind.
Other risks and final thoughts
Another key positive catalyst as mentioned at the beginning of this article is the outcome of the Presidential election this month. TSLA investors interpreted the election of Donald Trump as bullish news for good reasons. The top reason in my mind is the potential changes to environmental policies in the new administration. President-elect Trump might implement relatively relaxed environmental rules (i.e., relative to the other candidate’s platform). These rules could slow down the competitors’ shift to electric vehicles and thus give Tesla a wider window to better consolidate its position in the EV space.
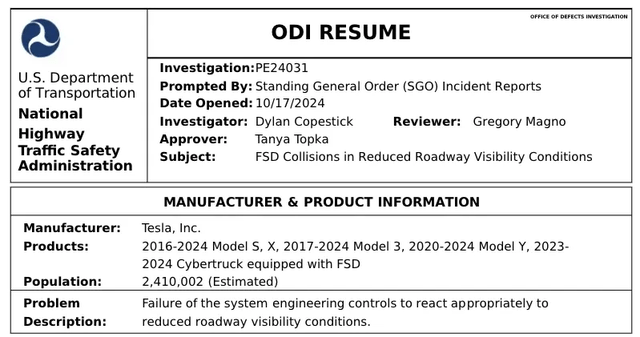
In terms of downside risk, there are also uncertainties with the new administration’s policies on credits and subsidies associated with EV vehicles. Moreover, the stock is currently trading at a lofty valuation (with a FWD P/E of around 110x as of this writing) and thus entails substantial valuation risks. Finally, a crucial part of TSLA’s growth strategy relies on self-driving technologies. This timeframe and outcome of this strategy is quite uncertain in my view. For example, the National Highway Traffic Safety Administration (NHTSA) has recently opened an investigation into Tesla’s Full Self-Driving (FSD) system (see the documents released below). Before this investigation, NHTSA had been scrutinizing Tesla’s driver-assistance system for years already.
All told, I see a much more favorable return/risk profile from the stock under the current conditions compared to the time at my last writing. To recap, the top catalyst on my list that has developed since my last writing was its Q3 delivery data. My analysis indicates that the latest data point to a convergence toward Wright’s law. Secondly, the outcome of the presidential election could also provide a more favorable macroscopic environment for TSLA in the upcoming years. For these considerations, I am upgrading my rating to a HOLD in this article.
Analyst’s Disclosure: I/we have no stock, option or similar derivative position in any of the companies mentioned, and no plans to initiate any such positions within the next 72 hours. I wrote this article myself, and it expresses my own opinions. I am not receiving compensation for it (other than from Seeking Alpha). I have no business relationship with any company whose stock is mentioned in this article.
Seeking Alpha’s Disclosure: Past performance is no guarantee of future results. No recommendation or advice is being given as to whether any investment is suitable for a particular investor. Any views or opinions expressed above may not reflect those of Seeking Alpha as a whole. Seeking Alpha is not a licensed securities dealer, broker or US investment adviser or investment bank. Our analysts are third party authors that include both professional investors and individual investors who may not be licensed or certified by any institute or regulatory body.
As you can tell, our core style is to provide actionable and unambiguous ideas from our independent research. If your share this investment style, check out Envision Early Retirement. It provides at least 1x in-depth articles per week on such ideas.
We have helped our members not only to beat S&P 500 but also avoid heavy drawdowns despite the extreme volatilities in BOTH the equity AND bond market.
Join for a 100% Risk-Free trial and see if our proven method can help you too.
