Summary:
- Disney stock has seen a 25% decline over the past 5 years, with zero price return over nearly a decade, despite reinstating dividends.
- I prioritize profitability and technical analysis, noting Walt Disney’s A+ profitability grade and a promising chart pattern for potential price appreciation.
- I use position sizing to manage risk, considering DIS stock for a 1-3% portfolio position, avoiding heavy exposure around earnings announcements.
- Exploring DISO, a single stock covered call ETF, offers a creative way to participate in Disney’s potential comeback while reducing volatility.
Bastiaan Slabbers
Don’t they look so happy in that picture? But given the wild ride Disney (NYSE:DIS) has taken investors on during the past 5 years, lesser-known Disney character Mr. Toad is a more appropriate representative than Mickey & Minnie.
Disney’s latest quarterly report, announced this morning, provided investors with some positive news, including a double-digit percentage operating income gain in the core entertainment segment. However, long-term investors in this stock have had to grapple with far more than any single “event” in this stock’s inglorious recent history. I’m scouting this stock, which I do not currently own but am strongly considering, but with an eye toward how to squeeze more yield out of it than its paltry dividend.
With this earnings announcement out of the way, I’m just about there, once the post-earnings chaos calms down. So far, so good, with an initial gain in the stock of nearly 7%, minutes after the pre-7:00 am news. I track the Dow 30, which Disney is a longstanding member of (33 years), quite closely. And as is my preference, it is rounding into buying shape for me, after a forgettable 2024 for investors so far.
Disney stock: 5 years, 1/4 of its value gone
Here’s the rise and fall of the stock the past 5 years, which too closely resembles a Disney thriller for many long-term holders. And unlike the feel-good conclusions to so many of this iconic entertainment company’s films, this one has left many wondering where the magic went. A 25% decline, including dividends, over 60 months? Not the happiest stock on earth.
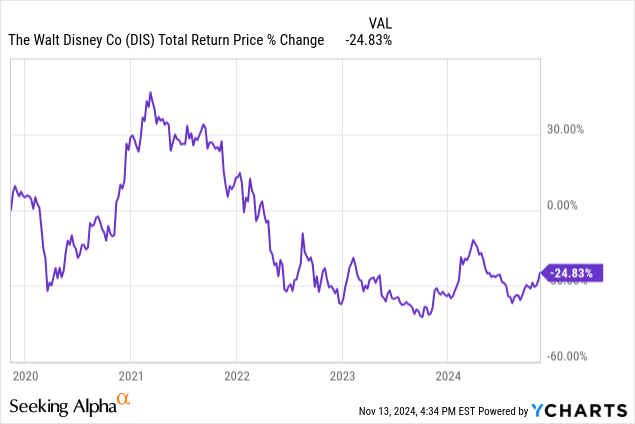
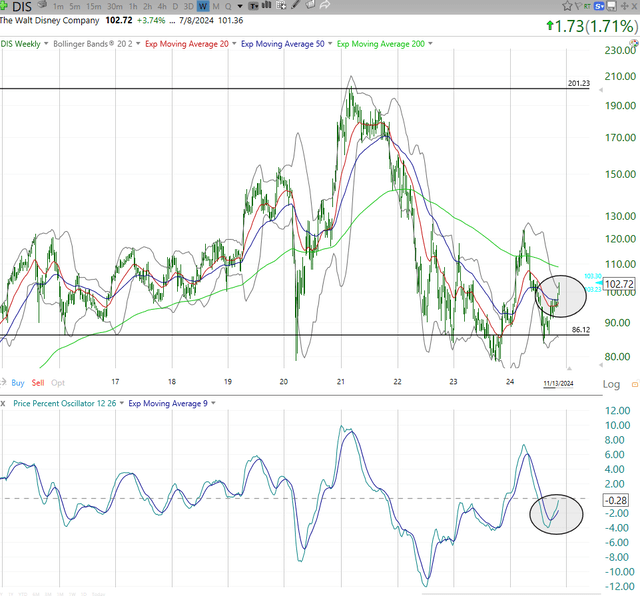
And DIS is approaching 10 years of zero price return, meaning it has earned only the dividend since early 2015! But as indicated here, a ton of drama has occurred during that decade.
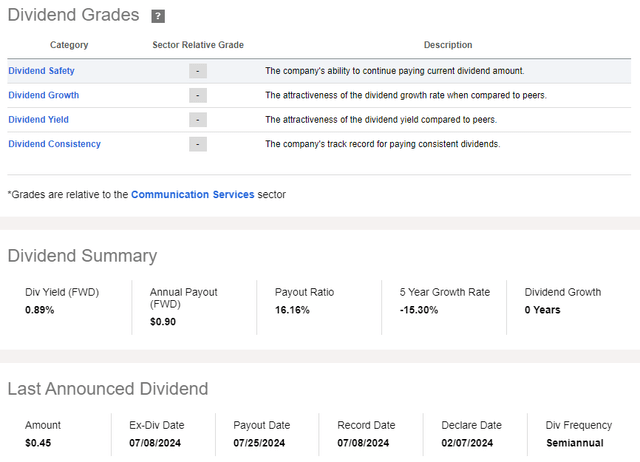
And lest we forget how bad it got for this Dow Jones Industrials member, here’s the Seeking Alpha dividend scorecard. What’s missing? Years of dividend growth. There are none, since the company suspended, then eliminated its payout starting with the pandemic in early 2020, and only re-instituted it this past January. Disney was a dividend oddball in that it only paid annually, until converting to twice a year in 2015, instead of the more traditional quarterly.
As a dividend investor, Disney has never been in the range of what I’d consider, given that its dividend yield has never traded as high as 2%, except in 2009 when the market was finishing up the global financial crisis. However, while dividend investing and my trademarked Yield At a Reasonable Price (YARP) factor are the core of my research and investing efforts, like many investors, I’m always looking to sprinkle some growth into my portfolio.
And, as I note at the end of this article, I think I have identified a way to both participate in the potential price upside I see coming here, along with a hefty yield via yet another single stock covered call ETF, among a set of them I’ve written about here recently.
Walt Disney earnings: broader picture
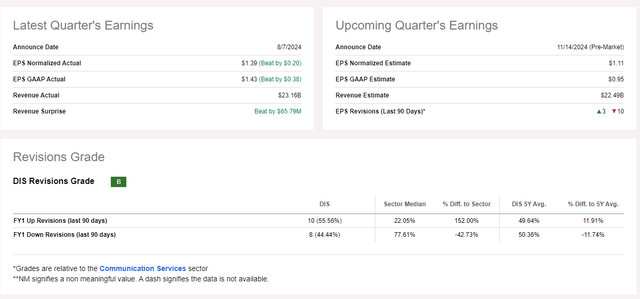
Before we get there, here’s what Disney’s earnings looked like last quarter, and leading up to Thursday morning’s report. But frankly, this is of much less use to me than likely 95% of analysts here and elsewhere. I’m a quant, and more than anything, a technical analyst and position-size-driven investor. So below, I’ll review what I see with Disney from those angles.
Disney: factor grades analysis
Profitability is tops with me. I assume that a stock’s price will represent most of the big, known information. But that only gets us today’s price. The chart pattern tells us more about how high or low that price is, and allows me to assess how much risk there is of a big loss in the near future. To me, that is what really matters, since any stock can go up in price at any time, for any reason. But between any two or more stocks, what separates them is the RISK that is attached to going after that upside.
So when I see a stable and highest-rated A+ for profitability, I can move forward in assessing the rest of it. Growth is average, and valuation is allegedly a weak spot. But my “valuation” metric is the chart, more so than the traditional valuation analysis. My son is an aspiring CFA. As for me, that ship sailed a long time ago, when my late father taught me to chart stocks at age 16. Reagan was President. The first term! I learned it and never left it.
Seeking Alpha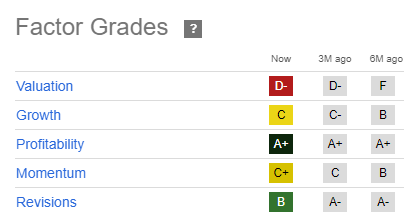
The momentum grade is a form of technical analysis, but I focus more on the nuances of the chart pattern, which, as I’ll show just below, look a lot better than the momentum grade of C+ implies. And earnings revisions, while a solid B grade, is not part of my process. So my bottom line here is this: A+ profitability equals “first box checked” for me. That dividend yield situation doesn’t help, but I am looking at DIS for price appreciation potential, and to see if a covered call approach to that position makes sense. If it does, it has a shot at entering my Sungarden YARP Portfolio fairly soon.
Part of that decision process involves looking at approaching ex-dividend dates as a positive, and approaching earnings dates as a negative. So if I had been fully ready to step into Disney, I would have waited until after earnings anyway. As I see it, this stock is like any other in that it can pop 10% on earnings (as it did in February of this year) or drop 20% from the same event (as it did in February 2023).
I’d rather skip out on a lot of that “noise” by using what I call “flexible position rotation” within my portfolio. That’s a fancy way of saying that if a stock makes it into the basket of 30 names I typically hold at one time, I will commit to owning at least a 1% position at all times. Ideally, I will think highly enough of it to own as much as 5% when I conclude that the chart is solid, the ex-date is not terribly far away, and earnings are not for a while (30 days off, at least). So in the case of this stock, the earnings would have me at a 1% or at most 3% position size IF I held it. But I don’t. Not yet.
DIS stock: technical analysis
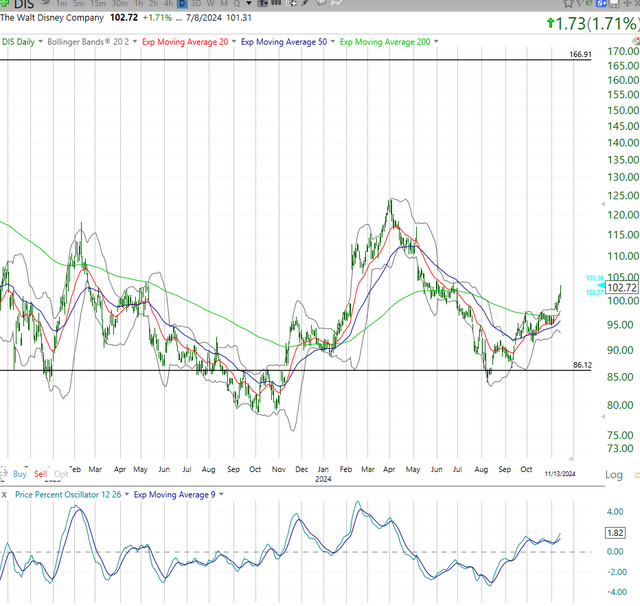
I look at a lot of charts. Perhaps500-1000 in a given week, including many several times a week, since I follow about 12 different time frames. And this, to me, is a very nice chart! That said, markets don’t care what I think. So regardless of what the earnings were today, the initial reaction, and the forthcoming reaction the rest of today and tomorrow and into next week can wreck this emerging comeback story the chart leads me to believe is in progress.
I see a steady succession of higher prices, but it is way more than that. The 20-day moving average, a more reliable indicator to me than most, is now firmly up. Only an “event” could ruin that for now. Money is entering the stock, and that’s part of a broader pattern I see, with investors warming to some very contrarian names in this initial post-election period.
That was a daily chart. Here’s a weekly. I read it similarly, but here we can also see the full 10 years of no price return I noted above. Translation: that $120 level is in play as long as we don’t have an exogenous event. And if the reaction to earnings is terrible, and negates this emerging, but early-stage pattern? That’s why my process doesn’t go “all in” or even mostly in around earnings announcement dates! Even if I decide to be a long-term buy-and-holder of DIS, that’s a VERY different decision on how much to own at any time. I refer to this as buying, but renting at the same time.
That weekly chart has me thinking like a greedy type, which I am not. I see potential for the stock to double within, say 2-3 years. That will require a firm broad market, or just one that rewards comeback situations like this one. As I’ve also noted numerous times recently, my broad market view considers that the “market” via the headline indicators could be weak in the coming years, but that some stocks can buck that trend because they have already had their bear markets, while Magnificent-7 types were treating their shareholders to a remarkable ride higher.
“Position sizing” and my YARP approach
Disney is a good example of how I approach a stock outside of its dividend yield. I don’t just want high income, since that can come with a lot of price risk. So, why bother with the extra effort to do this position sizing routine I’m wedded to? Because there are many fish in the sea (not a Little Mermaid reference!).
That is, there are plenty of stocks that don’t come with Disney’s history of causing investors headaches. So while I approach it here with a fresh look and a potentially powerful chart, I also know its reputation for disappointing other investors. That’s where the position sizing allows me to be “in the game” with any stock that makes it over the bar I set, but never in a situation where one bad outcome or event from one stock can set me back too far.
DISO: a new, creative way to participate in a Disney comeback
While I admit the jury’s out on the recently developed series of single stock covered call ETFs from YieldMax, I will say this: I think the defense’s case is looking good so far. And while I’ve been looking into the Magnificent 7-related ETFs from that set of products, when I looked at the Disney chart and profitability, while hunting for contrarian stocks, I thought to myself “too bad there isn’t a covered call ETF for DIS, I guess I’ll have to consider doing the buy-write myself.” Then, I realized that little DISO with the big yield might be the way I ultimately step into DIS. I’d say I’m very close to doing that, just seeing how earnings treat things.
This ETF, like its peers, uses options as a surrogate for owning the stock and for selling covered calls on it, while most of the fund’s assets are in T-bills. That’s a nice combination to me. No fancy, JEPI-style private market contracts, all above board.
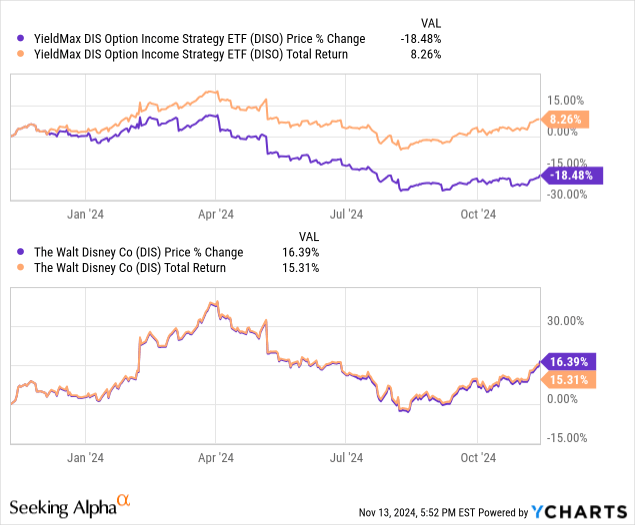
And in the second chart below, I compare DIS and DISO since the latter’s inception more than a year ago. What I see is that it cuts down the volatility. THAT is my goal. The income is naturally helpful, and if I truly decide that the covered call aspect is holding me back, I can always opt for DIS instead, or even write calls on that holding, likely using options that are more out of the money exchanging some income for more upside. Or, I can own both DIS and DISO as a sort of “paired” position. There’s no rule against it!
Seeking Alpha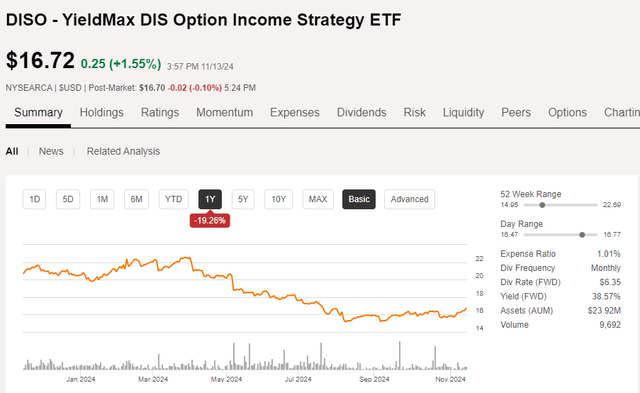
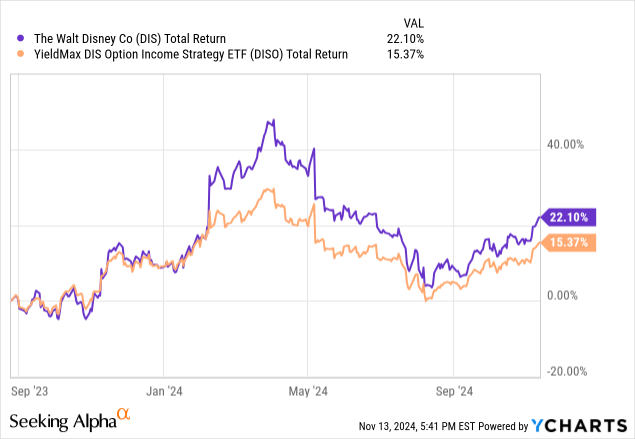
Lastly, here’s a chart below that reminds us that this is always a tradeoff between reward and risk of major loss. DISO has cost shareholders some upside, and the yield, while higher than the price drop of the ETF, still shows that tradeoff clearly.
Final thoughts for now
That said, that’s why I position-size and use charting. Owning a stock is one step. How to own it over different points in that holding period is a totally different concept. So I’m close on this one, and if the post-earnings period goes OK, I can see stepping in to Disney. But this case is, I think, an ideal one to explain in some detail the thought process I use for stocks I’d like to consider owning, but for which the dividend yield (or lack thereof) prevents me from going at it in my usual YARP-y way.
Analyst’s Disclosure: I/we have no stock, option or similar derivative position in any of the companies mentioned, and no plans to initiate any such positions within the next 72 hours. I wrote this article myself, and it expresses my own opinions. I am not receiving compensation for it (other than from Seeking Alpha). I have no business relationship with any company whose stock is mentioned in this article.
Seeking Alpha’s Disclosure: Past performance is no guarantee of future results. No recommendation or advice is being given as to whether any investment is suitable for a particular investor. Any views or opinions expressed above may not reflect those of Seeking Alpha as a whole. Seeking Alpha is not a licensed securities dealer, broker or US investment adviser or investment bank. Our analysts are third party authors that include both professional investors and individual investors who may not be licensed or certified by any institute or regulatory body.
By Rob Isbitts and Sungarden Investment Publishing
A community dedicated to navigating modern markets with consistency, discipline and humility
Full Access $1,500/year
Legacy pricing of $975 for first 35 subscribers, a savings of 35%
-
Direct access to Rob and his live YARP portfolio, featuring a trademarked stock selection process he developed as a private portfolio and fund manager, and his decades of technical analysis experience.
-
24/7 access to Sungarden’s investment research deck
-
Bottom-line analysis of stocks, ETFs, and option strategies
-
Trade alerts and rationale, delivered in real-time
-
Proprietary educational content
-
You won’t get: sales pitches, outlandish claims, greed-driven speculation


