Summary:
- Warren Buffett’s recent sale of Apple stock is justified as technical and fundamental analyses indicate a bearish outlook, warranting a strong sell rating.
- Short-term technical indicators, including chart patterns, moving averages, and daily indicators, show significant weakness and bearish signals for Apple stock.
- Intermediate-term analysis reveals bearish moving averages and indicators, despite a positive weekly chart, suggesting a negative outlook for Apple.
- Apple’s fundamentals show sluggish revenue growth and negative EPS growth, making the stock overvalued and prone to multiple contraction.
Easyturn
Thesis
Warren Buffett made headlines recently with his continued selling of Apple Inc., (NASDAQ:AAPL) stock. I believe he is making the correct decision, as both technicals and fundamentals show that Apple stock could pull back significantly. In the below technical analysis I determine that the near and intermediate term outlooks are very bearish for Apple and while the long term is a bit better, it is still highly mixed. As for the fundamentals, despite beating earnings expectations in its most recent quarter, the stock seems significantly overvalued as Apple’s sluggish growth is unable to justify its high P/E and P/S ratios. With my analyses converging to the conclusion that the stock’s outlook is dismal, I currently believe Apple deserves a strong sell rating.
Daily Analysis
Chart Analysis
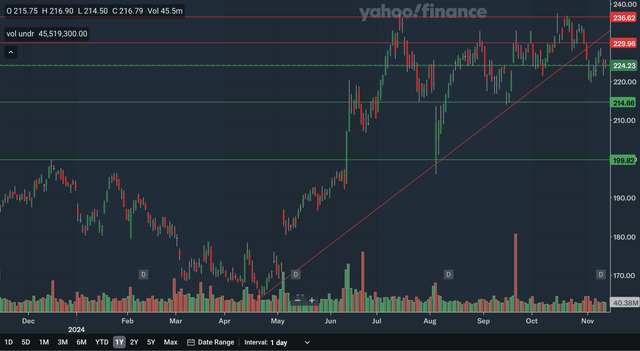
Apple just very recently broke a key short-term uptrend line, a major negative. This uptrend stretched back to April of this year and was important support on many occasions. The nearest source of resistance would be at around 230 as that level was resistance in August and September. The next level of resistance would be the former uptrend line. However, it is sloping up quickly and is likely to move out of range in the coming months. The last resistance area would be the all-time high of around 236. It looks like a double top may have formed, as the peak in October failed to surpass the high set in July. As for support, the nearest area would be in the mid-220s with that price level being both support and resistance in the second half of this year. Moving down, we also have support in the mid-210s with that zone being key support in July and September. Lastly, the psychologically important 200 level is distant support, as it was resistance back in late 2023 and was support during the August crash. Overall, I would say the daily chart reflects a bearish short term for Apple, as the breakdown from the uptrend line and double top are significantly negative signals.
Moving Average Analysis
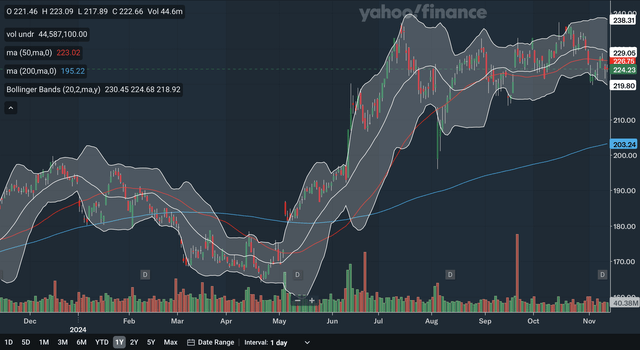
The 50-day SMA crossed above the 200-day SMA in June this year, a bullish indication. While the gap between the SMAs has remained quite healthy, the stock is currently trading below the 50-day SMA, which is an indication of weakness. The 50-day SMA has also developed a downward trajectory, and so it may further pressure the stock in the near future. For the Bollinger Bands, the stock broke beneath the 20-day midline in late October, another indication of weakness. The stock recently hit the lower band showing it was oversold and bounced but was rejected by the midline, showing that the midline has now become resistance. From my analysis, despite the 50-day SMA still being above the 200-day SMA, the many signs of weakness show that the short-term outlook for Apple is beginning to be bearish.
Indicator Analysis
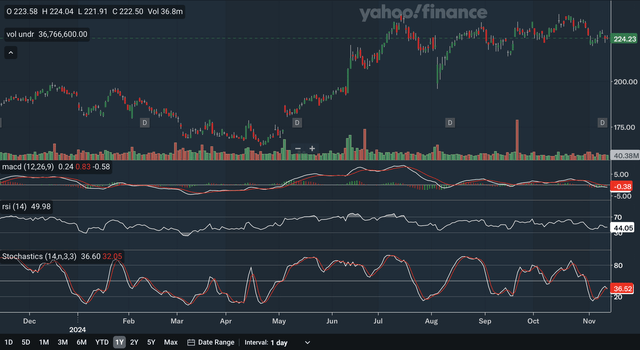
The MACD crossed below the signal line in October, a bearish signal. Furthermore, after the gap between the lines briefly narrowed, the MACD is pulling away from the signal line again, an indication of renewed bearish pressure. Also, note that while the stock has remained at quite high levels relative to the past year, the MACD is now far below levels seen in July. For the RSI, it is currently at 44.05. The RSI breaking beneath the critical 50 level back in October shows that the bears have taken control of the stock. Lastly, for the stochastics, the %K line just broke below the %D line, yet another bearish signal, although the crossover did not occur within the overbought 80 zone. In my view, there is not much to like about Apple stock when evaluating these daily indicators, as they show bear signals galore.
Takeaway
The short-term technical outlook for Apple is getting very ugly with all three analyses showing bearish indications. The chart showed that the stock has broken beneath a key uptrend line and has developed a double top, while the MA and Bollinger Bands showed significant weakness in the stock. Lastly, as discussed above, the indicators were all negative.
Weekly Analysis
Chart Analysis
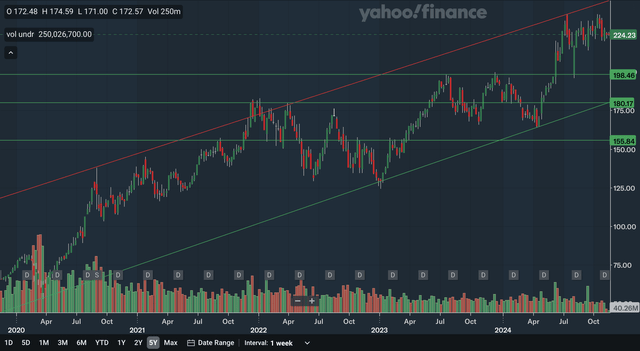
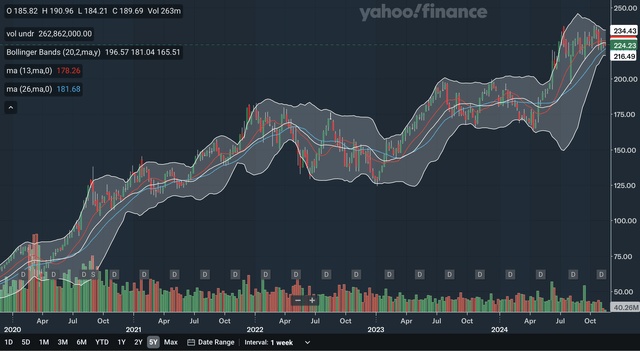
The weekly chart is the first positive for Apple, as the stock remains bound in an upward channel. This channel dates back to 2020. The only source of resistance in the intermediate term is the upper channel line. The stock could experience modest gains even if it were to remain under this line. For support, the nearest level would be at around 200. This area was already discussed in the daily analysis, but here we can see its significance stretches back to mid-2023. Moving down, we have support at 180 as that level was strong resistance back in late 2021 and in 2022. The lower channel is currently also at 180 and is becoming increasingly relevant for the stock. Lastly, we have distant support in the mid-150s, with that area having been both support and resistance throughout the past years. Overall, this is the first sign of positivity with Apple stock, as there are no bearish indications here.
Moving Average Analysis
The intermediate term positive signals end here, however, as the MAs show signs of weakness with the stock. The 13-week SMA crossed above the 26-week SMA earlier this year, but the gap between the line has narrowed significantly lately, showing that the stock is running out of steam. The stock is also now trading below the 13-week SMA, another sign of weakness. For the Bollinger Bands, the stock broke below the 20-week midline just very recently, a significantly bearish signal as the stock has not been below this line since early in the year. From my analysis, these MAs do not support the bullishness of the weekly chart, as there are many red flags present here.
Indicator Analysis
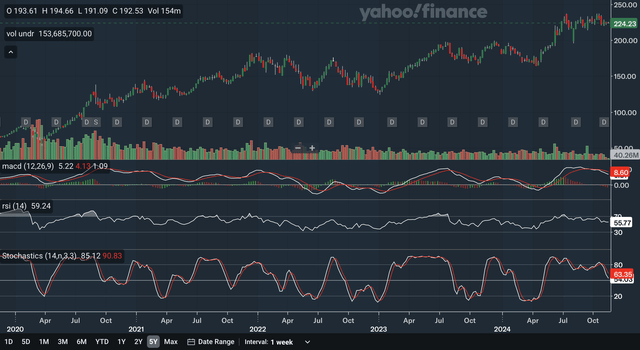
Intermediate term bearish signals continue in the weekly indicators. The MACD crossed below the signal line earlier in the year, a negative indication. Since then, the gap has only gotten wider, showing that bearishness has been rising. For the RSI, it is currently at 55.77 and holding above the critical 50 level which is a positive. However, the RSI also shows negative divergence, as the all-time high in the stock earlier in the year was met with an RSI that failed to best the peak seen in 2023. This is an intermediate term top failure swing, a highly bearish development. Lastly, for the stochastics, the %K has dropped below the %D back in October right at the overbought 80 zone, which is once again a highly negative indication for the stock. In my view, these weekly indicators have been very bearish, with every one of them showing some sort of weakness with Apple.
Takeaway
Despite the weekly chart being positive, the very bearish MA and indicator analyses show that the intermediate term technical outlook is not as bright as it seems. The chart actually looked quite good as it showed that the stock is bound in an upward channel with strong support below. However, beneath the surface, the MAs had signs of weakness and the indicators were overwhelming bearish, making the intermediate term a negative one for Apple stock.
Monthly Analysis
Chart Analysis
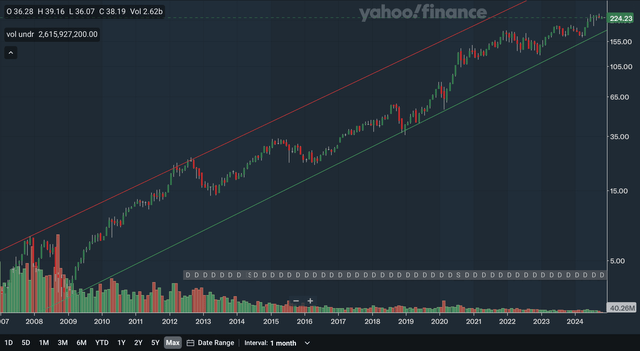
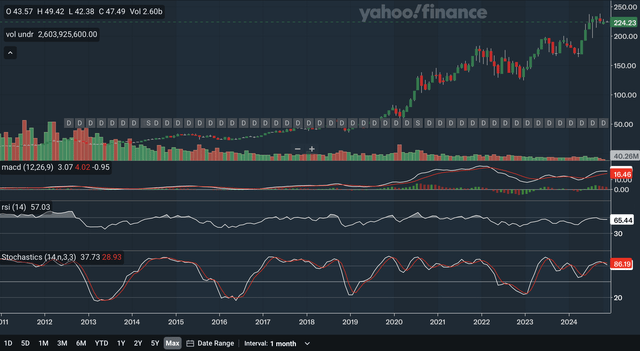
Note that the above chart is on a logarithmic scale to better reflect Apple’s long-term trend. There is not too much to discuss here, but as you can see above, the stock is currently bound in an upward channel that dates back to 2007. This shows that the stock is still headed in a positive direction in the long term. However, note that in recent years, the stock has remained in approximately the bottom quarter of the channel, an indication that the uptrend has not been as strong. The upper channel line is the only long-term resistance but is highly irrelevant, currently, with the stock being only in the bottom quarter of the channel. The lower channel line is a more meaningful line currently as it is long-term support that just surpassed 155 earlier this year. Although there is nothing particularly bearish about this chart, as discussed above, I believe there are subtle signs of weakness that investors should take note of.
Moving Average Analysis
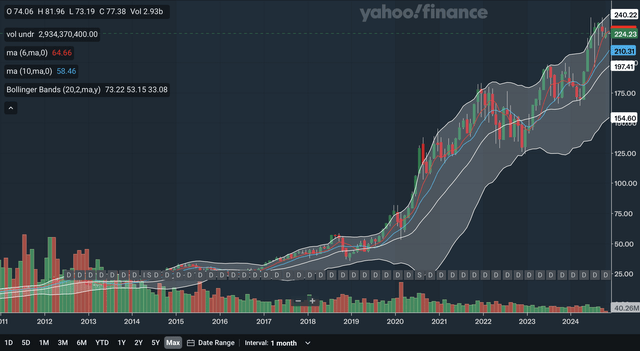
The 6-month SMA crossed above the 10-month SMA early this year, a bullish indication. The gap between the lines has widened significantly, but recently the 6-month SMA has lost a bit of momentum while the 10-month SMA continues it sharp accent. The stock just recently broke below the 6-month SMA, an indication of weakness. For the Bollinger Bands, the stock was at the upper band for quite a while earlier in the year, showing it was overbought. The recent pullback is therefore not too surprising. The stock has remained above the 20-month midline since very early 2023, showing that the long-term uptrend has been intact for almost two years now. Overall, I would say that the monthly MAs are net positive, but the stock moving below the 6-month SMA is a red flag that investors should monitor to see if the stock continues to drop further beneath the line or whether it can reclaim the line as an indication of strength.
Indicator Analysis
The MACD had a bullish crossover with its signal line earlier in the year, but the gap between the lines has been narrowing in past months, as demonstrated by the histogram. This shows that bullishness has been receding. The long term MACD also has negative divergence since the stock hit an all-time high this year, but the MACD peak this year is far below the one seen in late 2021. For the RSI, it is currently at 65.44 and has been above the 50 mark since early 2023, reflecting sustained bullish momentum. However, the RSI also shows negative divergence as its readings this year failed to the best levels seen in 2021. Recall, in the monthly chart analysis that I said that although the stock remains in an upward channel, it is displaying weakness because it has been in the bottom quarter of the channel consistently for the past couple of years. The MACD and RSI’s bearish divergence here confirms that the stock is indeed in a weak uptrend. Lastly, for the stochastics, the %K just crossed below the %D within the overbought 80 zone, another bearish signal. From my analysis, while there were still some positive signs here, like the RSI remaining above 50 for an extended period, the negative divergence signals overshadow the positives as the long-term uptrend is drawn into question.
Takeaway
The long term is a bit less bearish than the short and intermediate term time frames, but was still highly mixed. The monthly chart shows that the stock remains in an upward channel, while the moving averages showed more positives than negatives. As for the indicators, there were mixed signals but the most important one was the bearish divergence in both the MACD and RSI. Overall, I would conclude that the long-term technical outlook for Apple is uncertain.
Fundamentals & Valuation
Earnings
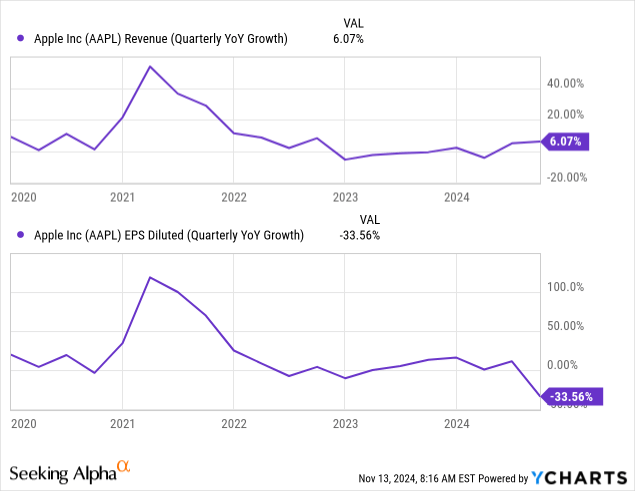
In late October, Apple released their Q4 earnings report and showed mixed results. They reported revenues of $94.930 billion, up from $89.498 billion in the prior year period. For EPS, they reported $0.97, a significant decrease from last year’s $1.46. Both revenue and EPS beat expectations, however, as revenue beat by $514.17 million and EPS beat by $0.02. As you can see in that charts above, revenue growth continues to be very sluggish for Apple, while EPS growth has actually dropped into negative territory. Despite beating expectations, I would be disappointed in Apple’s results. Other highlights in their earnings include their iPhone revenues being $46.222 billion, up from the prior year period’s $43.805 billion and relatively strong growth in their Services revenue as it up from $22.314 billion to now $24.972 billion.
Valuation
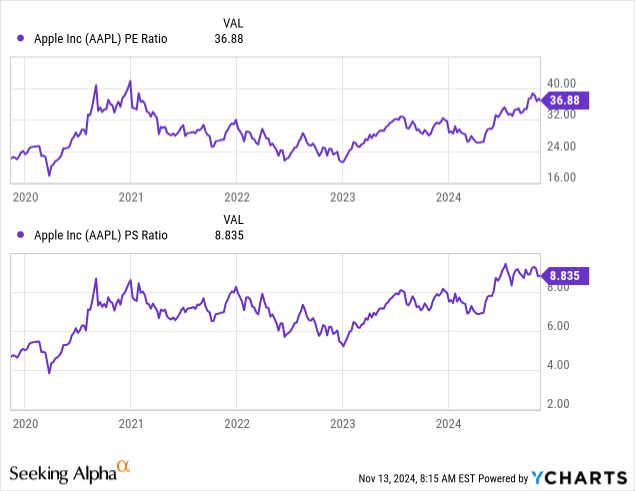
The P/E and P/S ratios are at very high levels relative to the past five years, as they have rebounded sharply from the trough at the end of 2022. The P/E ratio is currently 36.88, very near the five-year-high set in 2020 and significantly higher than the low of near 20 set in late 2022. For the P/S ratio, it is currently at 8.835, just slightly below the recent five-year high of above 9 and much higher than the late 2022 low of near 5. When you compare the revenue and EPS growth charts above with these valuation multiples’ charts, you can see a disconnect. While revenue growth remains very sluggish relative to the past five years, the P/S ratio is near a five-year-high. While EPS growth has become negative in the most recent quarter, the P/E ratio is only slightly below the 2020 peak. Therefore, I believe Apple stock is currently overvalued relative to its growth and could experience significant multiple contraction as a result. Seeking Alpha currently has a D- valuation rating for Apple, confirming my evaluation that the stock is significantly overvalued currently.
Conclusion
The technical analysis as a whole showed a weak outlook for Apple stock. The short and intermediate term bearish signals are very worrying as key indicators showed highly negative developments. The long term is a bit brighter but with the mixed signals, I would conclude that it is only uncertain at best. For the fundamentals, as discussed above, the current levels in the valuation multiples are unjustified as growth in revenue is weak and growth in EPS has actually turned negative. With news of Warren Buffett cutting his stake significantly, it is hard to see any positives for Apple stock at the moment. Therefore, I believe a strong sell rating is appropriate at this juncture.
Analyst’s Disclosure: I/we have no stock, option or similar derivative position in any of the companies mentioned, and no plans to initiate any such positions within the next 72 hours. I wrote this article myself, and it expresses my own opinions. I am not receiving compensation for it (other than from Seeking Alpha). I have no business relationship with any company whose stock is mentioned in this article.
Seeking Alpha’s Disclosure: Past performance is no guarantee of future results. No recommendation or advice is being given as to whether any investment is suitable for a particular investor. Any views or opinions expressed above may not reflect those of Seeking Alpha as a whole. Seeking Alpha is not a licensed securities dealer, broker or US investment adviser or investment bank. Our analysts are third party authors that include both professional investors and individual investors who may not be licensed or certified by any institute or regulatory body.

