Summary:
- AMD’s stock has severely underperformed in 2024 despite AI chip success, lagging behind NVIDIA and the broader semiconductor sector.
- Technical indicators show a lack of buying interest matched against significant selling volumes, with troubling EMV, Force Index, and Chaikin Money Flow readings.
- Operating risks include the effects of potential trade wars and geopolitical tensions with China, which could severely impact AMD’s chip supply and stock performance.
- I remain bearish on AMD for the next 12 months, rating it a Sell, with a suggestion to look elsewhere for investment opportunities.
megaflopp/iStock via Getty Images
Believe it or not, Advanced Micro Devices Inc. (NASDAQ:AMD) is now down on the year for an investment total return. With the Artificial Intelligence [AI] hoopla of 2024, you would think the stock has been a spectacular tear like NVIDIA (NVDA).
AMD’s new AI chips are selling well. However, the rest of the company and markets served have actually disappointed by a wide margin this year. Just today (November 13th, 2024) news came out the company was laying off 4% of its workforce. So, there is plenty to worry about if you own shares.
In fact, the stock has lagged badly vs. NVIDIA, and has failed to keep up with the whole semiconductor sector, represented by the iShares Semiconductor Index ETF (SOXX) over the past 12 months. Unfortunately, throwing darts at the sector with a diversified mix of holdings would have bested AMD by +19% for a total return since January 1st, 2024 (pictured below).
YCharts – Advanced Micro Devices vs. Peers, Total Returns, Since January 1st, 2024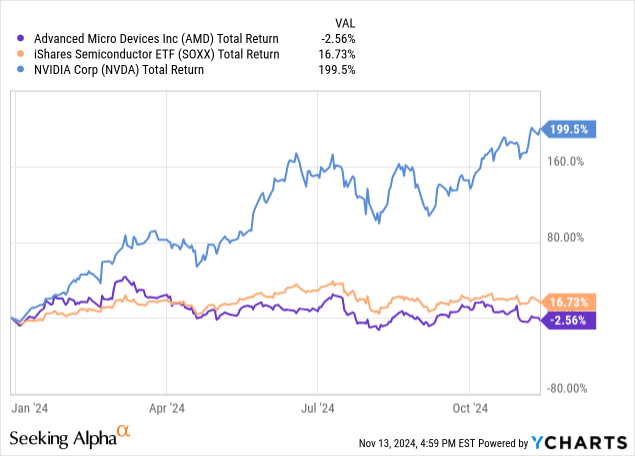
I identified problems with the AMD chart back in early April here, explaining the wickedly problematic drop in the 14-day Ease of Movement indicator. Essentially, a vacuum of buyers allowed limited selling pressure to push price straight down.
Seeking Alpha – Paul Franke, AMD Article, April 9th, 2024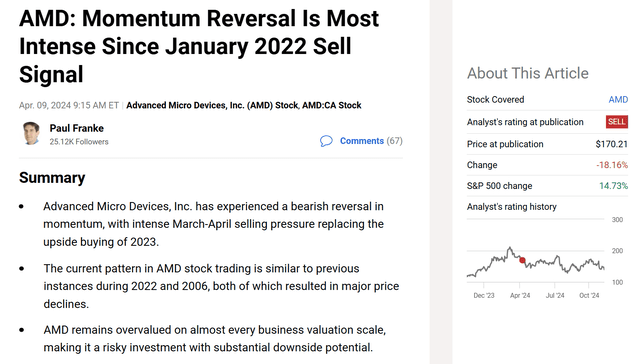
When you calmly and unemotionally review the trading momentum setup, while ignoring all the AI hype, it’s hard to get overly enthused about AMD. What if a global recession is next, as the newly-elected President pushes trade tariffs that have historically led to a rapid weakening in global economic output? If this is our future, AMD’s projected bright future may not materialize, and the overvalued stock quote will sink under $100 over the next 6–12 months.
Let’s review some of the ownership issues to contemplate on the “risk” side of the risk/reward equation.
Fading Buy Interest – Stagnate Chart Pattern
More bad news, stacked on top of the April technical problems, the 14-day EMV calculation pinpointed a lack of buying interest during late July and early August. Again, investment results have been rotten since early August, severely underperforming peer names like NVIDIA, despite plenty of cheerleading from AI-focused analysts and groupies.
Below is an 18-month chart of daily price and volume changes. I have circled in gold, the 52-week low EMV readings in March-April, and all-time record low calculation reached during August. Both instances of buyers pulling back have been hard for price to overcome.
Other worrisome stats include the extended and deep selling represented in the 13-day Force Index between March-May (circled in red), and the blowout negative number from the 20-day Chaikin Money Flow indicator in early August (circled in blue).
YCharts – Advanced Micro Devices, 18 Months of Daily Price & Volume Changes, Author Reference Points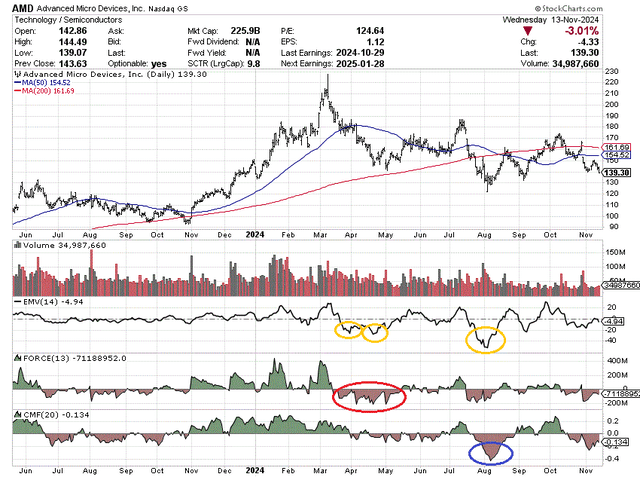
I have explained similarly weak EMV patterns from other Big Tech names since the spring on Seeking Alpha, with varying success in predicting price direction. But for AMD in particular, this indicator has been a terrific signal booms are turning to bust in the stock price. Below we can review past examples (closest peers to today) of a big drop in the EMV indicator during November 2021 to January 2022, March 2006, and May to August 2000.
2021-22
The last instance of a huge drop in the EMV calculation after a multi-year AMD bull run was during late 2021 and again in January 2022. the 14-day EMV reached new all-time low readings both times. From that point, price would zigzag lower the rest of 2022, for a -60% peak to trough move for price.
YCharts – Advanced Micro Devices, Daily Price & Volume Changes, July 2021 to Jan 2023, Author References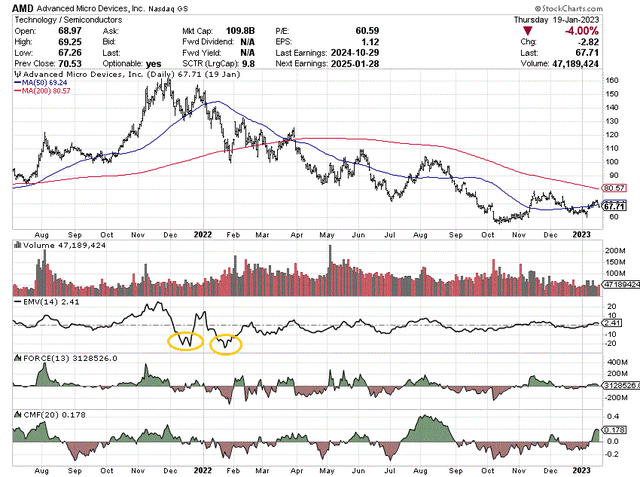
2006
Early 2006 witnessed a massive swing from major EMV buying trends to selling, with a record low outlined in March. Going into the Great Recession of 2008-09, AMD would end up imploding by -80% from the February 2006 top into early 2008 (-95% drop in total into October 2008, not pictured). By early 2009, there were questions about whether or not AMD would remain in business.
YCharts – Advanced Micro Devices, Daily Price & Volume Changes, May 2005 to Jan 2009, Author Reference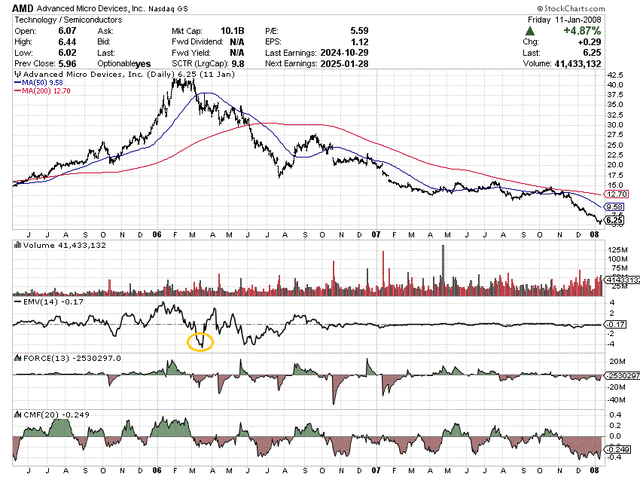
2000
Before that example, we can go back to the original Dotcom technology bubble peak of the year 2000. During May and again in August, all-time record lows (at the time) were reached in the EMV indicator setup. Measured from the June 2000 high, AMD would fall -85% in price into October 2001.
YCharts – Advanced Micro Devices, Daily Price & Volume Changes, Oct 1999 to Nov 2001, Author References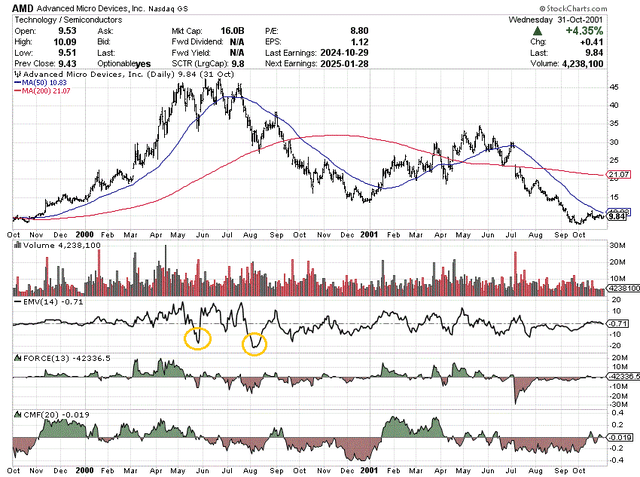
Overvaluation vs. New Tariff Issues
What investors in AMD need to keep in mind is this company is very cyclical for business sales and earnings. When things look great like today, it’s hard to contemplate the detrimental effects of any approaching recession, or how competition and cost issues will hurt the business a year or two down the road.
Honestly, the only real value for shareholders now is based on growth “hopes” in the AI-chip area. You can review on the chart below, the highest marks Seeking Alpha’s Quant Valuation tool finds are listed under the PEG line (P/E to earnings growth estimates). Otherwise, the current “D+” grade would be an “F.”
Seeking Alpha – Advanced Micro Devices, Quant Valuation Grade, November 13th, 2024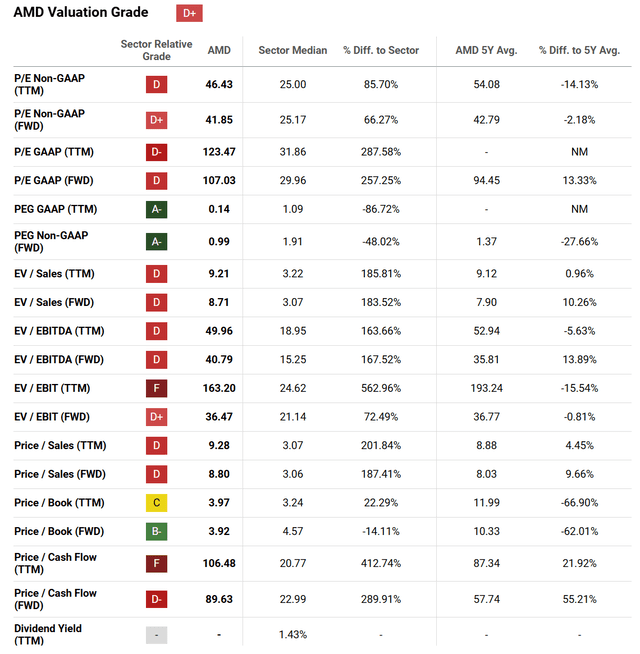
On a long-term review, valuations for AMD (and other technology giants) since 2019 have traded well above the ratios of previous decades. You have to believe we are in some sort of new era (paradigm) to explain away this valuation drag on future investor gains.
YCharts – Advanced Micro Devices, Price to Trailing Sales & Cash Flow, Since 1986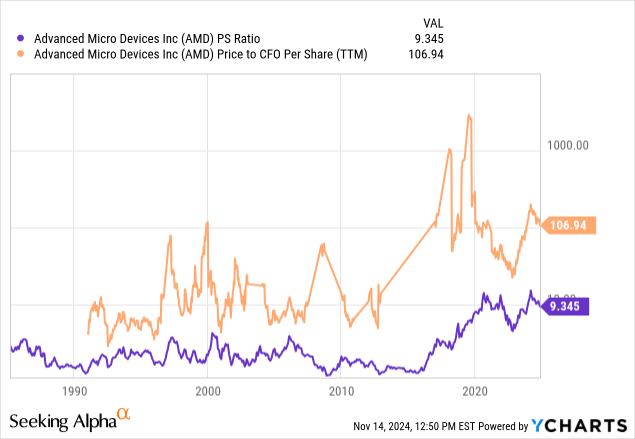
My feeling is AMD estimates for revenue and EPS are overinflated by analysts today. A slowing global economy, with high to rising interest rates, are not part of current Wall Street projections for 2025-26. I do not expect the below 2025–26 estimates to become reality.
Seeking Alpha Table – Advanced Micro Devices, Analyst Estimates for 2024-26, Made November 13th, 2024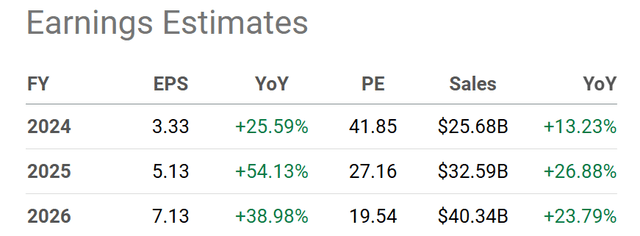
Trade War Risks
Therein lies the problem for buying AMD near an AI-hype peak. If we actually get an international trade trainwreck in chip technology under the new Trump administration during 2025 and/or a trade war globally pushes the world economy into recession, AMD’s results will surely disappoint next year.
Another outlier risk is Trump could lead the U.S. into a military confrontation with China over Taiwan, where much of AMD’s chip supply originates. Disruptions to shipments from this important technology-focused island and/or the destruction of its fab facilities in a military conflict would decimate the AMD stock quote. It would take a period of several years to reshore all production to the U.S., with considerable effort and time (expense) necessary to create new sources of fab supply outside of China/Taiwan.
Final Thoughts
To me, the long-term risks of owning shares still outweigh the potential short-term rewards (maybe already fully discounted by Wall Street).
What could return AMD to a bullish price trend? My opinion is the U.S. and world economy needs to grow faster in 2025. This would support greater AI-chip demand and bring new revenue to other areas of the business, currently lagging.
For the stock quote specifically, I would prefer far flatter EMV numbers (around zero) to become truly optimistic on AMD’s prospects as an investment. On my charts, looking at previous tops and busts, you will notice a substantial selloff and bottoming pattern usually creates a better EMV balance between share supply/demand. So, a meaningful upside reversal may require a dip in the share price first. We have yet to see this momentum construct appear.
Insiders have been almost entirely been sellers of the stock over the past year, with CEO Lisa Su liquidating some of her position on November 6th, at $142.14 per share. Investors should question the lack of management buying conviction in AMD currently if a high-growth future was a slam-dunk certainty.
Nasdaq.com – Advanced Micro Devices, Insider Trading Activity, 12 Months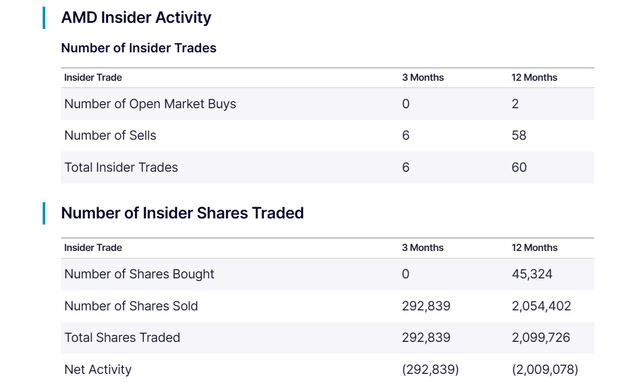
My bottom-line summary: the backdrop for a bullish rating may need some time to develop (perhaps another 6–12 months of price decline).
I remain bearish for a 12-month outlook on Advanced Micro Devices. I rate shares a Sell, and suggest readers look elsewhere to put their hard-earned investment capital.
Thanks for reading. Please consider this article a first step in your due diligence process. Consulting with a registered and experienced investment advisor is recommended before making any trade.
Analyst’s Disclosure: I/we have no stock, option or similar derivative position in any of the companies mentioned, and no plans to initiate any such positions within the next 72 hours. I wrote this article myself, and it expresses my own opinions. I am not receiving compensation for it (other than from Seeking Alpha). I have no business relationship with any company whose stock is mentioned in this article.
I am short S&P 500 and NASDAQ 100 index related products, which have high weightings in AMD and NVDA.
This writing is for educational and informational purposes only. All opinions expressed herein are not investment recommendations and are not meant to be relied upon in investment decisions. The author is not acting in an investment advisor capacity and is not a registered investment advisor. The author recommends investors consult a qualified investment advisor before making any trade. Any projections, market outlooks, or estimates herein are forward-looking statements based upon certain assumptions that should not be construed as indicative of actual events that will occur. This article is not an investment research report but an opinion written at a point in time. The author's opinions expressed herein address only a small cross-section of data related to an investment in securities mentioned. Any analysis presented is based on incomplete information and is limited in scope and accuracy. The information and data in this article are obtained from sources believed to be reliable, but their accuracy and completeness are not guaranteed. The author expressly disclaims all liability for errors and omissions in the service and for the use or interpretation by others of information contained herein. Any and all opinions, estimates, and conclusions are based on the author's best judgment at the time of publication and are subject to change without notice. The author undertakes no obligation to correct, update, or revise the information in this document or to otherwise provide any additional materials. Past performance is no guarantee of future returns.
Seeking Alpha’s Disclosure: Past performance is no guarantee of future results. No recommendation or advice is being given as to whether any investment is suitable for a particular investor. Any views or opinions expressed above may not reflect those of Seeking Alpha as a whole. Seeking Alpha is not a licensed securities dealer, broker or US investment adviser or investment bank. Our analysts are third party authors that include both professional investors and individual investors who may not be licensed or certified by any institute or regulatory body.
