Summary:
- Lowe’s benefits from long-term tailwinds: Aging housing stock, home price appreciation, and rising disposable income, positioning it well for future growth despite near-term challenges.
- Q3 earnings showed a decline in sales and comp sales, with DIY market weakness and storm-related sales impacting margins, but Pro sales and online growth were strong.
- Lowe’s raised its full-year guidance but lowered operating margin expectations, and a challenging market caused a selloff.
- Despite high debt levels, Lowe’s strong cash flows, strategic investments, and improvements in Pro and online sales support a hold rating.
JillianCain
Investment Thesis
Lowe’s Companies, Inc. (NYSE:LOW) continues to expand its margins gradually and take market share in the home improvement space. The company benefits from long-term secular tailwinds like aging housing stock, home price appreciation, and rising disposable income; all which promote increased home improvement spending for decades to come. Despite near-term challenges, including DIY market weakness and cyclical headwinds, Lowe’s continues to gain market share in professional sales and grow its online and omnichannel capabilities. Significant debt levels and uncertain economic conditions pose risks, but the LOW’s strong cash flows and strategic investments in efficiency and customer retention position it well for long-term growth.
Home improvement market weakness and slowing growth are what prompted me to downgrade the stock to a hold rating in July. Even though my call was a little early and the stock has outperformed the S&P500 (SP500) substantially, I maintain a hold rating on LOW, as the market does not appear conducive for outperformance in the near term. However, I believe the company is performing well and remains well-positioned to take market share long-term and potentially outperform the broad market. LOW is going through a cyclical downturn right now.
In this article, I review Q3 earnings and explain why I believe Lowe’s remains a stock to hang on to for the long run.
Earnings Review
LOW reported stronger-than-expected earnings and raised full-year guidance, but shares of the company fell 4.6% on Tuesday, November 19, 2024. The reason for the sell-off following earnings is likely due to several factors: LOW’s management attributing the earnings beat largely to storm-related sales, operating margin contraction, and continued uncertainty in the home improvement market, especially in the do-it-yourself (DIY) segment. LOW’s DIY customers are delaying big-ticket purchases, and the company has lowered its FY operating margin target. After a run-up in share price, investors may be logging gains and looking to buy back in on a sell-off and avoid near-term losses.
During Q3, Lowe’s generated $20.2 billion in sales, a decline of 1.5% YoY. Comp sales declined by 1.1%. GAAP diluted EPS was $2.99 (-2.3% YoY), while adjusted EPS (excluding a pre-tax gain on the sale of its Canadian retail business) was $2.89. Comparable average ticket price was up 0.2%, but comp transaction totals decreased by 1.3% on weakness in DIY discretionary projects. LOW saw growth in pro transactions, but weakness in its DIY segment. Monthly comps improved each month during the quarter (-3.3% in August, -1.2% in September, and 1.3% in October), a positive trend that must be maintained before the market trusts in the near-term outlook for sales growth. Impacts from the hurricanes increased sales by 100 bps.
Gross margin benefitted from LOW’s ongoing PPI initiatives, with the impacts of supply chain investments and storm-related lower-margin mix mostly offsetting these improvements. Adjusted operating margin declined 86 basis points to 12.3%.
LOW raised its full-year 2024 guidance: it now expects sales of $83.0 billion to $83.5 billion (from $82.7B to $83.2B), comp sales of -3.0 to -3.5%, and adjusted diluted EPS of $11.80 to $11.90 (from $11.70 – $11.90). However, the company lowered its adjusted operating margin expectations to a range of 12.3% to 12.4% (from 12.4% to 12.5%) and stated that the environment going forward remains challenging and the uncertainty about the direction of interest rates remains.
Turning to the balance sheet, cash and equivalents increased to $3.61 billion from $1.53 billion at the end of Q3 2023. Inventory is roughly flat over the last year, at $17.57 billion. LOW has $35.48 billion in total long-term debt, a YoY reduction from $35.92 billion.
During Q3, Lowe’s repurchased approximately 2.9 million shares for $758 million, and paid $654 million in dividends. The current dividend is $1.15 per share, up from $1.10 a year ago. This increased cash balance, share repurchases, and dividends are supported by healthy cash flows. LOW generated $8.71 billion in operating cash flow during the nine-month period that just ended, an increase of 23.9% YoY. Capex was nearly flat over the prior year period, which helped LOW deliver free cash flow of $7.34 billion over the nine-month period, an increase of 29.0% from the $5.69 billion LOW generated in 2023.
It is important to note that LOW increased cash flows largely due to the lapping of a large deferred federal tax payment that was made in early 2023 and the stretching of accounts payable during Q3. Therefore, the increase in both OCF and FCF is largely attributable to nonoperational impacts.
Segment Discussion
Without the 10-Q, I’m basing the segment discussion on management’s earnings call commentary and working on limited information.
LOW’s seasonal and outdoor living and hardware segment delivered positive comps. Hardlines also had positive comps partially due to hurricane-related sales of generators, chainsaws, and other items needed to clean up and recover from the storms. Some of these items contributed lower margins sales, which negatively impacted product mix. Increased transportation costs and logistical costs related to the storms also cut into operating margin. Overall, the storm sales were accretive to earnings.
Building products saw above-average comp sales, while home decor suffered from weak big-ticket projects. Sequential QoQ improvement was made in appliance sales, with new washer and dryer items being called out as drivers of average ticket size growth.
Recent Financial Performance
The table below shows LOW’s quarterly performance since Q1 2020. I have labeled each metric for Q3 of each year for easy Q3 comparison. Revenue was pulled forward during COVID, but the company maintains a gross margin, operating margin, and net margin higher than pre-pandemic times.
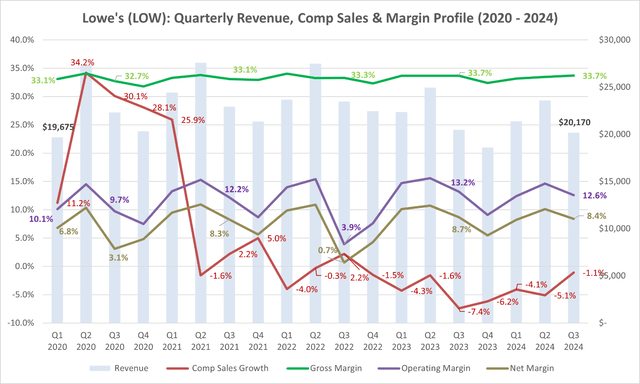
LOW’s Sales growth and margins (Author-generated Chart (w/ data from SEC Filings))
Comp sales have been weak since lapping an incredible pandemic-driven period of time. Gross margin has remained strong, showing the company’s pricing power and sustained moat. Operating margin and net margin expansion over the longer term shows that LOW is benefitting from improving efficiency from supply chain improvements and cost efficiencies.
Growth Areas
Pro Sales and online sales are two things I want to see improve for LOW’s over the long run. In Q3, both of these areas were relatively strong.
LOWs saw high single-digit comp growth in Pro sales. This is particularly promising, as this is traditionally a weaker area for LOW when compared to The Home Depot (HD). This growth was spread amongst categories and regions and appears to be sustainable given the focus that LOW has put into growing this part of its business. It’s also a huge growth opportunity in a fragmented market. Based on Marvin Ellison’s comments during the earnings call and at the Goldman Sachs 31 st Annual Global Retailing Conference in September, LOW continues to gain market share in the small and medium-sized professional builders market. When Ellison arrived in 2018, the company did not have a strategy to serve these customers and was able to begin improving penetration in this market by making strategic changes, such as ensuring it always held inventory relevant for its core pro customers and optimizing its digital experience to deliver to them more efficiently. LOW’s Pro loyalty program is another driver of retention in this customer category. LOW needs to continue taking pro-market share; it doesn’t need to beat HD in the pro market.
Online comp sales grew 6% during the quarter thanks to a double-digit increase in online traffic and higher conversion rates. LOW’s continues to improve its online sales experience with its “in store mode” in its Lowe’s app and same-day delivery for many items. The company reported positive engagement in its newly launched MyLowe’s rewards loyalty program. During the earnings call, management stated it is seeing increasing repeat purchases, average order value, and large purchase penetration amongst its loyalty members. This could be an important retention tool during a challenging market and in a year with one fewer week of holiday shopping between Thanksgiving and Christmas. LOW’s is offering some great early Black Friday deals that are tempting me to spend money on unnecessary items. Perhaps this will help boost sales in Q4.
Long Term Demand Drivers
Lowe’s commonly cites its historic demand drivers, which are home price appreciation, disposable personal income growth, and the age of housing stock. All three of these factors are directionally heading in the right direction. These are why I continue to hold the stock without concern for short-term market cycles.
Aging Housing Stock
In previous articles, I have focused on the aging housing stock as a main part of my long-term investment thesis. In July, I discussed the long-term housing opportunity, Lowe’s expanding margins, and Return on Invested Capital. In February, I mainly focused on the aging housing stock. I will not repeat myself here because I have covered it more deeply.
In summary, the median home age in the United States is about 41 years old. Older homes require increasing maintenance, inevitable renovations, and, eventually, replacement. This will sustain market growth for LOW, just as it does for HD.
Real Disposable Personal Income Growth
Real disposable personal income per capita growth contributes to LOW’s success and appears supportive going forward.
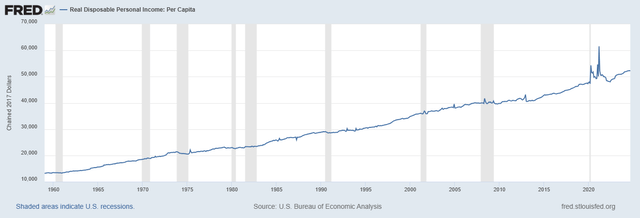
Real Disposable Income (Bureau of Economic Analysis (St. Louis FRED))
This metric is adjusted for inflation and shows that purchasing power for US consumers continues to grow. Unless something drastic changes, this metric should continue to move up and to the right which will support market growth for LOW.
Home Price Appreciation
Home price appreciation remains strong, and with a shortage in new housing starts, the long-term trend will likely continue. More valuable homes and increasing home equity spur investment into improving one’s home and increase the ability to tap into home equity to finance home improvement projects.
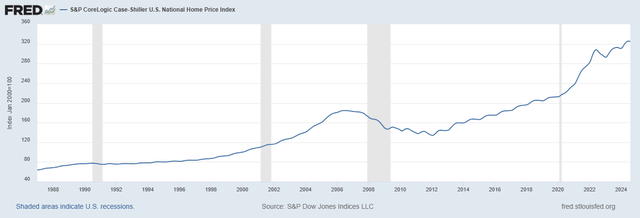
Home Price Appreciation Trend (Bureau of Economic Analysis (St. Louis FRED))
Catalysts for an inflection in sales for LOW will likely come from lower rates, with further support coming from continued home price appreciation. With housing turnover remaining at thirty-year lows and a lack of meaningful new builds, it appears there won’t be enough new supply to challenge increasing home values.
Millennial housing formation was discussed during the earnings call and the Goldman Sachs conference as a driver of long-term growth, as was the aging in place of baby boomers, and continued work-from-home trends that may be lessening but remain sticky.
Positioning To Win When Tailwinds Return
LOW’s is well-positioned to benefit from the market turning around. I have already discussed the company’s improvements in both pro and online sales. It has managed to survive a DIY downturn by improving these areas. Long term demand trends remain in place and the company has modernized its supply chain, its retail warehouses and omnichannel platform.
Valuation
To value Lowe’s, I utilized a reverse DCF model, with a 10.0% discount rate (hurdle rate) and a 2.5% terminal growth rate. The base free cash flow used is LOW’s TTM FCF of $7.823 billion. The hurdle rate represents the expected stock return, assuming that LOW is intrinsically valued based on the present value of future free cash flows. The terminal growth rate is roughly in line with GDP, perhaps with a slight premium, which is warranted given the long-term demand for home improvement.
Based on the current share price of $263.03, LOW needs to roughly compound FCF growth at a CAGR of 7.0% over twenty years to justify the current share price. This growth rate is broken down into two phases: an 8.0% CAGR in years 1-10 and a 5.5% CAGR in years 11-20 before reaching a 2.5% terminal CAGR.
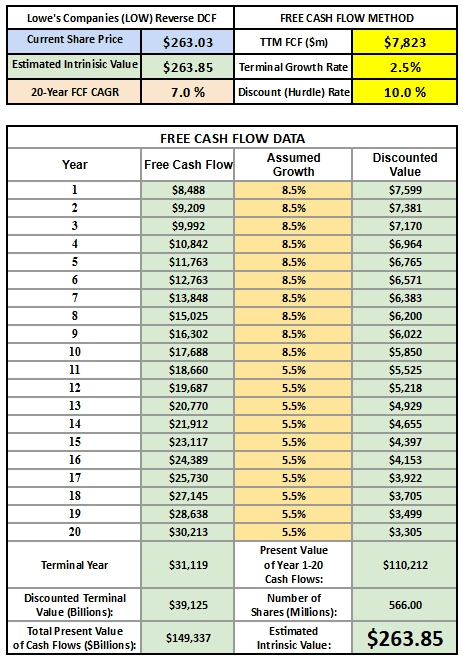
Reverse DCF (Author-Generated Reverse DCF Model (Model adapted with permission from StockInvestingMentor.com)
In any valuation exercise, it’s important to point out that this reverse DCF model doesn’t factor in debt levels or valuation multiples. It assumes that the stock is valued intrinsically, which is a theoretical concept that may be directionally correct.
The question is whether Lowe’s can grow at that rate. The company has grown FCF at a 7.0% CAGR since 2014 and appears to be making significant strides in improving efficiency and taking pro market share. While I believe this is possible, I only rely on my valuation model for part of my analysis. I am more concerned with Lowe’s demand drivers, market positioning, and improving in the key areas outlined above.
I do not see a large margin of safety in the current share price.
Risks
Lowe’s is at the mercy of the home improvement cycle, which is one reason the business is underperforming right now. If the United States enters a recession and/or inflation remains sticky or re-accelerates and interest rates remain elevated, it will likely limit the upside for Lowe’s despite the company’s long-term tailwinds.
However, when you look under the hood, the company is improving in needed growth areas, such as pro customer and online sales penetration, and showing that it may be ready to come out of the cycle’s trough in a strong position. This may be a near-term issue and may present a good buying opportunity at some point.
Debt levels remain rather high, at over $35 billion, but considering that LOW can generate enough OCF to pay that off in roughly four years or less, and that the company continues to invest in market share gaining initiatives, I don’t see this as a big problem.
Conclusion
Lowe’s benefits from long-term secular tailwinds. Homes continue to age, home prices continue to appreciate, and consumer’s real disposable income continues to grow. All of these factors drive home improvement spending, and Lowe’s holds a dominant position in the DIY home improvement market and continues to capture share in the pro market. Improving its pro and DIY shopping experience should help LOW continue on this path over the long run.
My investment thesis relies on the company continuing to improve in the areas it can control, which it did in Q3. As Lowe’s continues to improve in these areas, I feel confident in maintaining my hold rating despite a challenging time. Rather than attempting to beat the market by trading in and out of a stalwart company, I prefer to buy the LOW stock when the perceived margin of safety is higher and utilize it as a long-term buy-and-hold position to diversify my higher-beta tech holdings, offer lower downside but with market-beating potential.
I plan to add to my position on a substantial dip in price or if the company’s financial position improves enough to warrant an improved long-term outlook. I rate LOW as a hold for the time being.
Analyst’s Disclosure: I/we have a beneficial long position in the shares of LOW, HD either through stock ownership, options, or other derivatives. I wrote this article myself, and it expresses my own opinions. I am not receiving compensation for it (other than from Seeking Alpha). I have no business relationship with any company whose stock is mentioned in this article.
Seeking Alpha’s Disclosure: Past performance is no guarantee of future results. No recommendation or advice is being given as to whether any investment is suitable for a particular investor. Any views or opinions expressed above may not reflect those of Seeking Alpha as a whole. Seeking Alpha is not a licensed securities dealer, broker or US investment adviser or investment bank. Our analysts are third party authors that include both professional investors and individual investors who may not be licensed or certified by any institute or regulatory body.
