Summary:
- Adobe stock is currently a sell due to weak technicals, especially in the near term, despite reasonable earnings and fair valuation.
- Daily technical analysis shows a short-term downtrend with bearish indicators and moving averages, suggesting continued weakness.
- Weekly analysis indicates mixed signals with both uptrend and downtrend lines, but overall bearish momentum is accelerating.
- Long-term outlook is uncertain with conflicting signals, and despite fair valuation, the technical picture remains net negative.
Sundry Photography
Thesis
While many software stocks have performed quite well over the past few years as a result of the AI boom, Adobe Inc. (NASDAQ:ADBE) stock is still well off its all-time high set in 2021. In the below technical analysis, I determine that this AI laggard is not worth buying since even though the technical outlook improves as we increase the time frame, the long term is still only uncertain at best. For the fundamentals, most recent earnings were quite reasonable as there was steady growth with revenue and EPS beating expectations. At current levels, I also believe the P/E and P/S ratios correctly reflect Adobe’s financials, making the stock fairly valued. Therefore, with weak technicals, especially in the near term, and a stock that is not particularly undervalued, I believe Adobe stock is a sell currently as AI catalysts have not been strong thus far for the company.
Daily Analysis
Chart Analysis
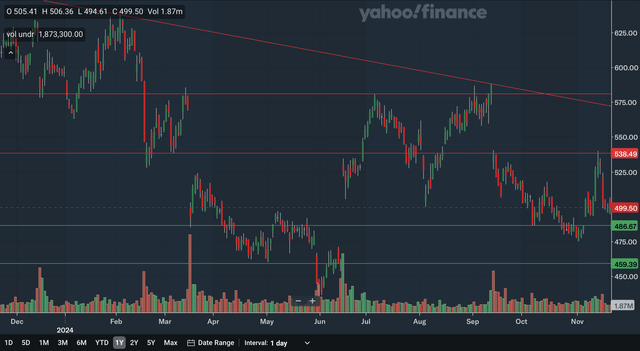
The daily chart is an overall negative one for Adobe, as the stock remains in a short-term downtrend that began earlier in the year. The nearest source of support would be in the mid-480s, with that being an upside gap that formed just earlier this month. The other support area would be at around 460 as that was another major upside gap that formed back in June. As for resistance, the nearest level would be in the high 530s as that level has been both support and resistance throughout the past year, making it a significant area. Next, the downtrend line would be another source of resistance, and it has just moved below 575 and dropping. Lastly, we also have resistance at about 580 as that price level marks a major downside gap that occurred in September. As a whole, while there are both strong support and resistance levels here, being in the downtrend makes the near term outlook a net negative one for Adobe stock.
Moving Average Analysis
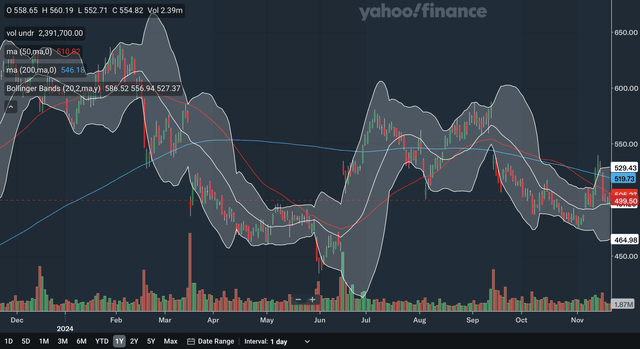
The 50-day SMA crossed below the 200-day SMA back in October, which is a death cross. The gap between the two SMAs has also not stopped widening since the crossover, showing accelerating bearish momentum. The stock currently trades below both of the SMAs with the 50-day SMA providing resistance at around 505. For the Bollinger Bands, the stock is currently holding at the 20-day midline. If the stock does continue to hold above that line, it would be a sign of strength and could indicate that a nearer term uptrend could be starting to form. However, if it crossed below the midline, that would be a sign of weakness and could show that the downtrend is continuing. Overall, I believe the SMAs show a bearish outlook and investors should monitor the Bollinger Bands closely to watch how the stock reacts to the midline.
Indicator Analysis
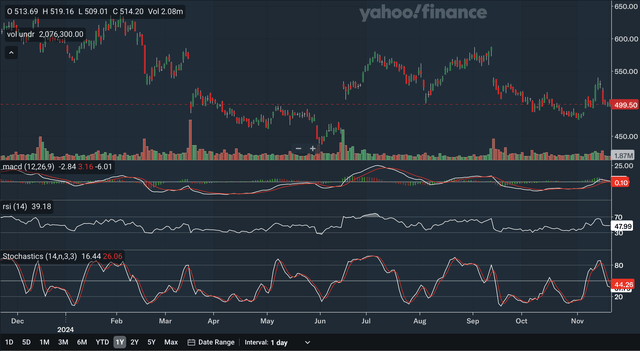
The MACD is currently still above the signal line after a bullish crossover earlier this month. However, the gap between the lines has shrunken significantly, showing that bullishness has been receding as of late. For the RSI, it is currently at 47.99 and just recently broke below the critical 50 level, indicating that the bears have taken over control of the stock. Lastly, for the stochastics, the %K crossed below the %D recently within the overbought 80 zones, a highly bearish signal. The gap between the two lines remains quite large, but the %K’s trajectory has improved somewhat while the %D continues to fall sharply, meaning there is a chance for a bullish crossover moving forward. In my view, despite the MACD still being above its signal line, there are many bearish signals here that can’t be ignored. The indicators are net negative, reflecting a weak outlook for the stock.
Takeaway
With all three of the daily analyses being bearish, I would say that the short-term technical outlook for Adobe is a highly weak one. The chart shows that the stock remains in a short-term downtrend, while the SMAs have formed a death cross recently. As discussed above, the indicators were also mainly negative as well. Therefore, further weakness for the stock in the near term is to be expected.
Weekly Analysis
Chart Analysis
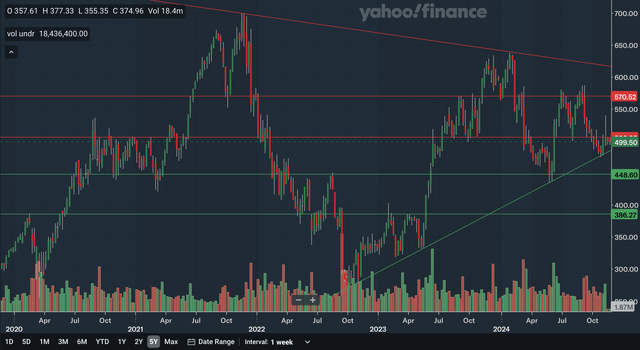
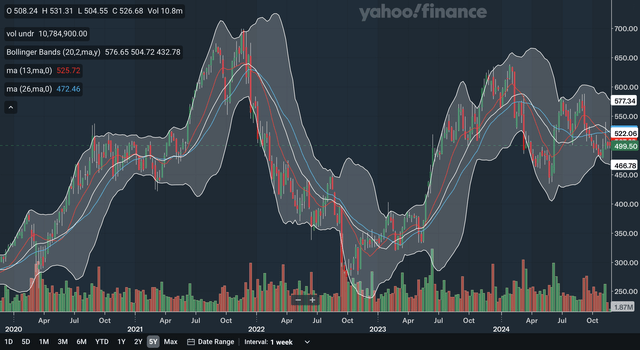
The weekly chart is a mixed one for Adobe. The stock is in both a downtrend and an uptrend, making it seem like a triangle formation is developing. We also have both significant resistance and support for the stock in the intermediate term. The nearest level of support is the uptrend line that is currently nearing 500 and will be key support in the near future as it continues to rise. Moving down, we have support in the high 440s, as that area has been support in 2020, 2021, and earlier this year while being resistance in 2022. The last zone of support would be in the mid-380s, with that price level being resistance in 2020 and 2023, making it a significant area. For resistance, the nearest level is very near the current stock price. This level was major resistance in 2020 and early 2021 but has been key support in 2023 and earlier this year. The 570 price level is also resistance as it was support in 2021 but has been resistance in 2023 and multiple times this year already. Lastly, the downtrend line is nearing 600 and its relevance could increase as it continues to slope downward. From my analysis, the intermediate term outlook is relatively neutral but also quite uncertain as there is both an uptrend and downtrend occurring.
Moving Average Analysis
The 13-week SMA had a bearish crossover with the 26-week SMA, just very recently, a bearish signal. The gap between the lines is increasing as the trajectory of the 13-week SMA is sharply downward, indicating accelerating bearish momentum. The stock trades below both of the SMAs and so the 13-week SMA is the nearest source of MA resistance for Adobe. For the Bollinger Bands, the stock recently hit the lower band and bounced from that oversold position. It is currently under the 20-week midline, however, showing that the intermediate term downtrend discussed in the charting section may be more powerful than the uptrend. The midline has moved below the 26-week SMA and could also be resistance moving forward. Overall, I would say these MAs show a concerning picture, as there are multiple signs of weakness in Adobe stock present here.
Indicator Analysis
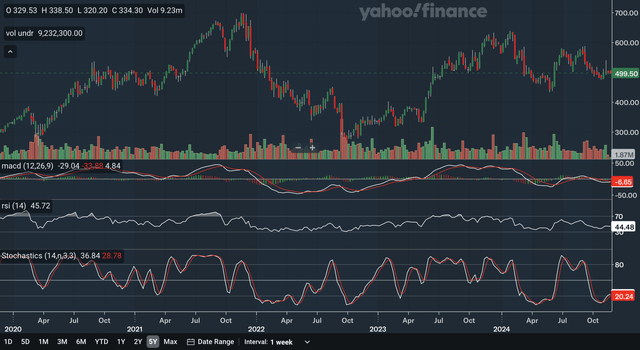
The MACD crossed below the signal line back in September, a bearish indication. The MACD has reduced the gap, however, as indicated by the histogram, showing that the bulls may be regaining strength. For the RSI, it is similar to the daily analysis in that it has slid below the 50 level, showing that the bears have taken control of the stock. The RSI has rebounded slightly recently and is currently at 44.48. Last but not least, for the stochastics, the %K crossed above the %D within the oversold 20 zones just recently, a highly bullish indication. Both of the lines have now risen above the 20 mark, a signal of improving strength. However, the %K line’s trajectory has stalled a bit compared to the %D and so investors should monitor the stochastics closely to see if this is a false positive signal. As a whole, I believe these indicators were quite mixed in their outlooks as there were both signs of strength and weakness, like the bullish stochastics but bearish RSI.
Takeaway
Overall, I would say that the intermediate term technical outlook is a slightly negative one, but is definitely a more positive one than the daily analysis. The weekly chart shows the conflicting uptrend and downtrend lines, while the MAs were the key negative signal here, as there are signs of accelerating bearishness in the stock. Lastly, the indicators were mixed in their signals. The MAs were the deciding factor here, making weakness in the stock more likely in the stock.
Monthly Analysis
Chart Analysis
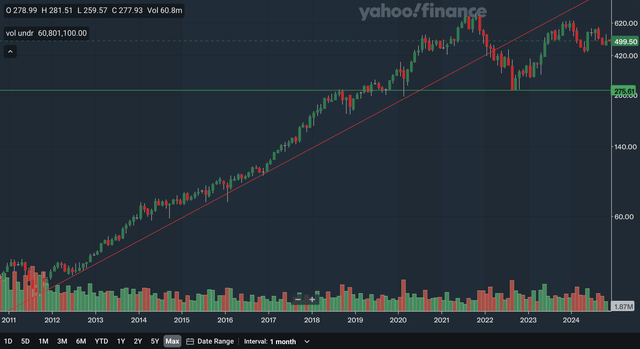
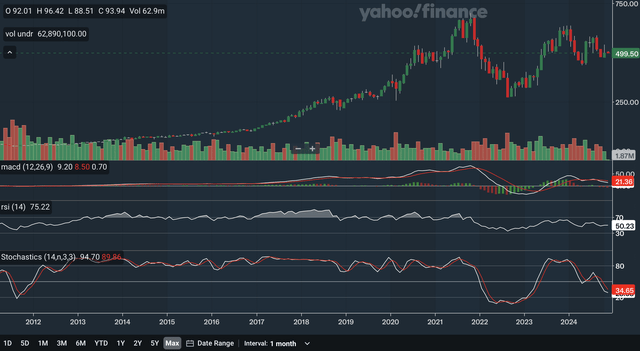
Note that the above chart is on a logarithmic scale to better reflect the long term of Adobe stock. In early 2022, the stock broke below a key uptrend line that dates back to 2011. Although the late 2023 peak did not reach this former uptrend line, it does seem that there is a bit of a resistance effect on the stock. While the stock can certainly still advance even if it remains below this line, the stock is no longer in a long-term uptrend. I have identified a support level that is quite distant, but I believe is still noteworthy given that it stretches back years. The 275 level was resistance in 2018 but was support in 2019 and 2022, making this area a strong area of support if the stock drops to these levels. Lastly, recall that in the weekly charting section, I said that there seems to be a triangle formation developing. Since the triangle is a continuation pattern, there is a significant chance that the stock may continue its upward run, as the trend was heavily up before this pattern occurred. Therefore, despite being below the former uptrend line, the stock’s outlook may not be that poor. From my analysis, I would say that the monthly chart shows a slightly net positive outlook as being under the long-term uptrend is a negative, but the triangle pattern could indicate future gains in the stock.
Moving Average Analysis
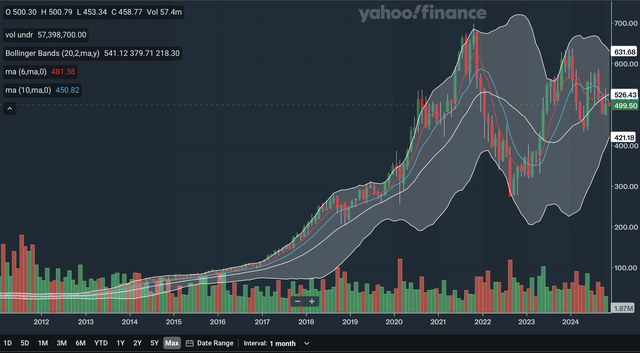
The 6-month SMA had a bullish crossover with the 10-month SMA quite recently, which is a positive indication. However, the gap between the SMAs has remained small with the 6-month SMA’s trajectory turning negative, showing that the bulls have been weak. As another sign of weakness, the stock also currently trades below both of the SMAs. With both SMAs now falling, the stock may be pressured in the near future. For the Bollinger Bands, the stock broke below the 20-month midline a few months ago. As you can see, in the bull run that lasted from 2011 to 2021, the stock consistently held above the midline as the line is supposed to act as support in an uptrend. The stock breaking beneath the midline here shows we are no longer in an era where the bulls are highly dominant. In my view, despite the 6-month SMA still being above the 10-month SMA, there are many signs of weakness with the stock here, making the outlook a negative one.
Indicator Analysis
The MACD had a bearish crossover with the signal line a few months ago, a bearish signal. The gap between the lines has also widened, indicating an increase in bearishness in the stock. For the RSI, it is currently at 50.23, just holding above the 50 level, which is a sign of resilience from the bulls. However, investors should monitor to see if the RSI falls below this level, which would indicate the bears taking control. Lastly, for the stochastics, the %K crossed below the %D also a few months ago, a bearish signal even though the crossover did not take place within the overbought 80 zones. The gap between the lines has been narrowing though as the %K’s trajectory improves, indicating receding bearish momentum. Overall, these indicators show a mixed picture as there were both signs of strength, like the narrowing of the stochastics gap, but also bearish indications, like the widening of the MACD gap.
Takeaway
The highly mixed signals from the monthly analyses show that the long term is quite uncertain for Adobe stock. The chart showed conflicting signals of being below a key uptrend line, but also being in a bullish triangle formation. The MA analysis was overall negative but the indicators, as discussed above, were highly mixed in their signals. In my view, this shows a messy picture that I believe long-term investors should avoid, particularly after considering the opportunity cost of holding Adobe stock.
Fundamentals & Valuation
Earnings
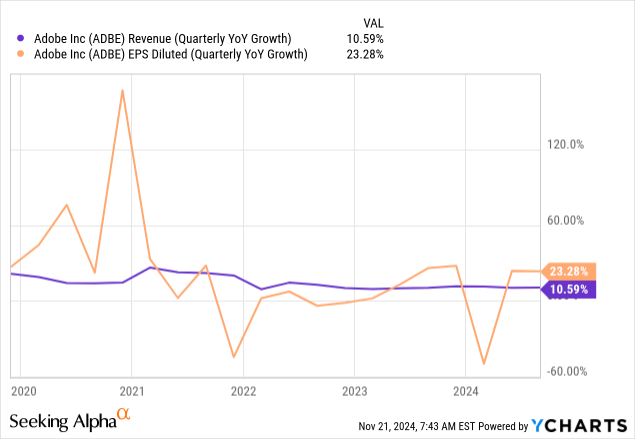
On September 12th, Adobe reported their 2024 Q3 earnings and showed respectable results overall. They reported revenues of $5.41 billion, up 11% YoY from $4.89 billion. In terms of EPS, they reported a GAAP figure of $3.76, up 23% YoY from $3.05. Both revenue and EPS beat expectations, as revenue beat by $34.91 million while GAAP EPS beat by $0.26. Looking at the chart above, you can see that revenue growth is currently a bit weaker compared to the past few years. From 2023 to present, revenue has been relatively stable though, showing that the business is at least growing relatively consistently. For EPS growth, after major negative growth earlier in the year, it is back to being positive and is at around average levels.
Valuation
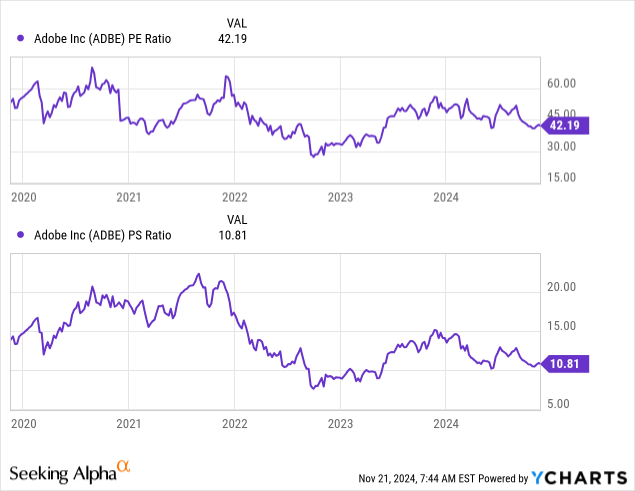
The P/E and P/S ratios are well off the five-year highs, but they have also rebounded significantly from the 2022 low. The P/E ratio is currently at 42.19 after being over 60 as recent as 2021 and being under 30 in 2022. For the P/S ratio, it is currently at 10.81 after being over 20 in 2021 and being at around 7.5 in 2022. Comparing the P/E chart to the above EPS growth chart, I believe the stock is currently fairly valued since the average level growth rate is met with an average level P/E ratio. The P/E ratio, I believe, accurately reflects Adobe’s earnings position. For the P/S ratio, when comparing it to the revenue growth chart above, I also believe the stock is fairly valued since a below-average revenue growth rate is met by a below average level in the P/S ratio. Both the P/E and P/S ratios mirror their respective growth charts quite well, leading me to believe that the stock is fairly valued at current levels.
Conclusion
Even though the technicals seem to look better as we zoom out from the near term and focus on the long term, there is no question that the technicals indicate an overall weak outlook for Adobe stock. The near term analysis was highly bearish with charts, moving averages, and indicators signalling that continued weakness is likely. The strongest was the long term, but it was still highly mixed, with conflicting signs of both strength and weakness. As for the fundamentals, as discussed above, earnings were satisfactory as they were able to beat expectations and show decent growth. Given that the P/E and P/S ratios reflect Adobe’s financial growth quite well, I concluded that the stock is fairly valued at current levels. Therefore, as a whole, I believe Adobe stock is not worth buying right now and is, in fact, a sell as a reasonable valuation is unable to offset a net negative technical picture.
Analyst’s Disclosure: I/we have no stock, option or similar derivative position in any of the companies mentioned, and no plans to initiate any such positions within the next 72 hours. I wrote this article myself, and it expresses my own opinions. I am not receiving compensation for it (other than from Seeking Alpha). I have no business relationship with any company whose stock is mentioned in this article.
Seeking Alpha’s Disclosure: Past performance is no guarantee of future results. No recommendation or advice is being given as to whether any investment is suitable for a particular investor. Any views or opinions expressed above may not reflect those of Seeking Alpha as a whole. Seeking Alpha is not a licensed securities dealer, broker or US investment adviser or investment bank. Our analysts are third party authors that include both professional investors and individual investors who may not be licensed or certified by any institute or regulatory body.

